
Trade The World
Silver Price Forecast: XAG/USD flirts with short-term trading range hurdle, above $37.00
작성자 Haresh Menghani
게시일: 11 Jul 2025 | 수정일: 11 Jul 2025


POPULAR ARTICLES

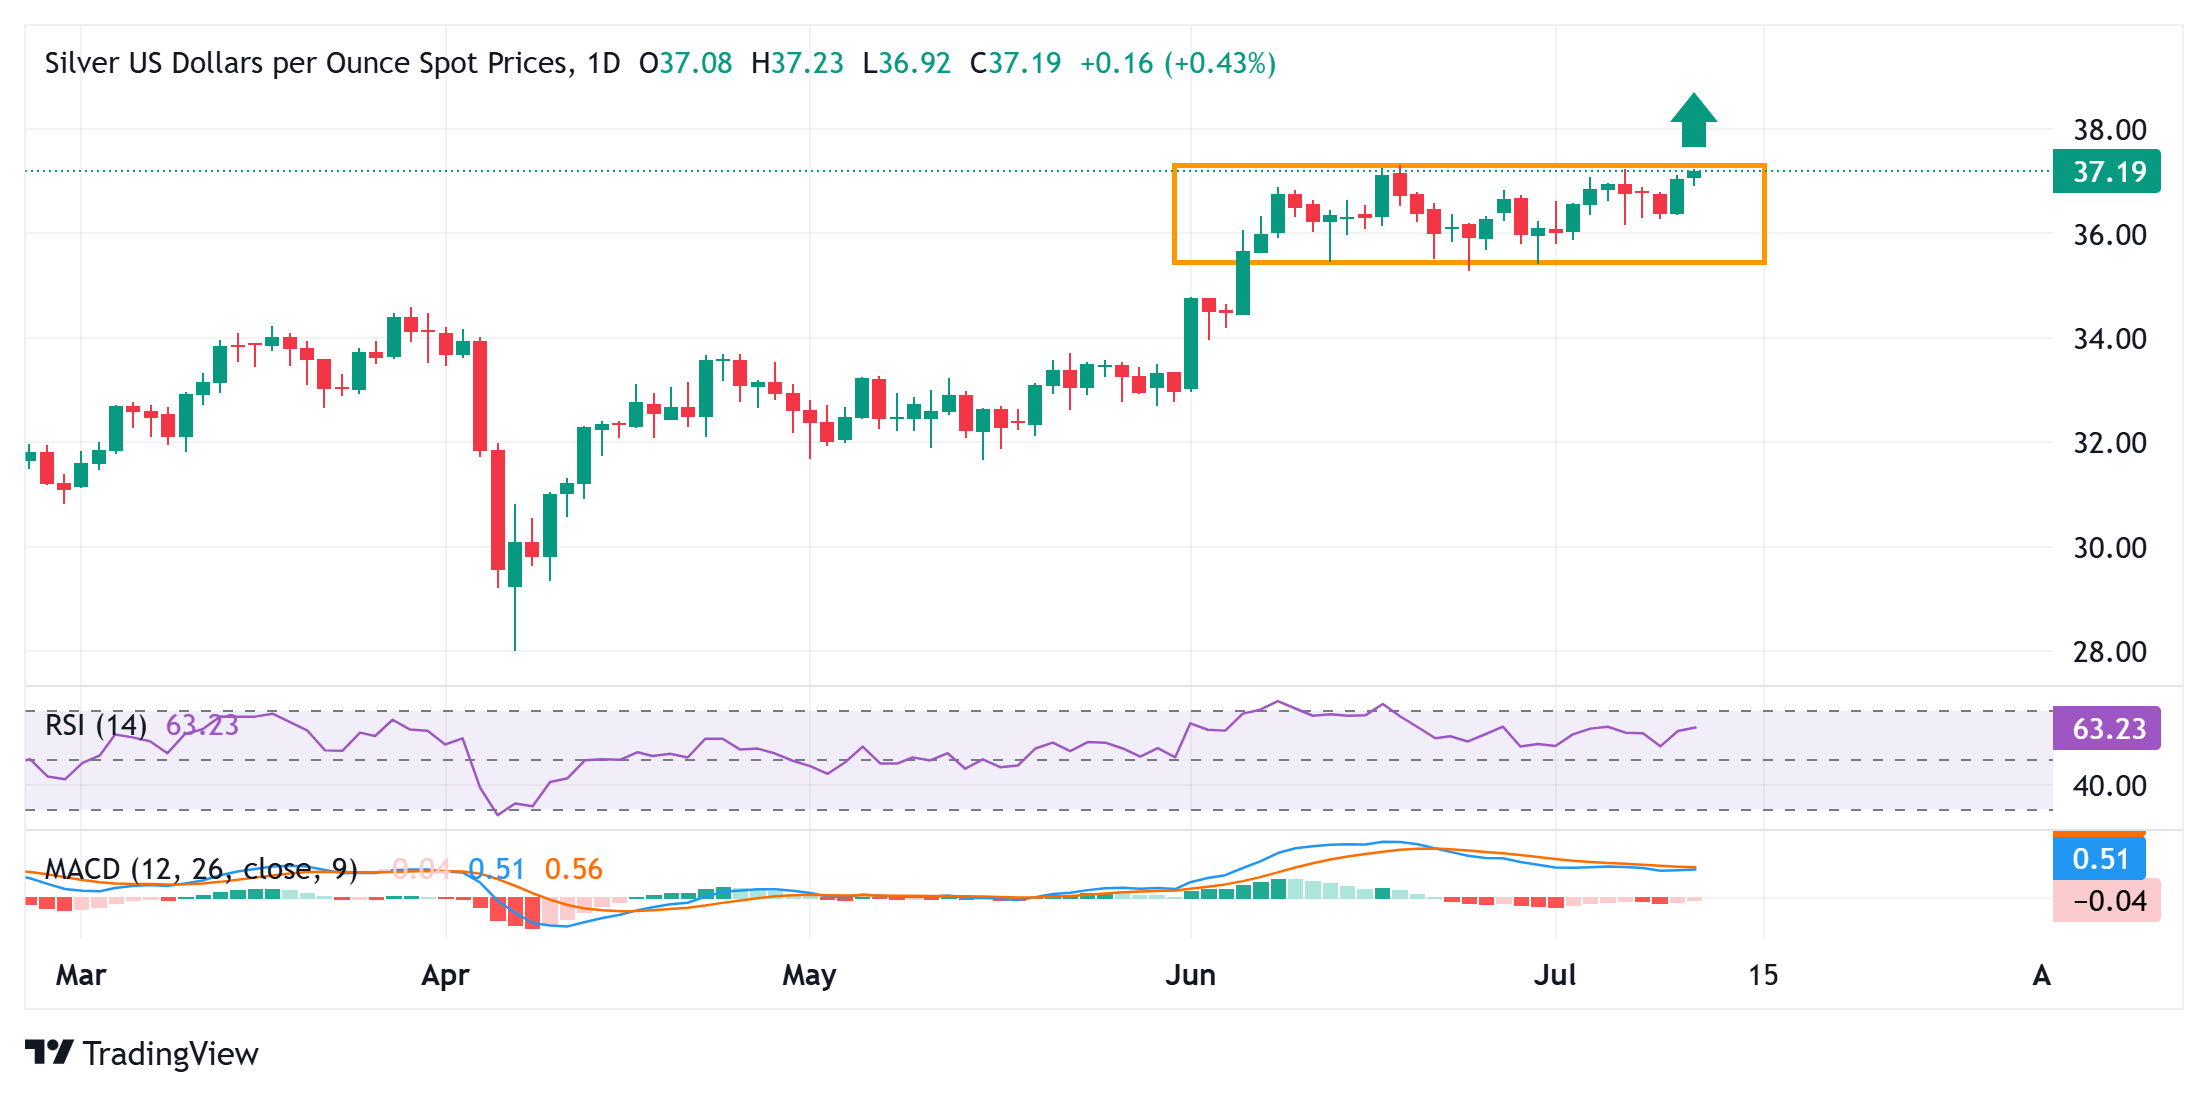
Silver (XAG/USD) trades with a positive bias for the second straight day and tests the top end of a multi-week-old range during the Asian session on Friday. The white metal currently trades around the $37.20 region, up 0.40% for the day.
- Silver adds to the previous day’s strong move up and gains traction for the second straight day.
- A move beyond the $37.30-$37.35 area would set the stage for a further near-term appreciation.
- Any corrective pullback might be seen as a buying opportunity and is likely to remain cushioned.
Silver (XAG/USD) trades with a positive bias for the second straight day and tests the top end of a multi-week-old range during the Asian session on Friday. The white metal currently trades around the $37.20 region, up 0.40% for the day.
From a technical perspective, the daily Relative Strength Index (RSI, 14) remains above 50, while the Moving Average Convergence Divergence (MACD) histogram and the signal line are yet to confirm bullish bias. This makes it prudent to wait for some follow-through buying beyond the $37.30-$37.35 region, or the highest since February 2012 touched last month, before placing fresh bullish bets around the XAG/USD.
The subsequent move up would increase the likelihood of additional gains towards the $38.00 round figure. The next relevant hurdle is pegged near the $38.35-$38.40 region, above which the XAG/USD could extend the momentum towards reclaiming the $39.00 mark for the first time since September 2011.
On the flip side, any corrective pullback below the $37.00 round figure could be seen as a buying opportunity and remain limited near the $36.50-$36.45 area. Some follow-through selling could drag the XAG/USD back closer to the $36.00 mark, which, if broken decisively, should pave the way for a slide towards the $35.50-$35.40 horizontal zone, representing the lower boundary of the short-term trading range.
A convincing break below the latter might then shift the near-term bias back in favor of bearish traders. The XAG/USD might then accelerate the fall towards the $35.00 psychological mark en route to $34.75 intermediate support before eventually dropping to the $34.45 region.
Silver daily chart
Silver FAQs
Silver is a precious metal highly traded among investors. It has been historically used as a store of value and a medium of exchange. Although less popular than Gold, traders may turn to Silver to diversify their investment portfolio, for its intrinsic value or as a potential hedge during high-inflation periods. Investors can buy physical Silver, in coins or in bars, or trade it through vehicles such as Exchange Traded Funds, which track its price on international markets.
Silver prices can move due to a wide range of factors. Geopolitical instability or fears of a deep recession can make Silver price escalate due to its safe-haven status, although to a lesser extent than Gold's. As a yieldless asset, Silver tends to rise with lower interest rates. Its moves also depend on how the US Dollar (USD) behaves as the asset is priced in dollars (XAG/USD). A strong Dollar tends to keep the price of Silver at bay, whereas a weaker Dollar is likely to propel prices up. Other factors such as investment demand, mining supply – Silver is much more abundant than Gold – and recycling rates can also affect prices.
Silver is widely used in industry, particularly in sectors such as electronics or solar energy, as it has one of the highest electric conductivity of all metals – more than Copper and Gold. A surge in demand can increase prices, while a decline tends to lower them. Dynamics in the US, Chinese and Indian economies can also contribute to price swings: for the US and particularly China, their big industrial sectors use Silver in various processes; in India, consumers’ demand for the precious metal for jewellery also plays a key role in setting prices.
Silver prices tend to follow Gold's moves. When Gold prices rise, Silver typically follows suit, as their status as safe-haven assets is similar. The Gold/Silver ratio, which shows the number of ounces of Silver needed to equal the value of one ounce of Gold, may help to determine the relative valuation between both metals. Some investors may consider a high ratio as an indicator that Silver is undervalued, or Gold is overvalued. On the contrary, a low ratio might suggest that Gold is undervalued relative to Silver.

FXStreet
100만 명이 넘는 사용자가 FXStreet를 통해 실시간 시장 데이터, 차트 도구, 전문가 인사이트, 포렉스 뉴스를 이용합니다. 포괄적인 경제 캘린더와 교육 웨비나는 트레이더가 정보를 유지하고 신중한 결정을 내리도록 돕습니다. FXStreet는 바르셀로나 본사와 전 세계 지역에 걸쳐 약 60명의 팀으로 구성되어 있습니다.
Read More


