
Trade The World
Solana-based meme coins PENGU, FARTCOIN, and BONK target key breakouts amid bullish momentum
작성자 Vishal Dixit
게시일: 9 Sep 2025 | 수정일: 9 Sep 2025


POPULAR ARTICLES
Solana-based meme coins such as Pudgy Penguins’ token PENGU, Fartcoin (FARTCOIN), and Bonk (BONK) are a few of the top-performing coins on the broader cryptocurrency market.
- Pudgy Penguins’ token PENGU aims to break out of a falling channel pattern to extend gains.
- Fartcoin’s wedge breakout rally gains traction amid an opposing Death Cross pattern.
- Bonk exceeds the 50-day EMA, targeting a crucial resistance breakout for further recovery.
Solana-based meme coins such as Pudgy Penguins’ token PENGU, Fartcoin (FARTCOIN), and Bonk (BONK) are a few of the top-performing coins on the broader cryptocurrency market. The rising social chatter surrounding the Solana-based meme coins, combined with the technical outlook, suggests a potential extension of the uptrend.
Rising demand for Solana-based meme coins
Santiment’s data shows a surge in social volume and social dominance of the Solana-based meme coins, reaching 85 and 0.15% respectively on Monday. The sudden spike aligns with the broader market recovery, indicating a rise in risk-on sentiment among investors.
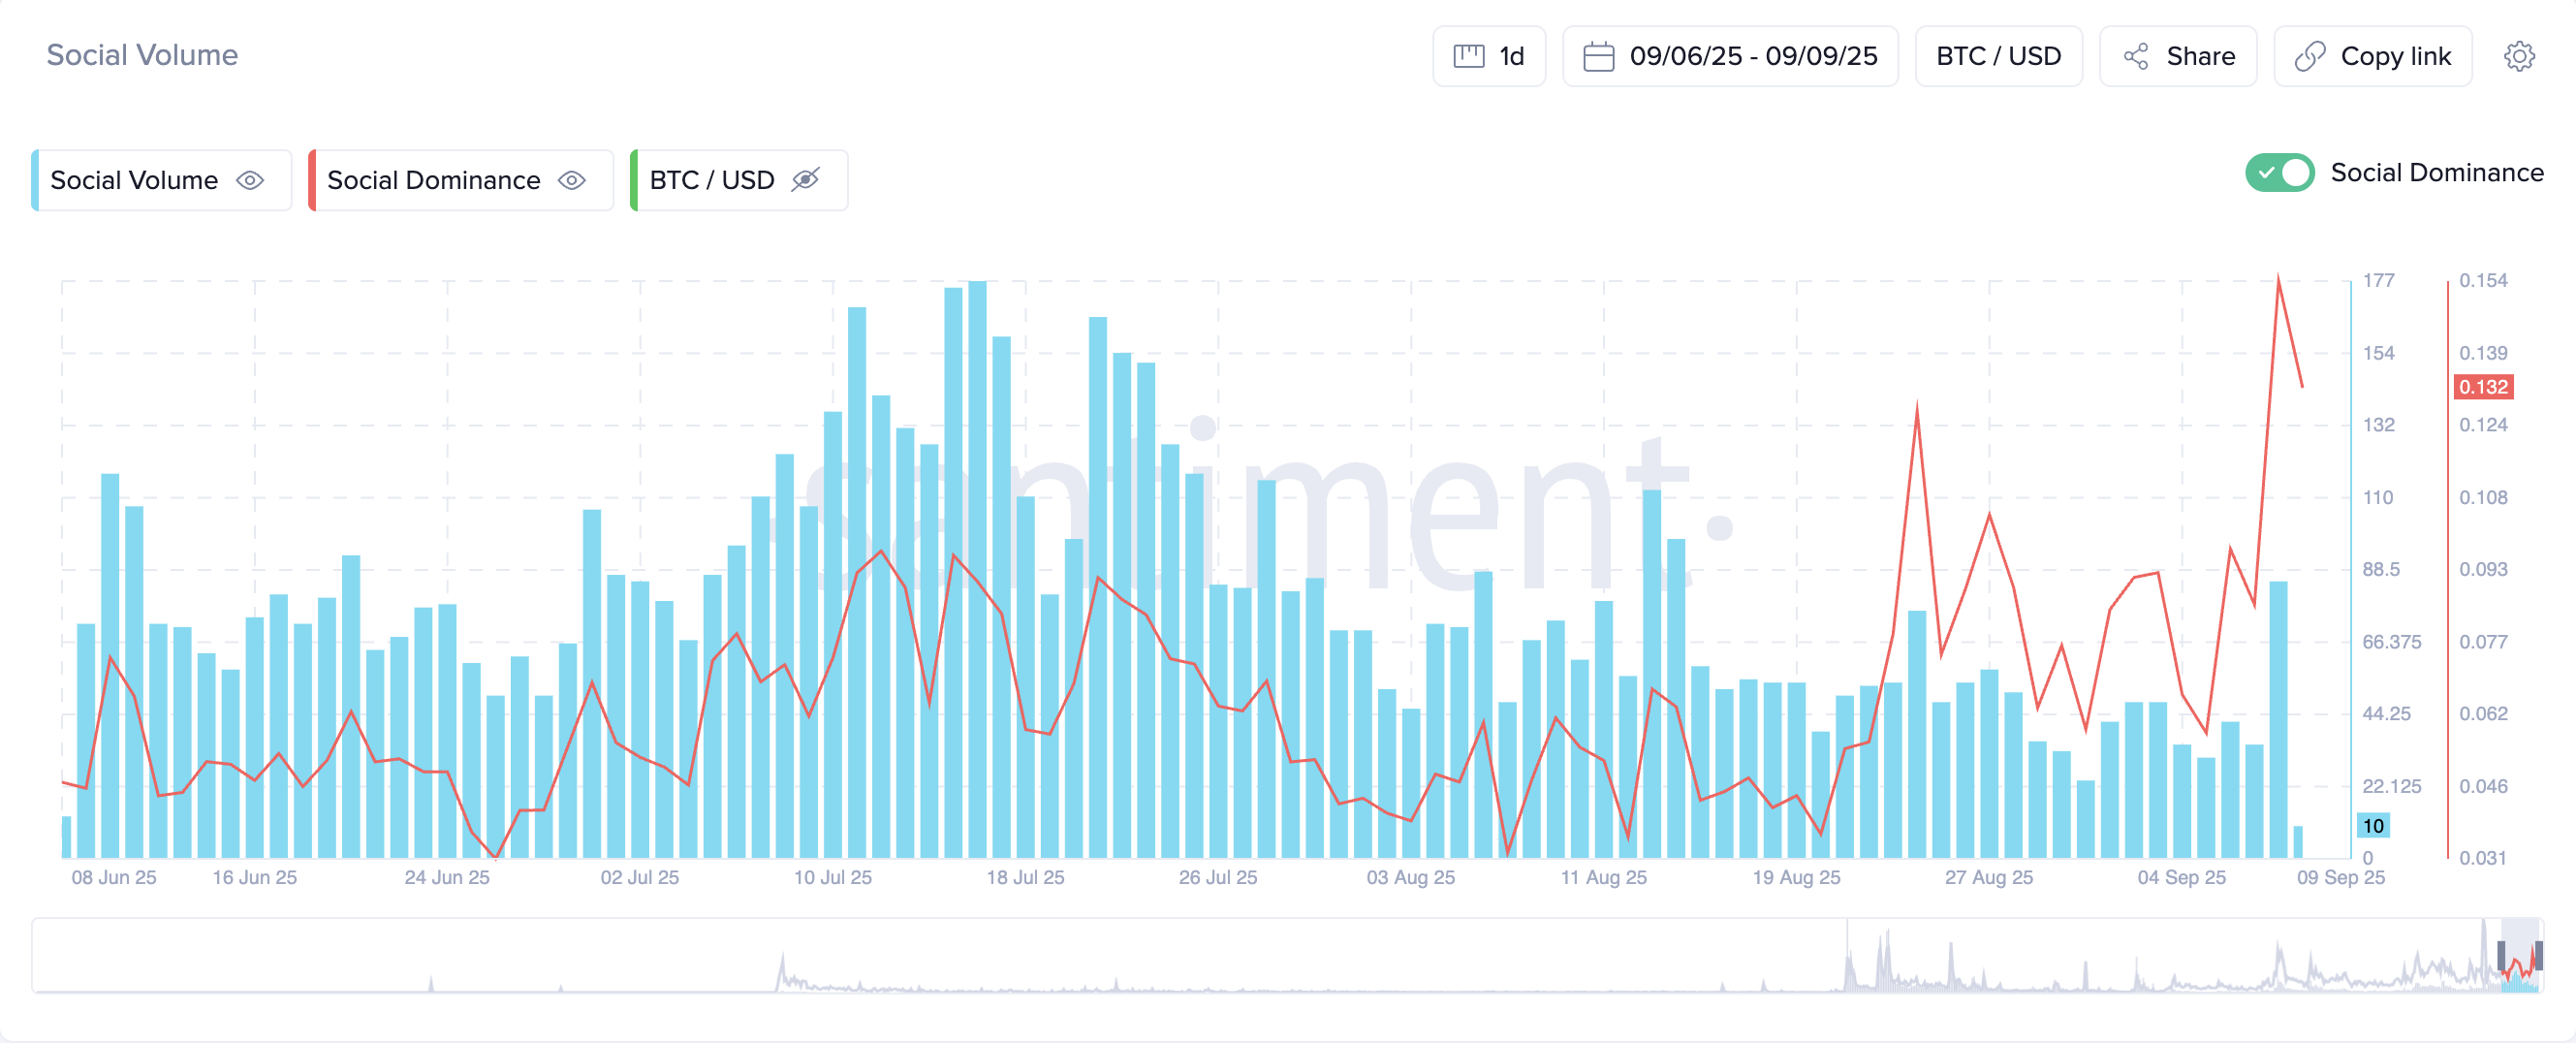
Social Volume. Source: Santiment
Adding to the risk-on sentiment, CoinGlass data shows the Open Interest (OI) of FARTCOIN, PENGU, and BONK has increased by nearly 1%, 15% and 6%, respectively. Notably, despite a spike in trading volumes, the long/short ratio still remains under 1, indicating a bearish imbalance in active derivatives contracts.
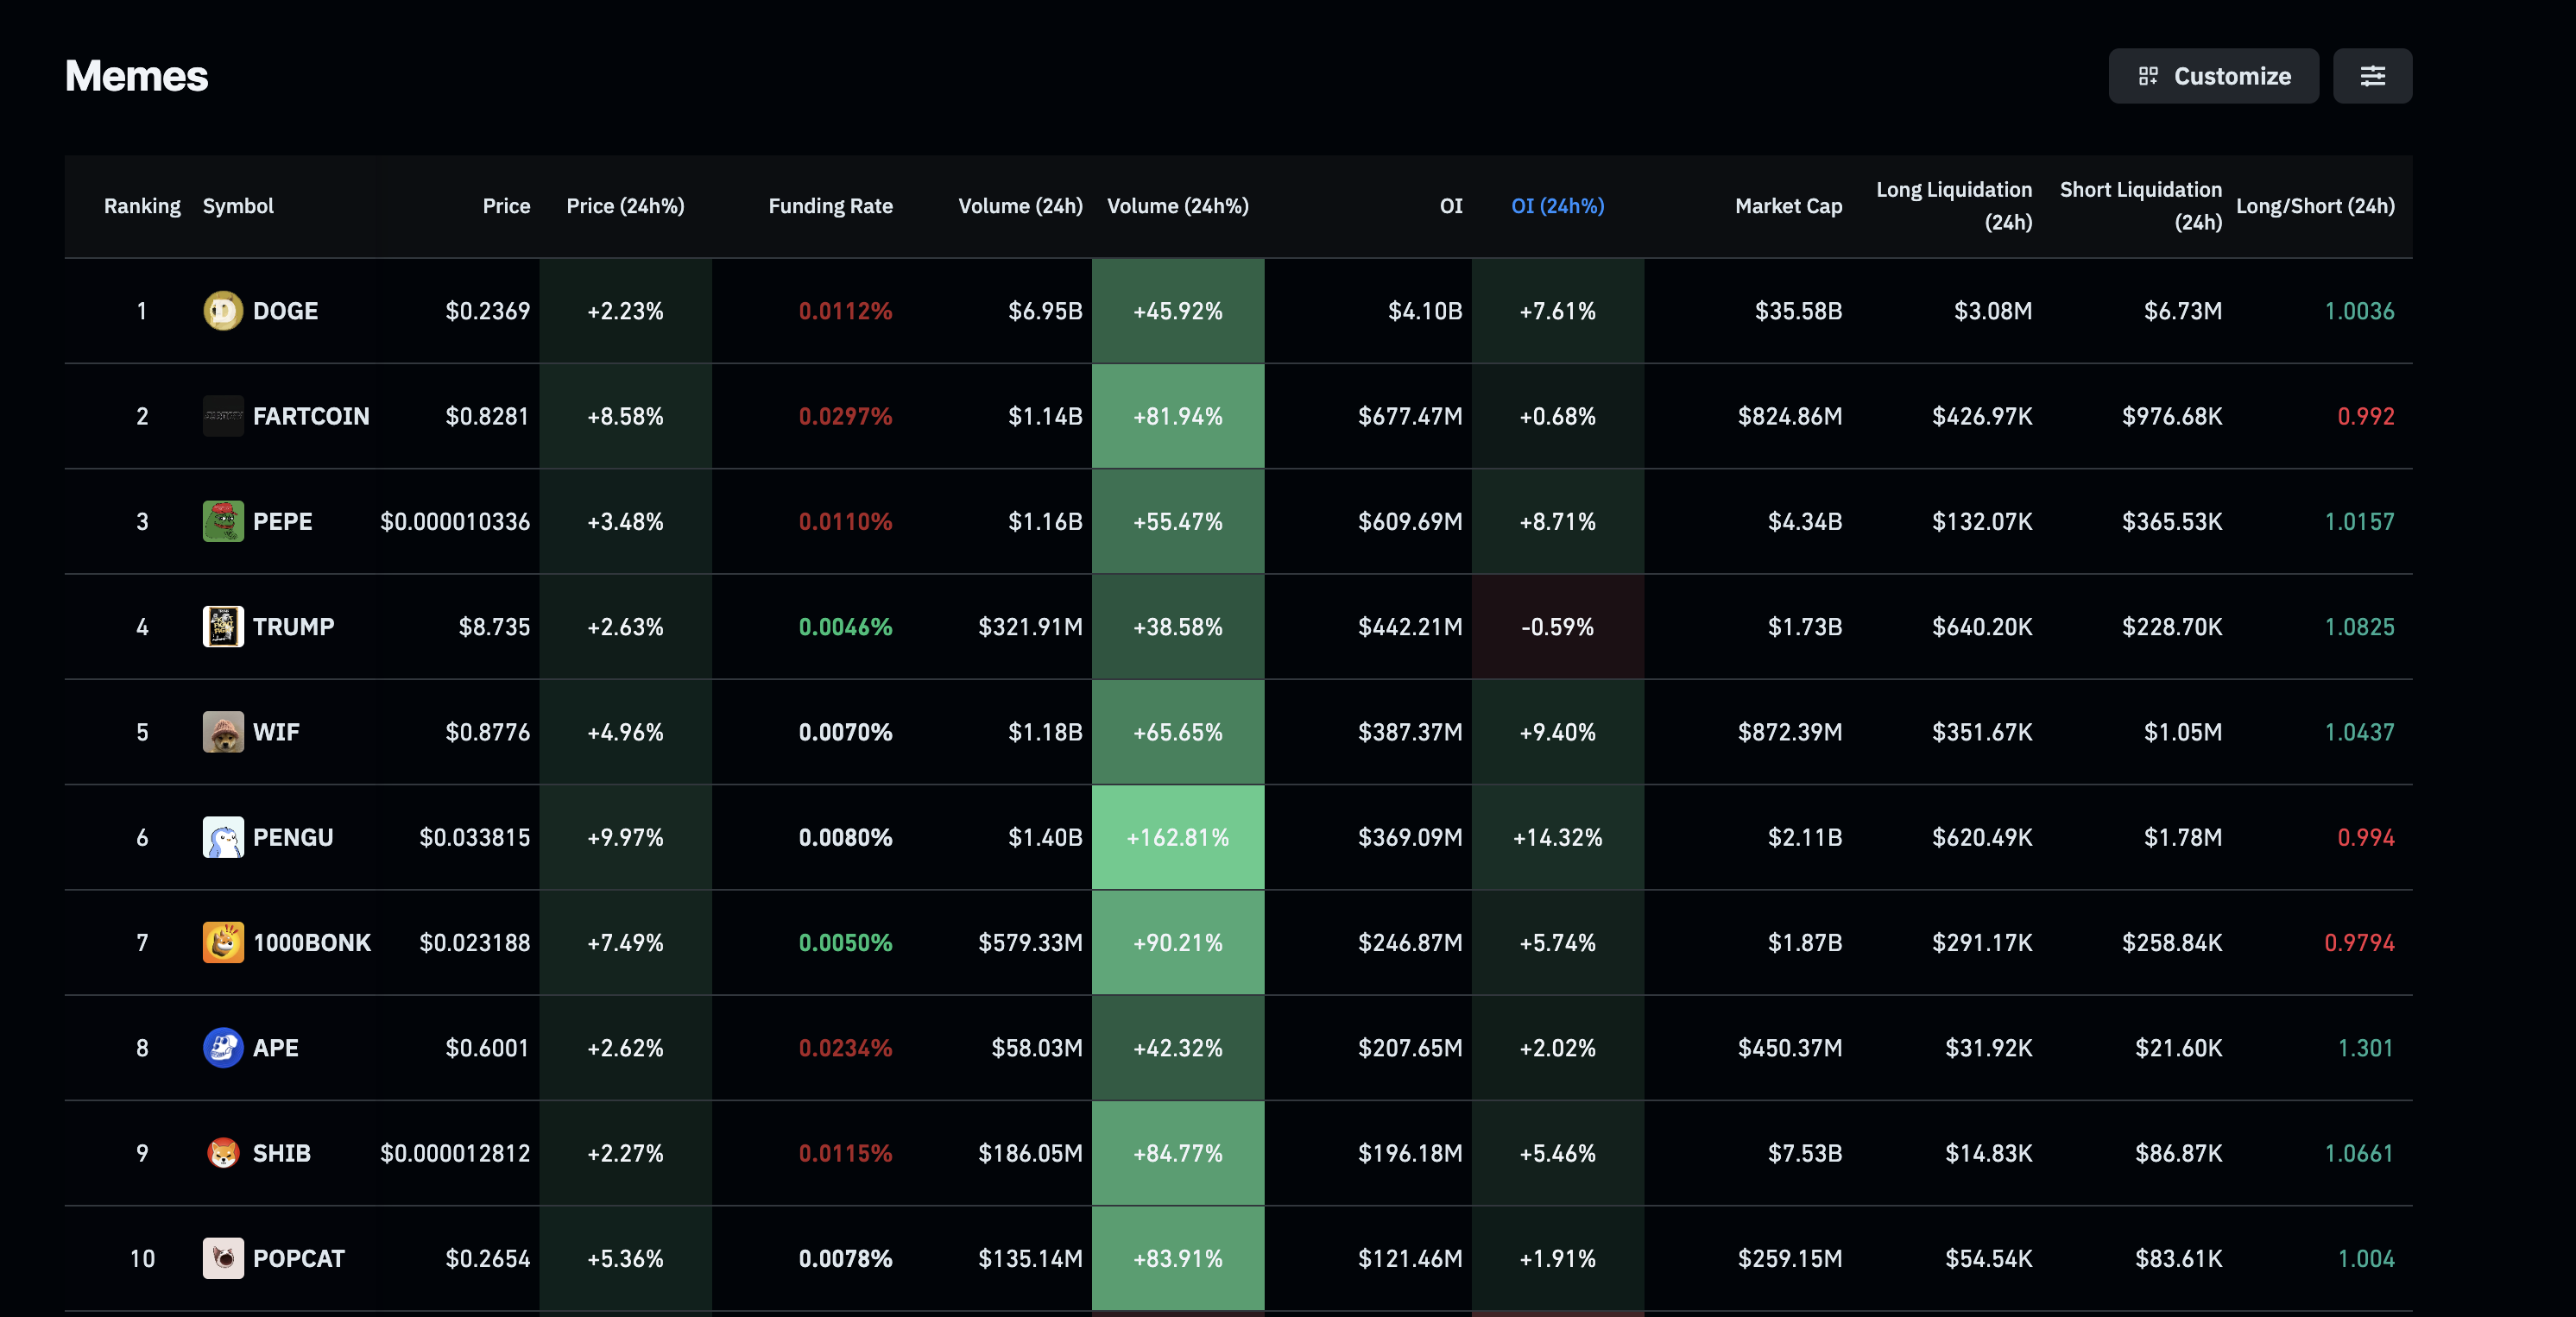
Open Interest. Source: CoinGlass
PENGU nears channel breakout to extend the rally
Pudgy Penguins is an Ethereum-based Non-Fungible Token (NFT) project with a Solana-based PENGU token. PENGU trades above $0.03000 at press time on Tuesday, challenging the overhead resistance trendline of a falling channel pattern on the daily chart.
A decisive close above the Monday high at $0.03464 would confirm the channel breakout, potentially targeting the R1 pivot resistance at $0.03774.
The Moving Average Convergence Divergence (MACD) indicator on the daily chart flashes a surge in bullish momentum with a rise in green histogram bars from the zero line. An uptrend in the MACD and signal line following the crossover on Saturday would trigger a buy signal once it crosses above the zero line.
Additionally, the Relative Strength Index (RSI) on the same chart at 55 hovers above the halfway line, indicating a bullish tilt in trend.
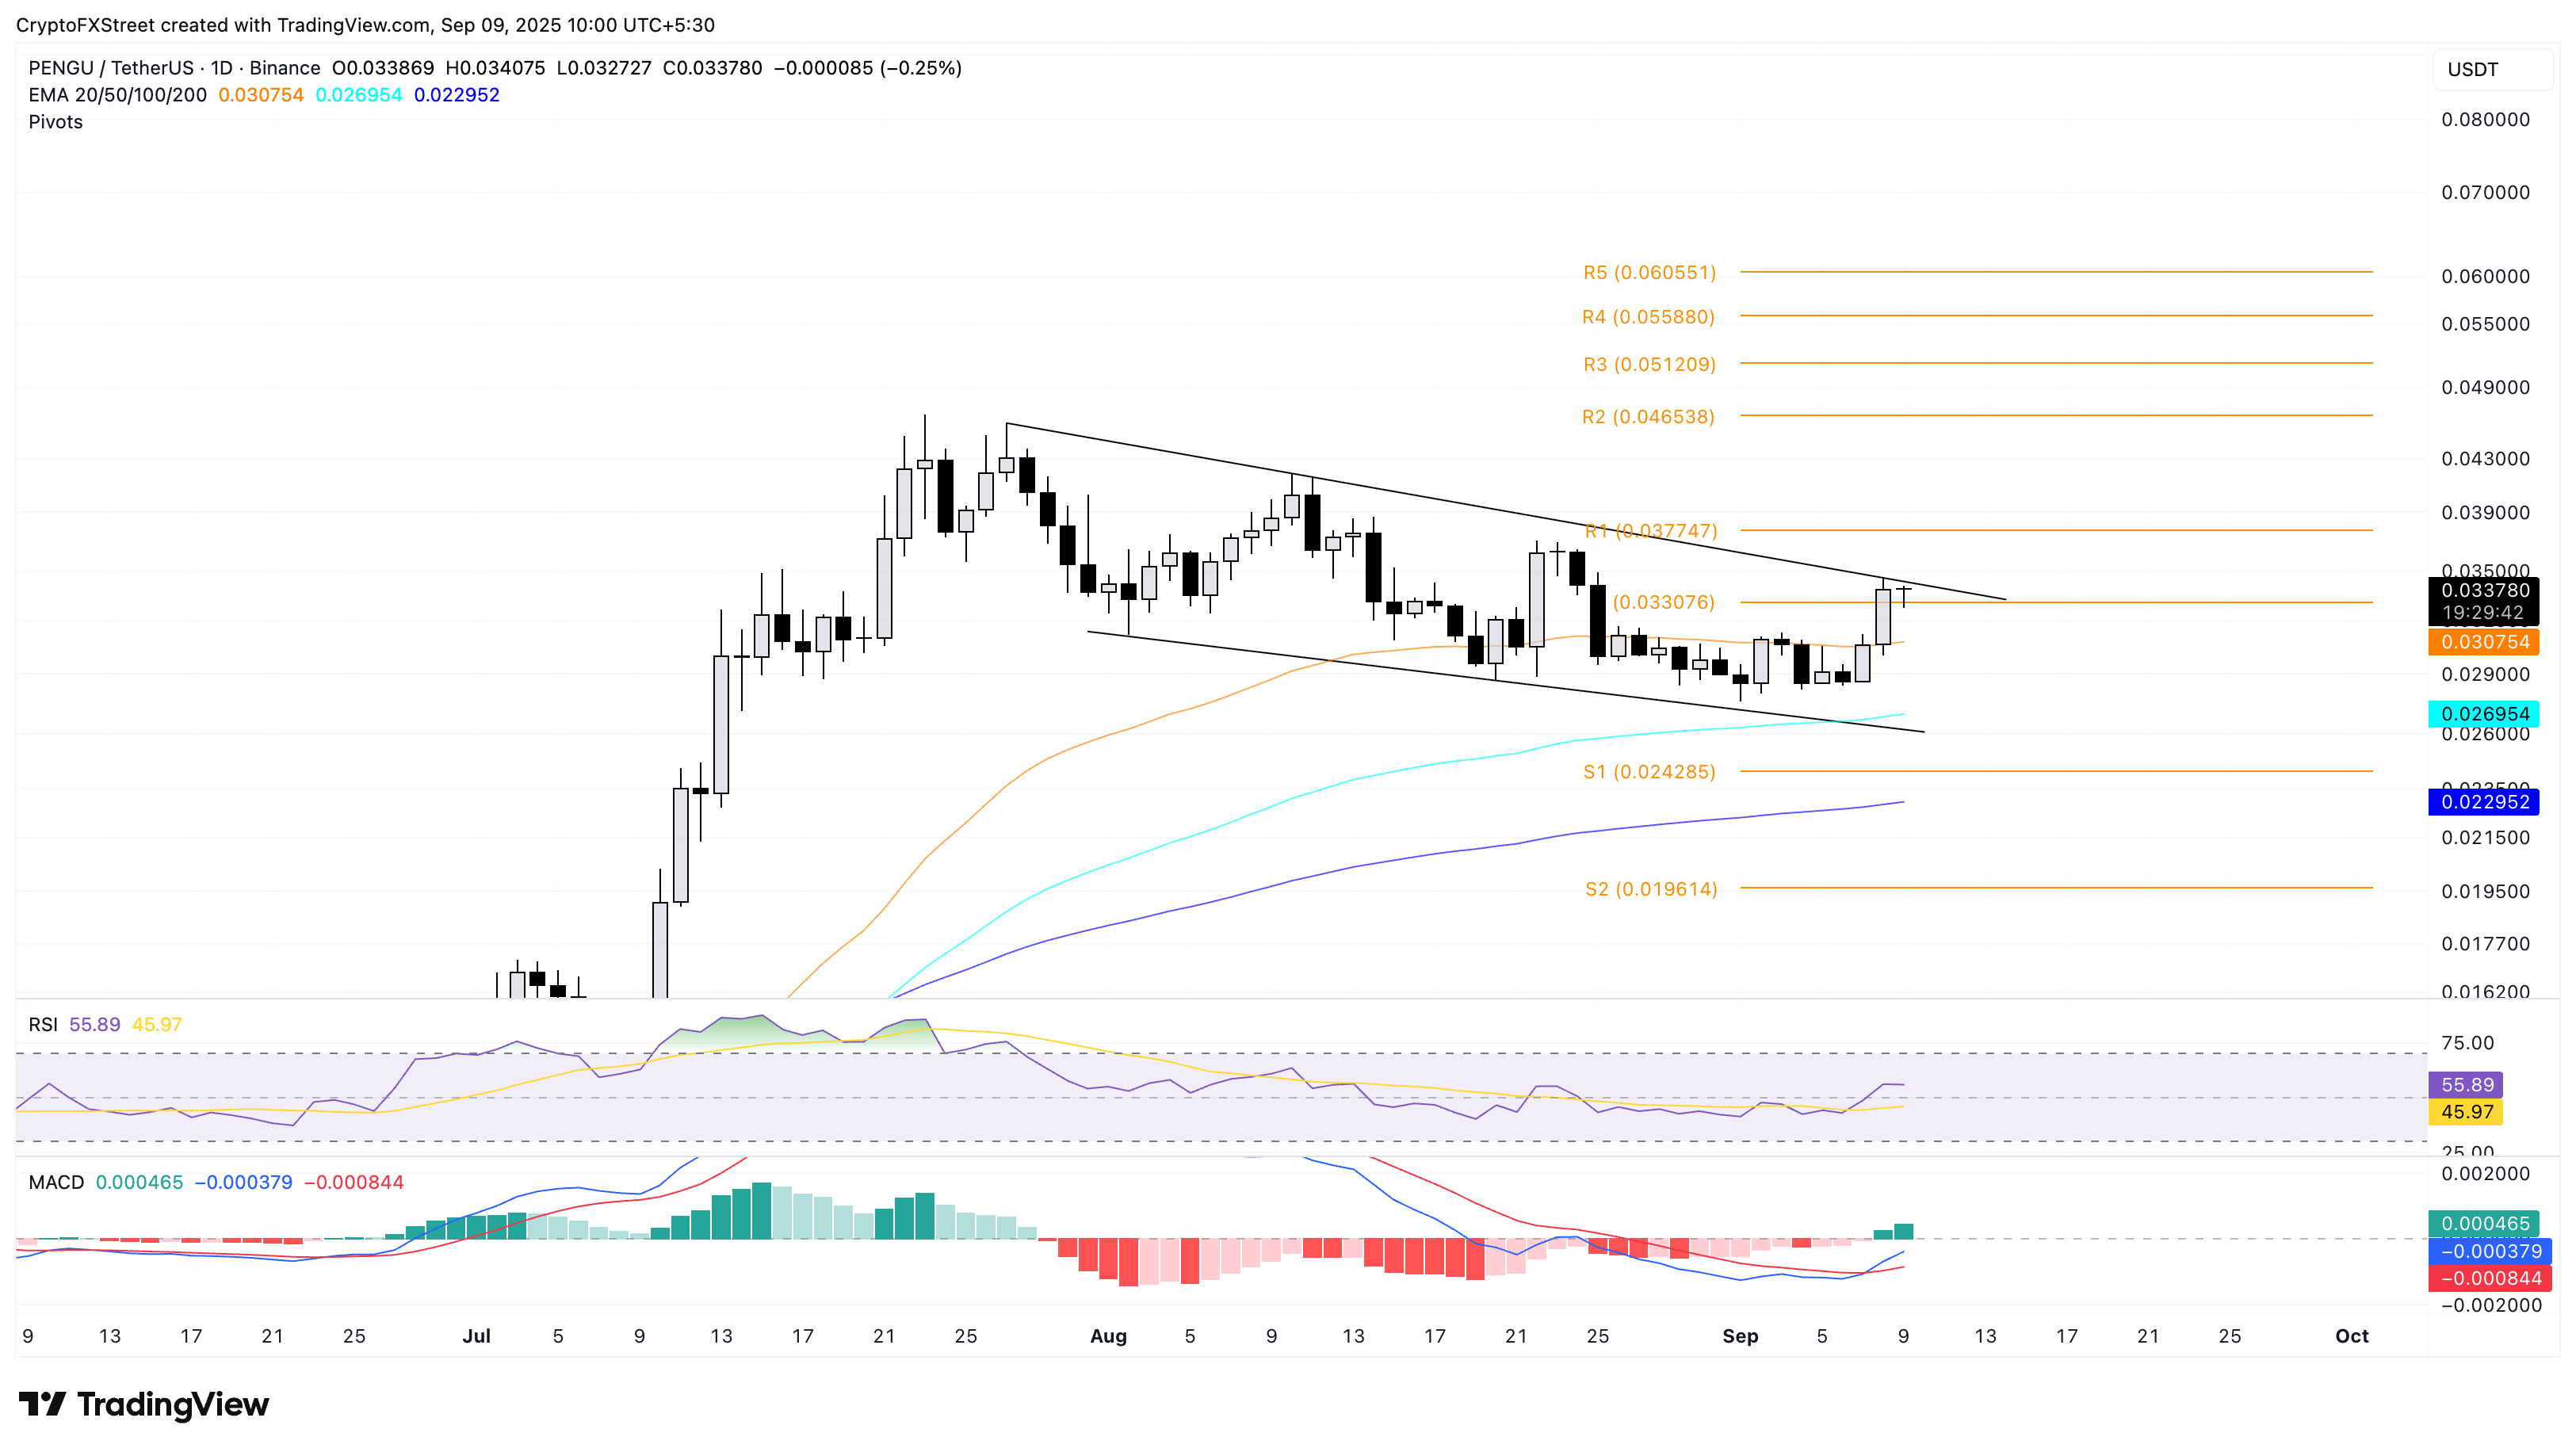
PENGU/USDT daily price chart.
However, a reversal from the resistance trendline could result in a retest of the 50-day Exponential Moving Average (EMA) at $0.03075.
FARTCOIN targets $0.88 as bullish momentum builds
FARTCOIN trades above the $0.80 level at press time on Tuesday, adding to the 8% gains from Monday. The meme coin confirmed the breakout of a falling wedge pattern on the daily chart with Monday’s recovery.
The breakout rally targets the centre pivot level at $0.88, which is acting as the immediate resistance. A positive close above this level could extend the rally to the 50-day EMA at $0.92.
Notably, the declining 50-day EMA has crossed below the 200-day EMA, signaling a Death Cross pattern, which indicates that the short-term downtrend has outpaced the prevailing longer-term trend.
Still, the momentum indicators uphold a bullish bias as the MACD and signal line on the daily chart rise towards the zero line following the crossover on Sunday.
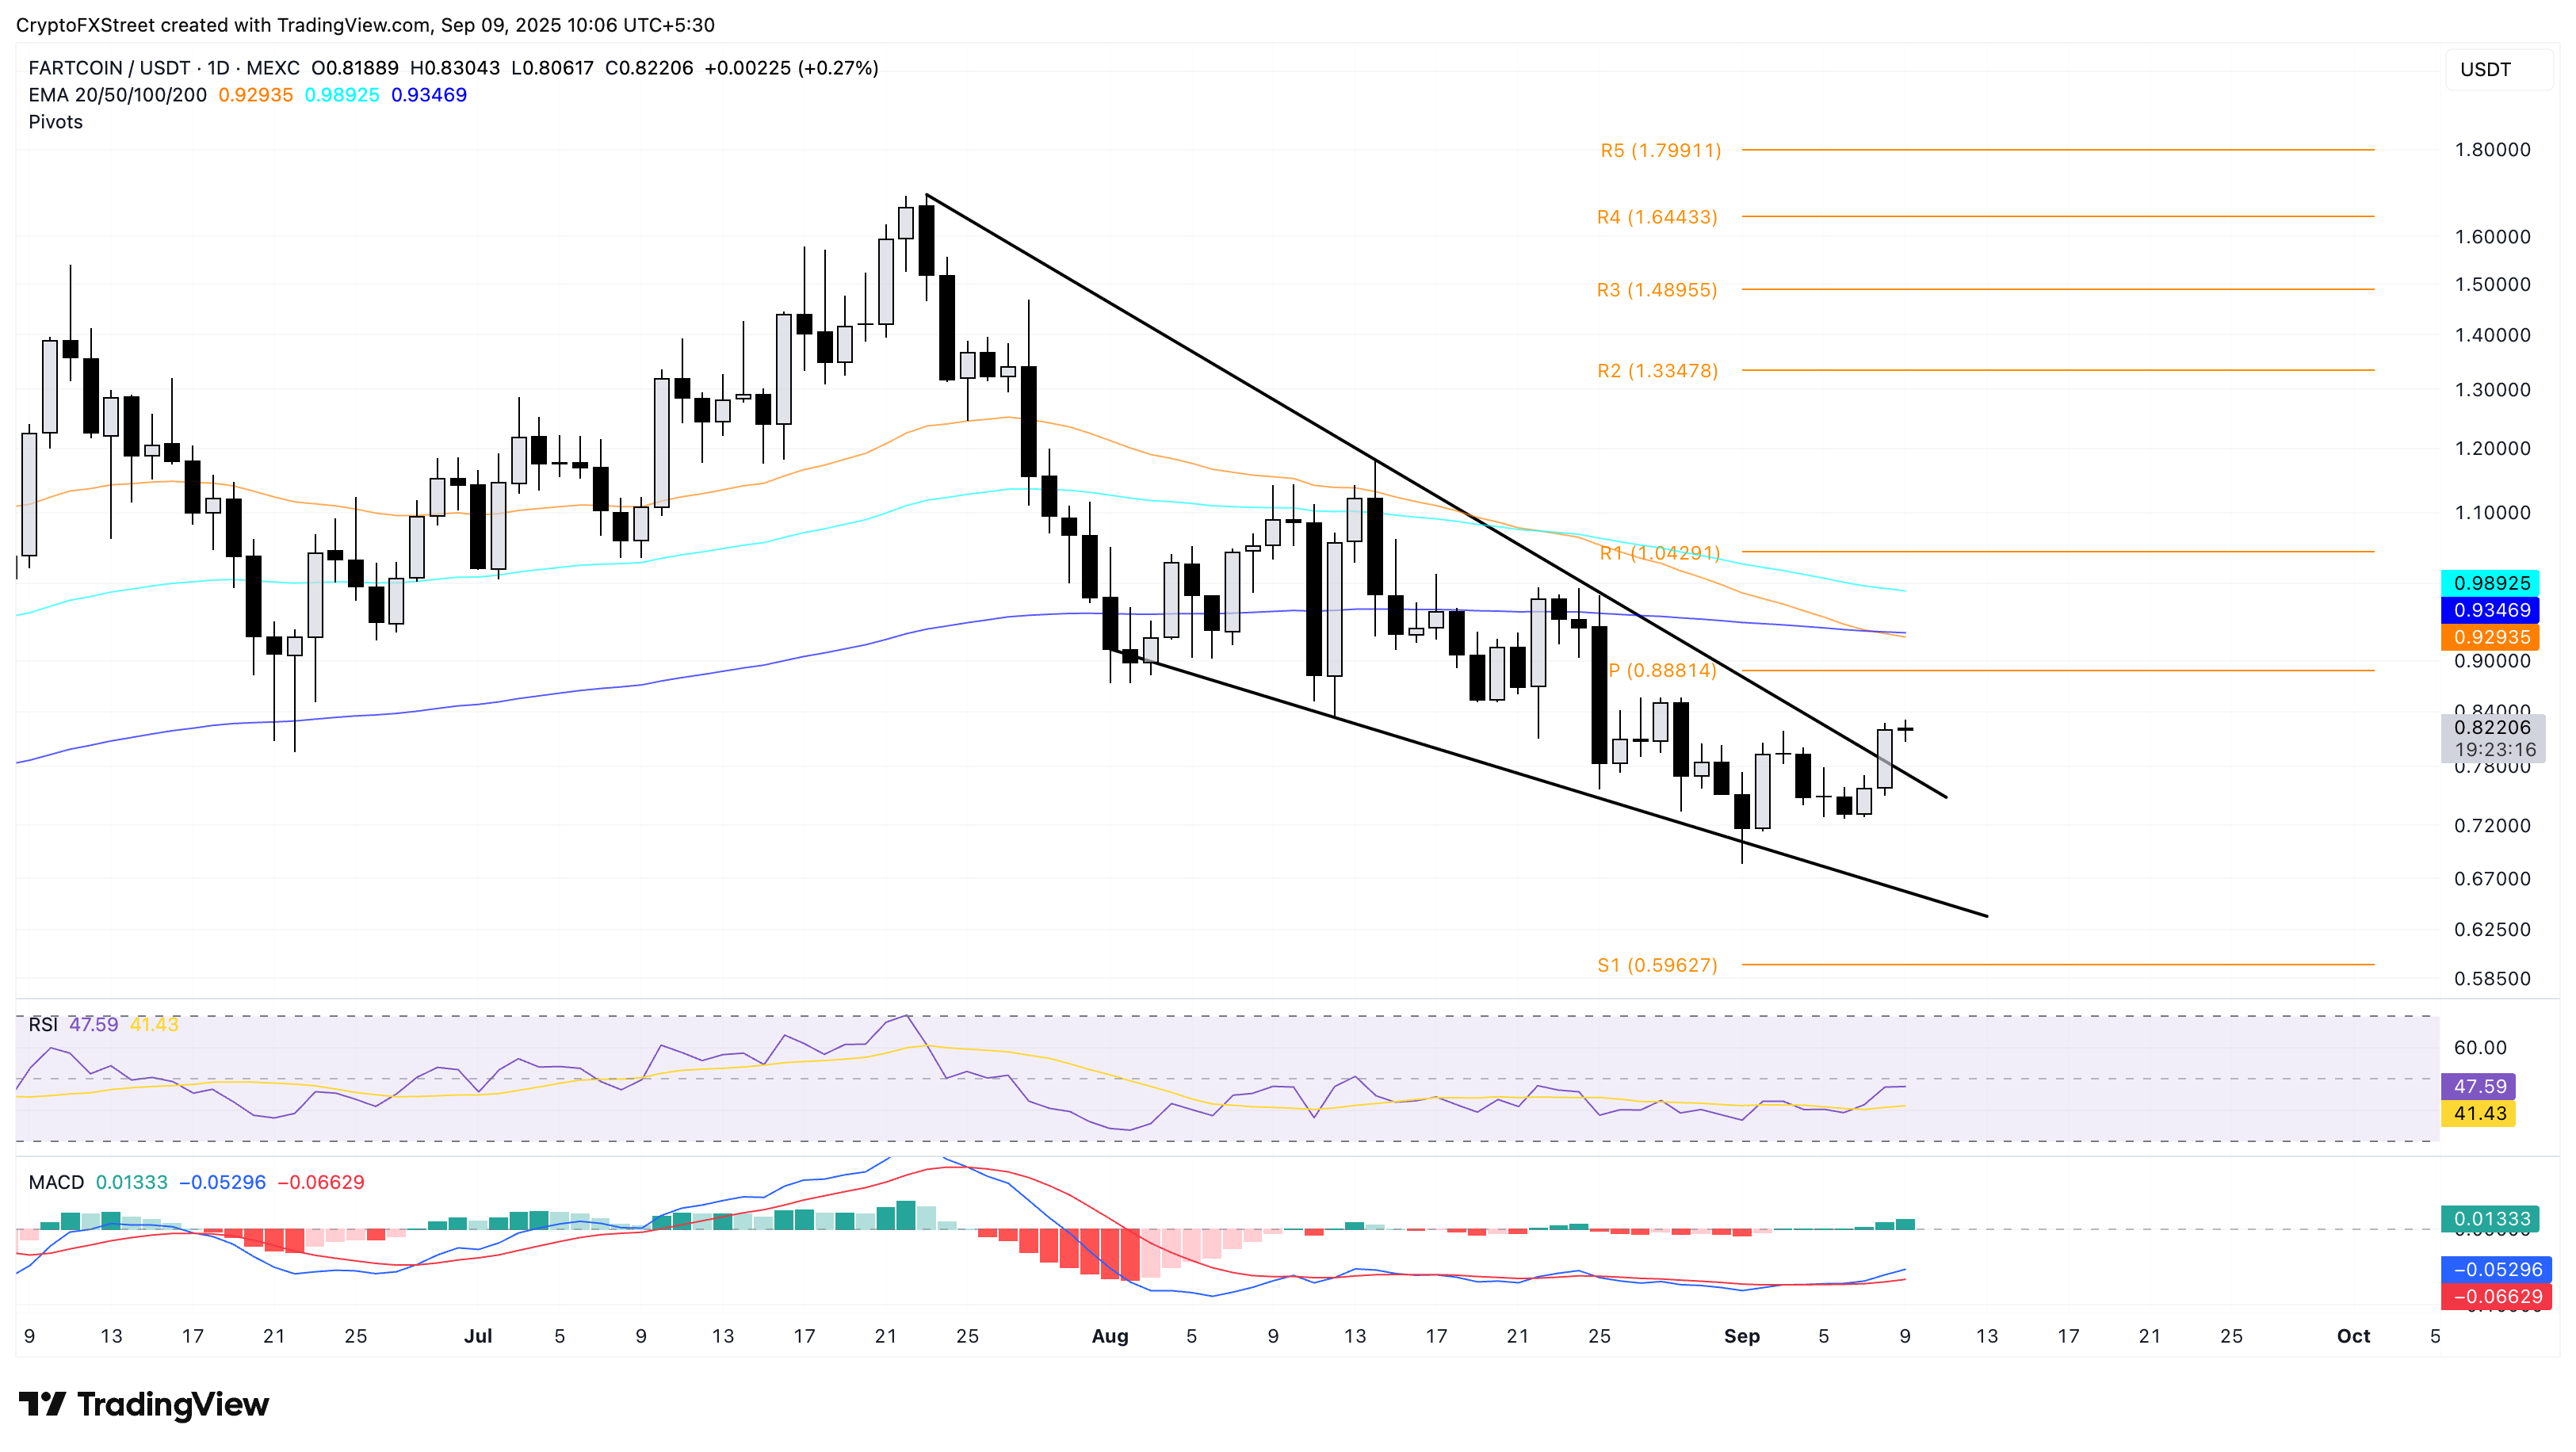
FARTCOIN/USDT daily price chart.
On the downside, a failure to sustain the uptrend could result in a retest of the broken resistance trendline at $0.77.
BONK aims to expand the wedge breakout rally
BONK edges lower by nearly 1% at the time of writing on Tuesday, following the 10% surge on the previous day. The 50% Fibonacci retracement level at $0.00002350 is drawn from the high of $0.00006230 on November 20, 2024, to the low of $0.00000886 on April 7, 2025, and acts as the overhead resistance.
A decisive close above this level could extend the uptrend to the 61.8% Fibonacci level at $0.00002958.
The RSI indicator on the same chart has surpassed the halfway line, currently at 53, suggesting a bullish shift in trend momentum. Adding to the bullish shift, the MACD extends an uptrend following a crossover above its signal line on Sunday.
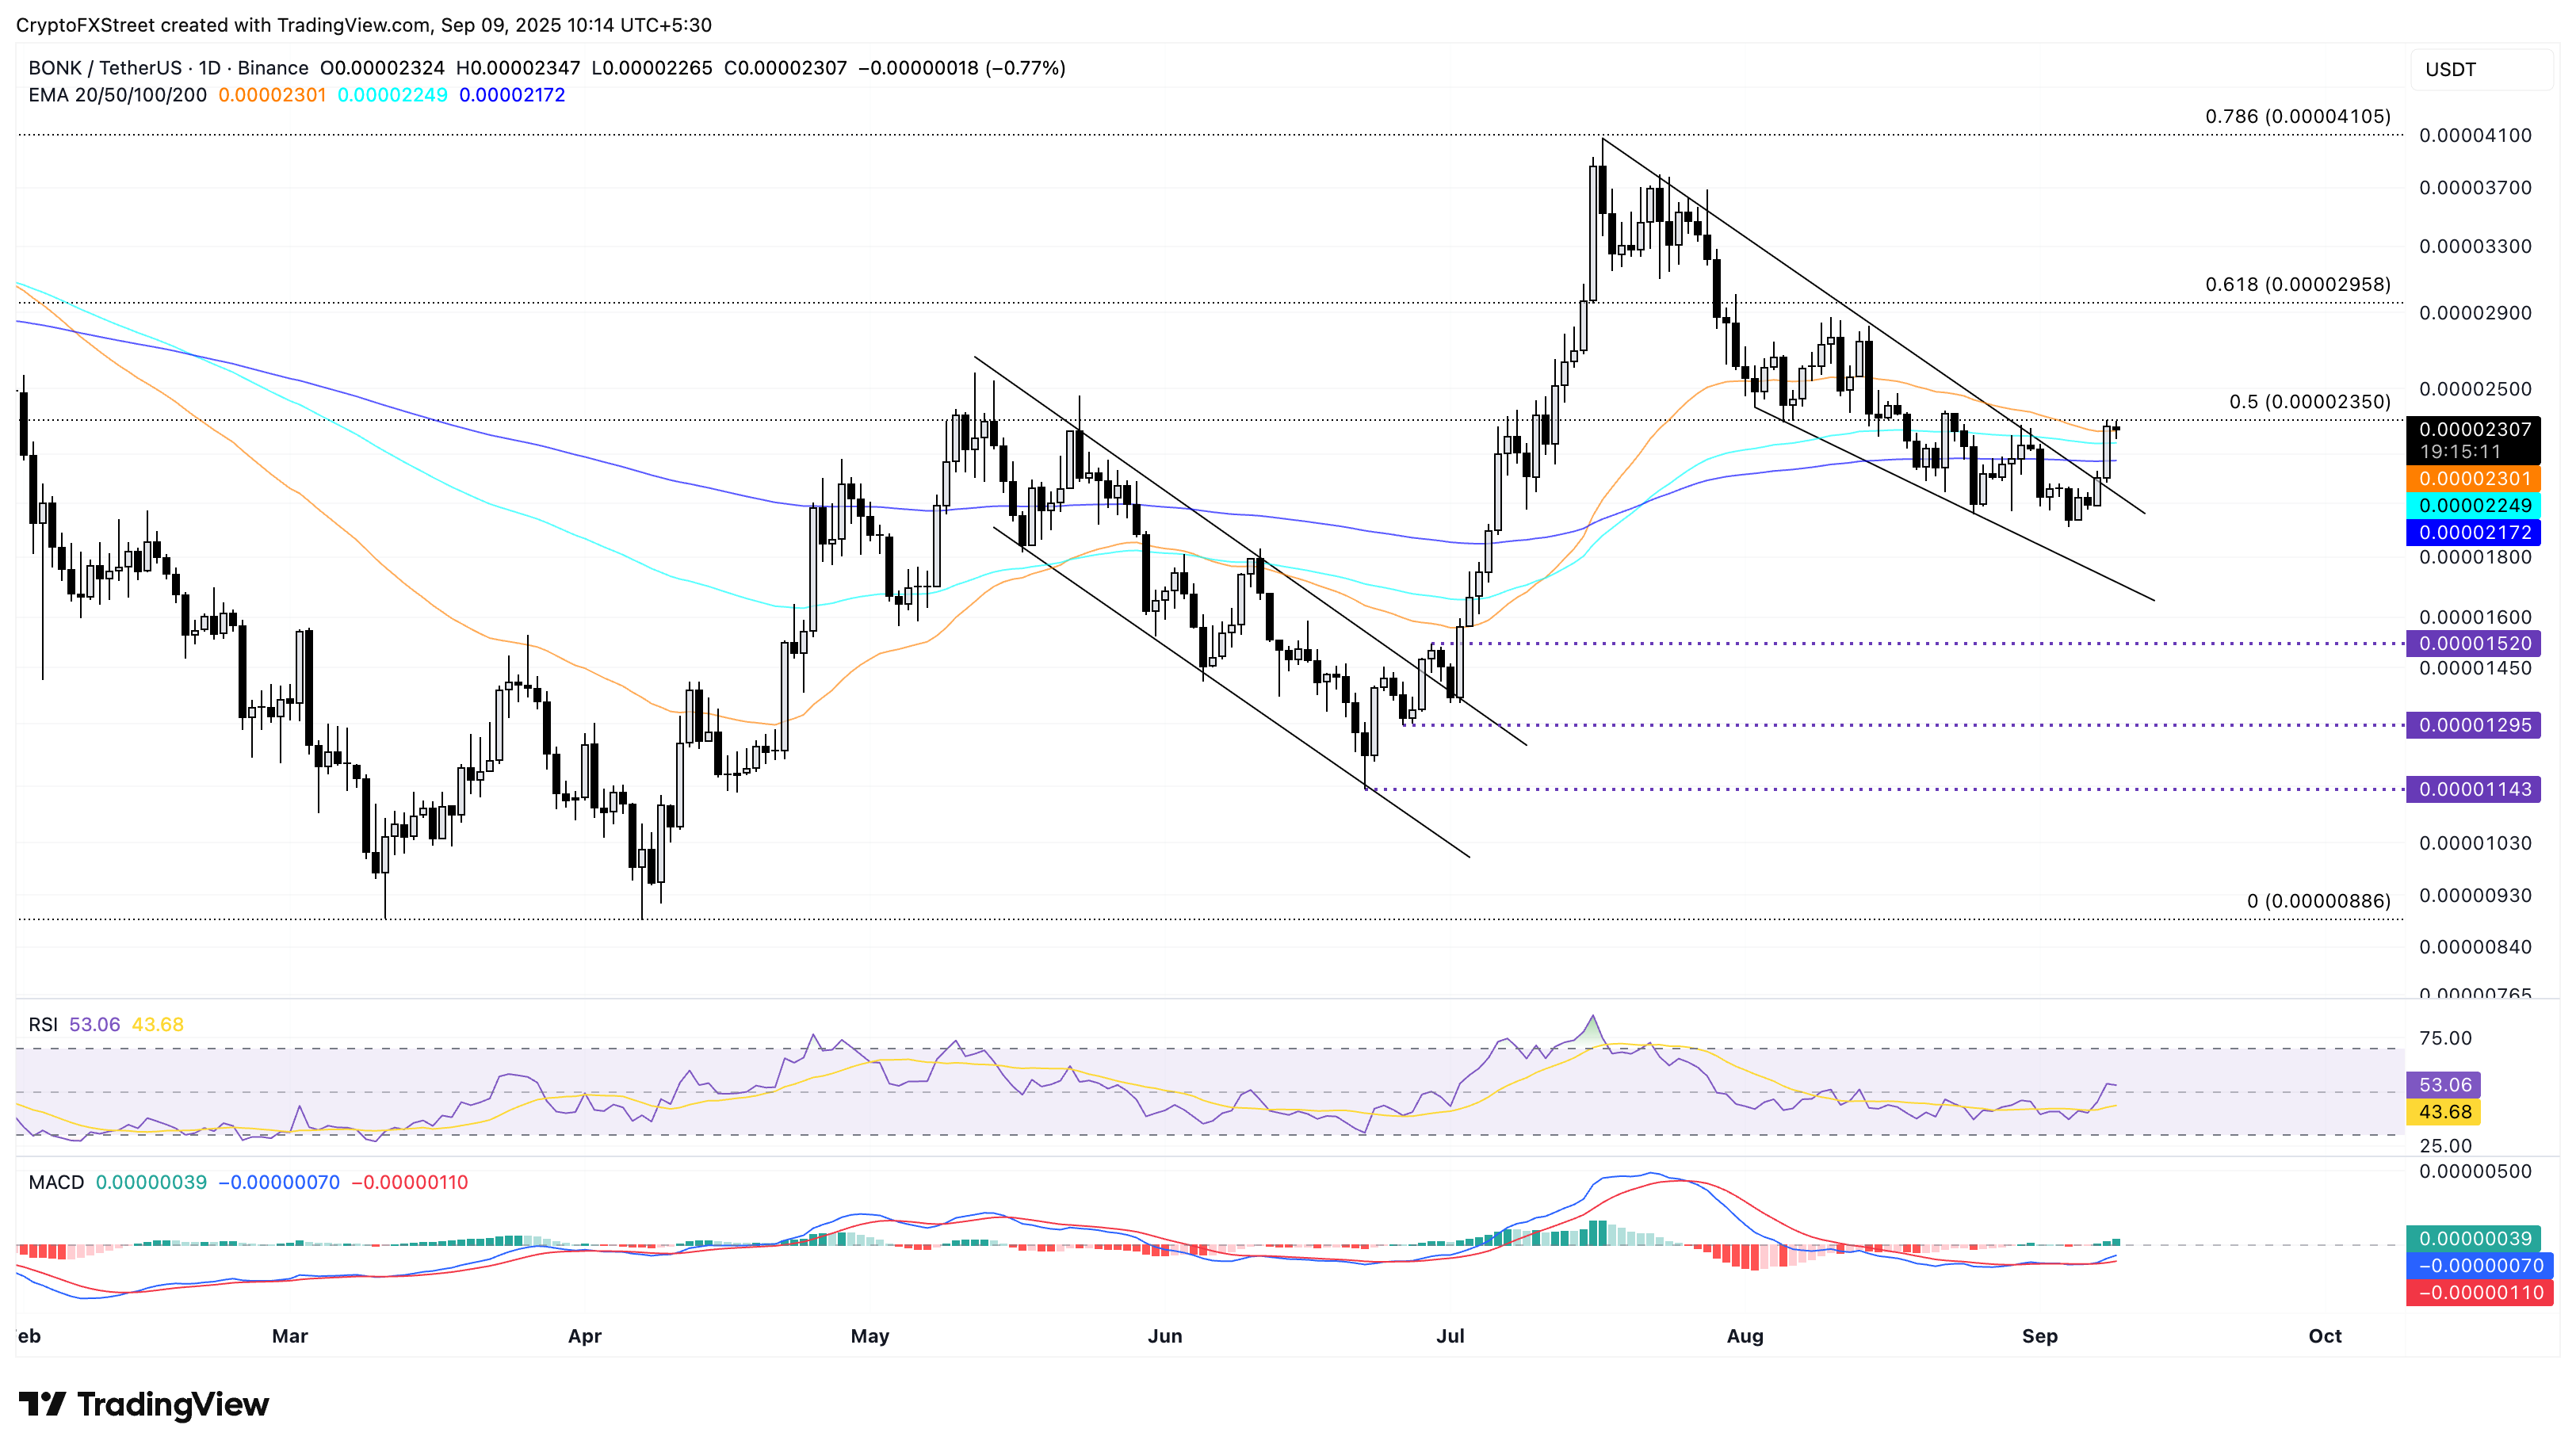
BONK/USDT daily price chart.
If BONK reverses from the $0.00002350 resistance, it could retest the 100-day EMA at $0.00002249.

FXStreet
100만 명이 넘는 사용자가 FXStreet를 통해 실시간 시장 데이터, 차트 도구, 전문가 인사이트, 포렉스 뉴스를 이용합니다. 포괄적인 경제 캘린더와 교육 웨비나는 트레이더가 정보를 유지하고 신중한 결정을 내리도록 돕습니다. FXStreet는 바르셀로나 본사와 전 세계 지역에 걸쳐 약 60명의 팀으로 구성되어 있습니다.
Read More


