
Trade The World
Solana Price Forecast: SOL eyes region above $200 as crypto market attempts recovery
작성자 John Isige
게시일: 16 Oct 2025 | 수정일: 16 Oct 2025


POPULAR ARTICLES

Solana (SOL) is trading above $195 at the time of writing on Thursday, indicating that sentiment in the broader cryptocurrency market may be shifting positively.
- Solana rebounds, aiming for $200, following a brief intraday flash drop on Thursday.
- SOL rises alongside Bitcoin and Ethereum as sentiment in the broader crypto market shows signs of improvement.
- Solana may struggle to uphold gains amid a consistent drop in on-chain activity.
Solana (SOL) is trading above $195 at the time of writing on Thursday, indicating that sentiment in the broader cryptocurrency market may be shifting positively.
Crypto majors, including Bitcoin (BTC), Ethereum (ETH) and Ripple (XRP), are edging higher, hinting at restored risk-on sentiment. The largest cryptocurrency by market capitalization, BTC, is back above the $111,000 level after a short-lived dip below $110,000. Ethereum (ETH) shows signs of extending its up leg above the short-term $4,100 resistance.
Can Solana uphold bullish outlook amid low on-chain activity?
Solana is attempting to break out above the $200 level following an intraday drawdown, which tested support at around $186. A higher immediate support at $195 is required to reinforce the bullish grip and increase the odds of the anticipated move.
However, DefiLlama draws investor attention to a significant decline in the number of addresses actively transacting on the Solana blockchain. The chart below shows that active addresses stand at 8.04 million for the week between October 13 and 19, marking a notable decrease from 33.63 million, recorded between May 19 and 25.
The Active Addresses metric tracks the number of wallets interacting with the protocol by sending or receiving SOL. Such a persistent decline points to low user engagement, which translates to reduced demand for Solana. The Solana price could remain suppressed as bulls struggle to sustain recovery amid low on-chain activity.
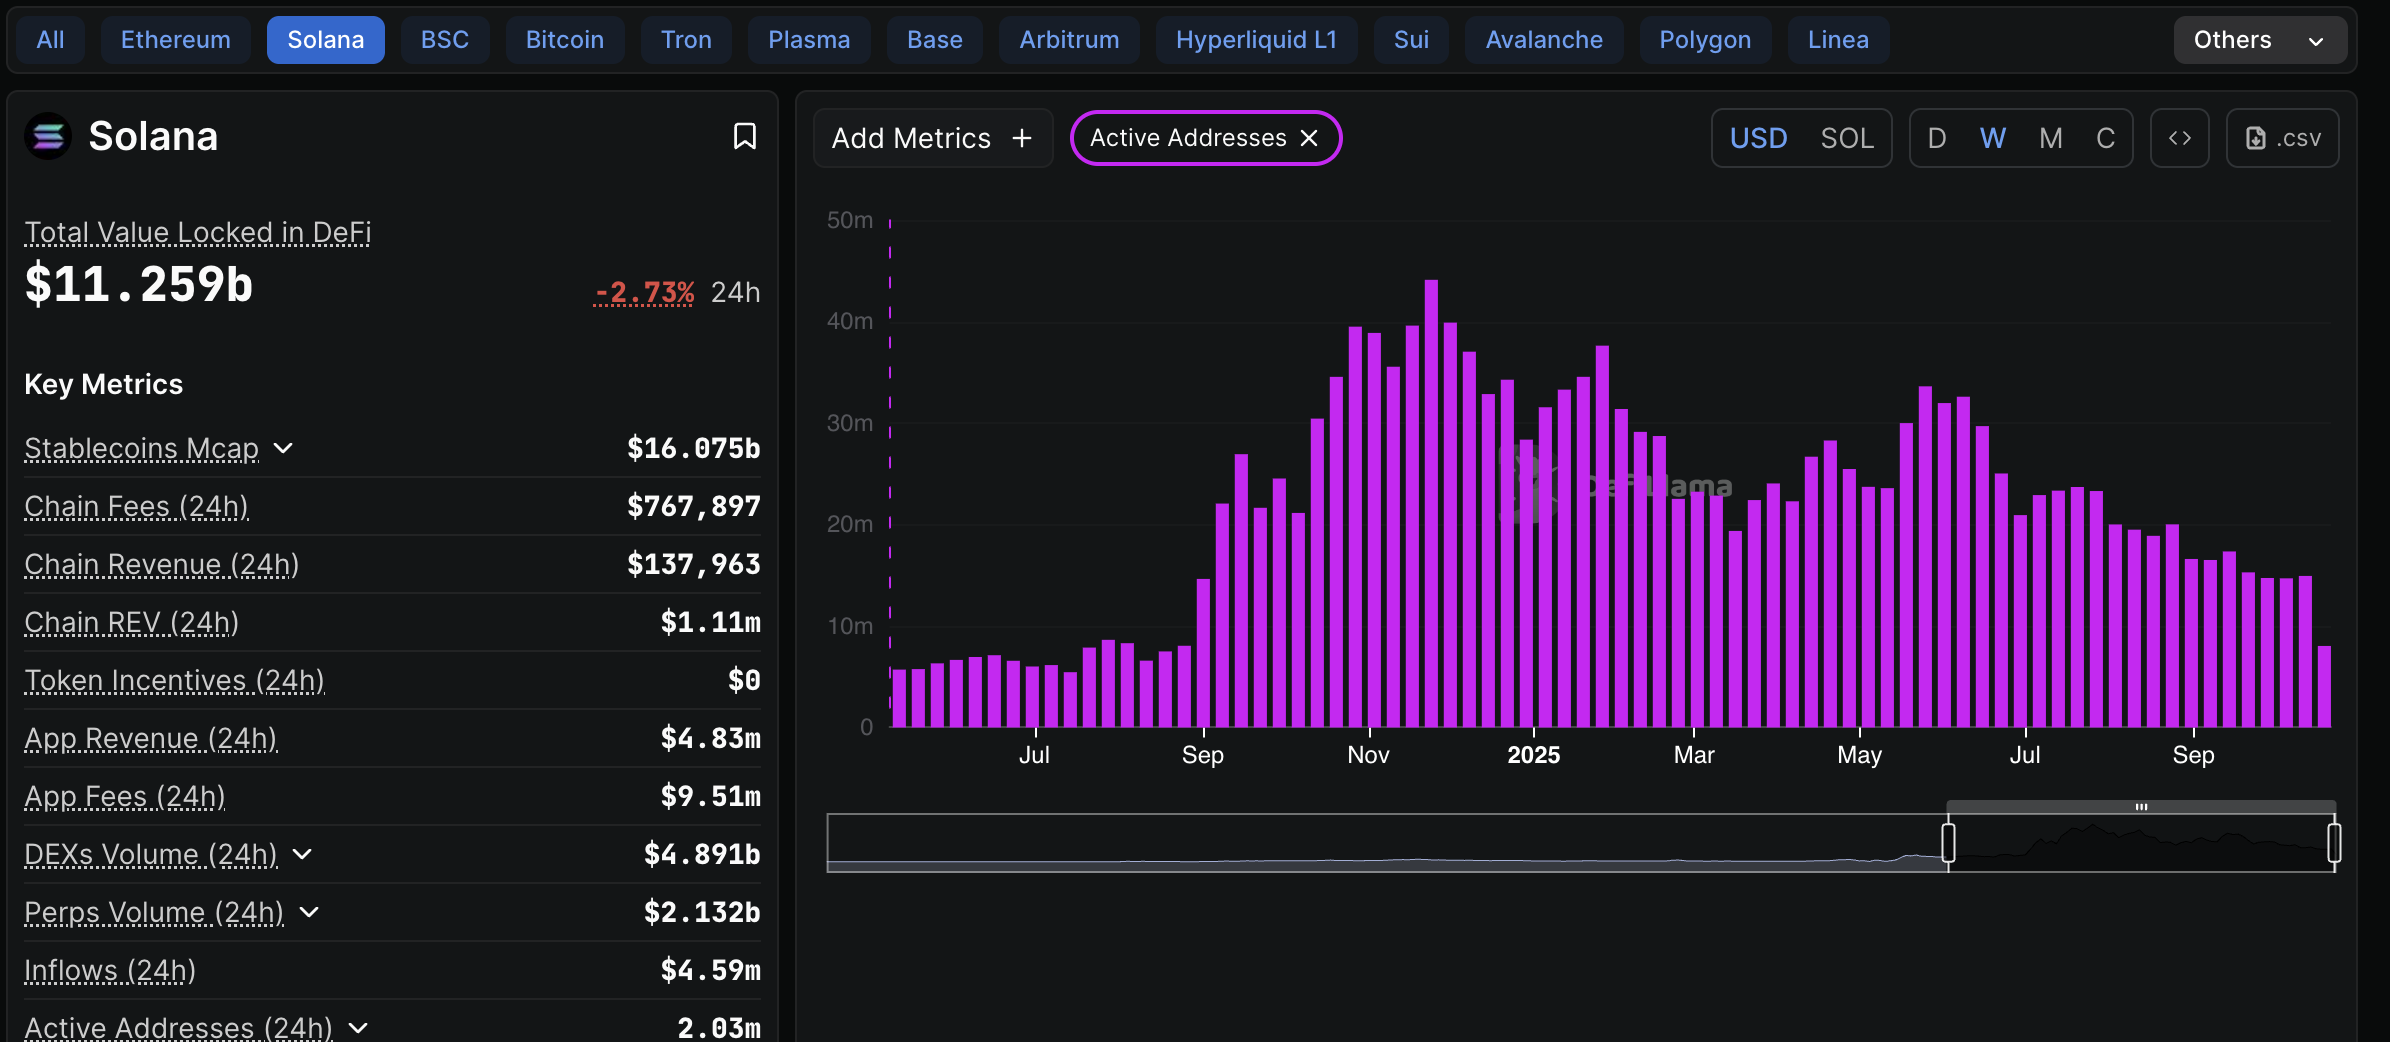
Solana Active Addresses metric | Source: DefiLlama
Technical outlook: Assessing Solana’s bullish outlook
Solana price holds between two key levels: The 200-day Exponential Moving Average (EMA), providing support at $186, and the 100-day EMA, which highlights resistance at $199.
An intraday rebound from the support at $186 hit a wall at $197, indicating that bullish momentum still lags. Key milestones include a daily close above the 100-day EMA and the pivotal level at $200. If retail interest steadies, traders will likely expand their bullish project above the 50-day EMA resistance at $209.
With the Relative Strength Index (RSI) in the bearish region but showing stability at 43, the path of least resistance could remain upward, increasing the odds of a bullish breakout.
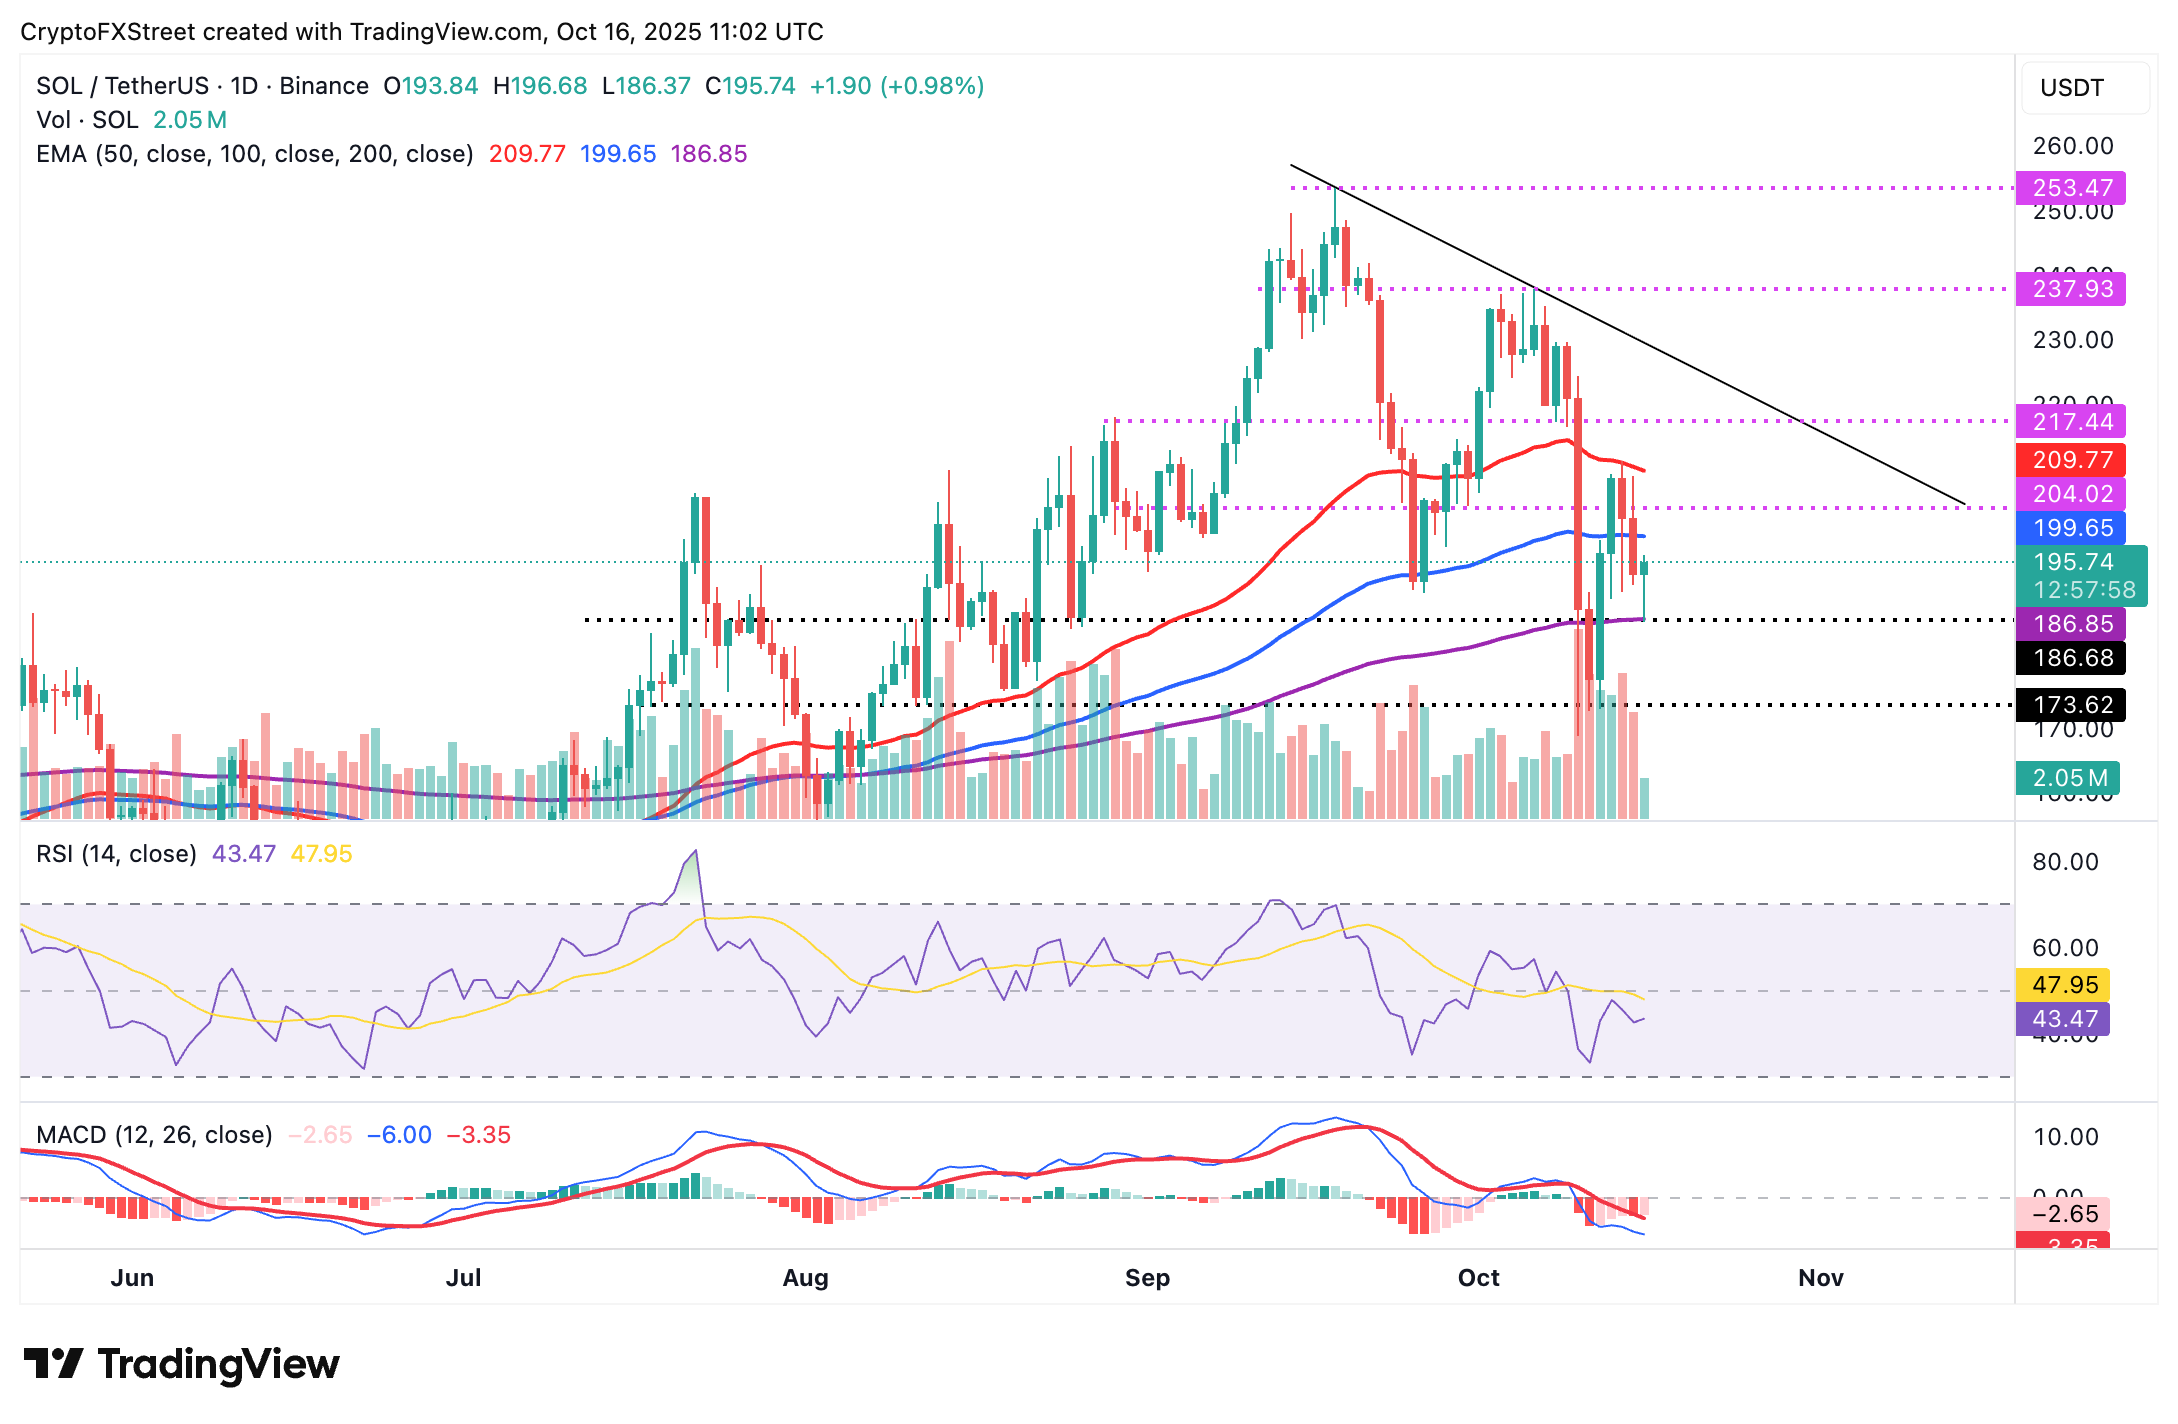
SOL/USDT daily chart
Conversely, the Moving Average Convergence Divergence (MACD) indicator has upheld a sell signal since Friday, which could keep investors on the bearish side. Hence, there is a need to track potential downward action likely to retest the 200-day EMA support at $186.
Cryptocurrency metrics FAQs
The developer or creator of each cryptocurrency decides on the total number of tokens that can be minted or issued. Only a certain number of these assets can be minted by mining, staking or other mechanisms. This is defined by the algorithm of the underlying blockchain technology. On the other hand, circulating supply can also be decreased via actions such as burning tokens, or mistakenly sending assets to addresses of other incompatible blockchains.
Market capitalization is the result of multiplying the circulating supply of a certain asset by the asset’s current market value.
Trading volume refers to the total number of tokens for a specific asset that has been transacted or exchanged between buyers and sellers within set trading hours, for example, 24 hours. It is used to gauge market sentiment, this metric combines all volumes on centralized exchanges and decentralized exchanges. Increasing trading volume often denotes the demand for a certain asset as more people are buying and selling the cryptocurrency.
Funding rates are a concept designed to encourage traders to take positions and ensure perpetual contract prices match spot markets. It defines a mechanism by exchanges to ensure that future prices and index prices periodic payments regularly converge. When the funding rate is positive, the price of the perpetual contract is higher than the mark price. This means traders who are bullish and have opened long positions pay traders who are in short positions. On the other hand, a negative funding rate means perpetual prices are below the mark price, and hence traders with short positions pay traders who have opened long positions.

FXStreet
100만 명이 넘는 사용자가 FXStreet를 통해 실시간 시장 데이터, 차트 도구, 전문가 인사이트, 포렉스 뉴스를 이용합니다. 포괄적인 경제 캘린더와 교육 웨비나는 트레이더가 정보를 유지하고 신중한 결정을 내리도록 돕습니다. FXStreet는 바르셀로나 본사와 전 세계 지역에 걸쳐 약 60명의 팀으로 구성되어 있습니다.
Read More


