
Trade The World
Solana Price Forecast: SOL risks 6% dip amid low user engagement, falling retail demand
작성자 John Isige
게시일: 21 Oct 2025 | 수정일: 21 Oct 2025


POPULAR ARTICLES

Solana (SOL) is edging lower, trading at around $185 at the time of writing on Tuesday.
- Solana struggles to hold the 200-day EMA support, as investors lose risk appetite.
- SOL faces shrinking retail demand, with funding rates turning negative as Open Interest declines to $8.64 billion.
- Active Solana addresses drop by over half to 15 million per week from 33.63 million.
Solana (SOL) is edging lower, trading at around $185 at the time of writing on Tuesday. The decline from the previous day’s high of $194 underpins the risk-off sentiment in the broader cryptocurrency market, with investors staying on the sidelines due to macroeconomic uncertainty and a lack of price catalysts.
Solana’s recovery subdued on low on-chain activity
The Solana protocol is experiencing a significant decline in the number of addresses actively transacting on the network. DefiLlama data shows that the addresses averaged 15 million through the week ending October 19, a 19% decline from 33.63 million posted between May 19 and May 25.
So far, 4.74 million addresses have interacted with the Solana network this week by sending and receiving digital assets.
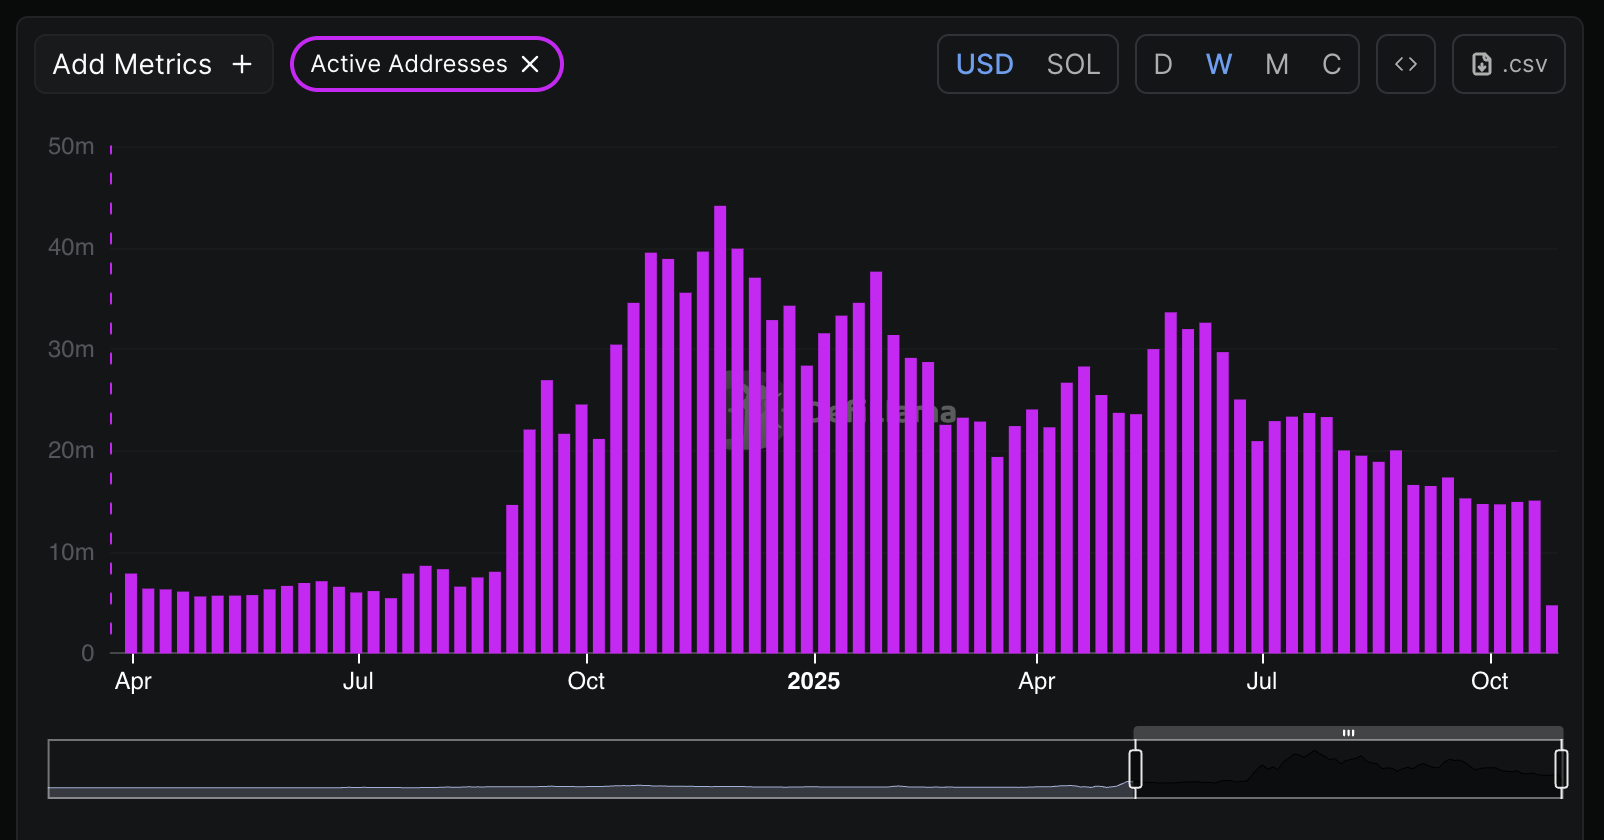
Solana Active Addresses metric | Source: DefiLlama
If the general downtrend in the Active Addresses metric persists, Solana may continue to bearish pressure due to reduced demand for SOL. Fewer active addresses mean lower transaction volumes and an overall drop in network revenue.
Solana’s strength originates from its influence in the Decentralized Finance (DeFi) and meme coin sectors. Hence, diminishing on-chain activity may erode developer confidence, which could affect liquidity inflows and the launch and adoption of decentralized applications (dApps).
The slow uptake of Solana on-chain and in the DeFi and meme coin sectors is also reflected in its derivatives market, with the futures Open Interest (OI) plummeting to $8.64 billion from an October peak of $15 billion.
OI refers to the notional value of outstanding futures contracts, whereby a steady decline indicates fading interest as investors lose appetite. A sticky downtrend could dampen recovery, as traders stay on the sidelines, reducing risk exposure.
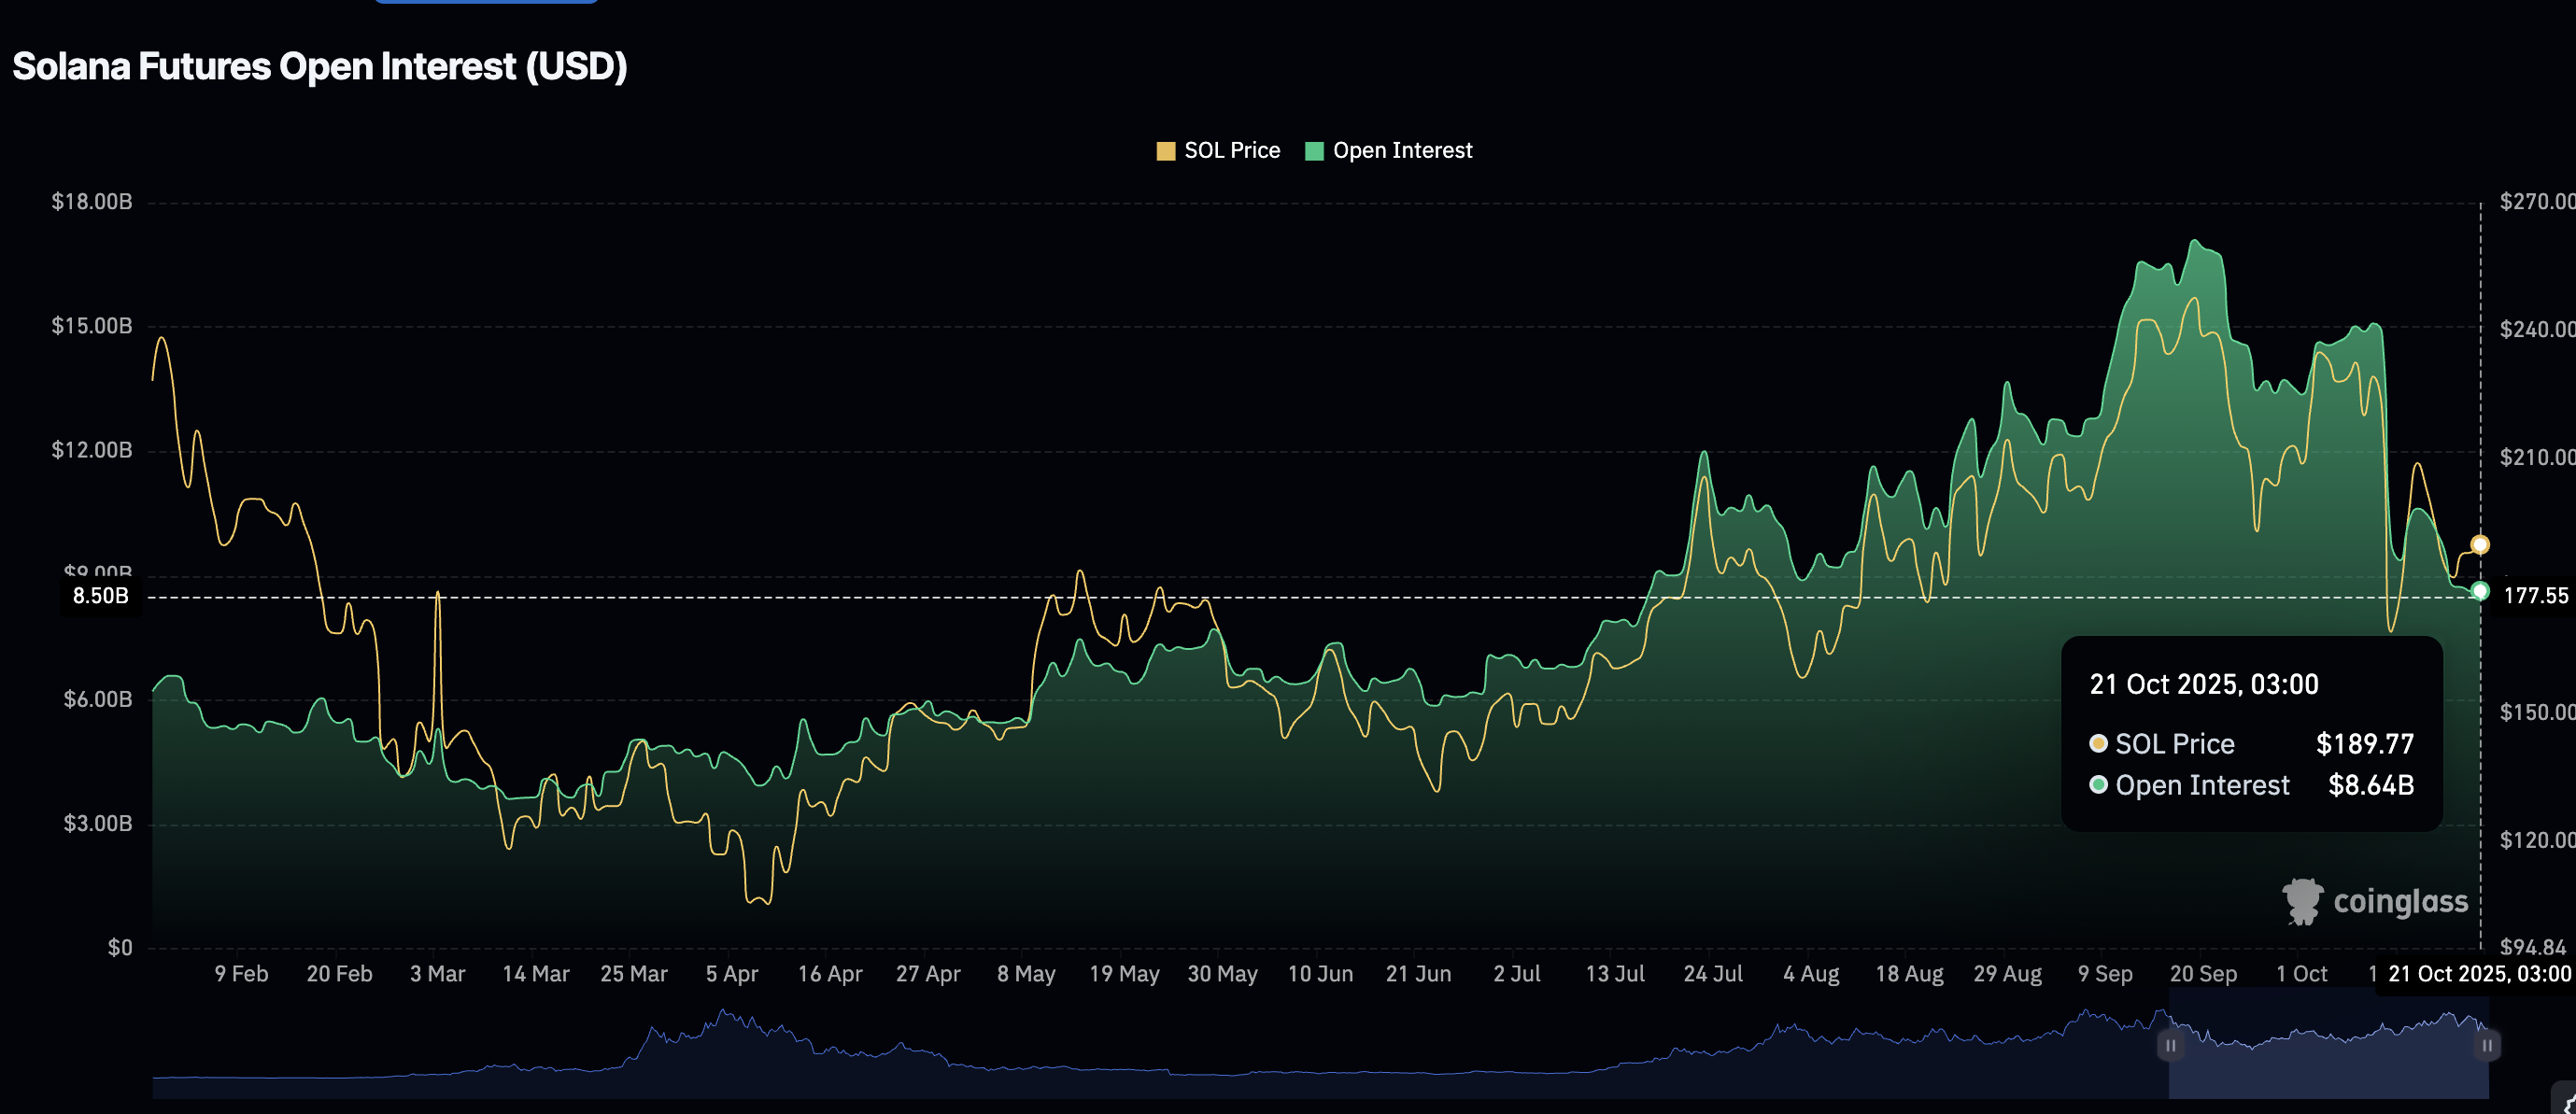
Solana Futures Open Interest | Source: CoinGlass
A sharp drawdown in the OI weighted funding rate to -0.0001% suggests that traders are increasingly piling into short positions, citing negative sentiment surrounding SOL. Still, the situation is not at the extreme, considering the weighted funding rate plunged to -0.3753% in October, as traders encountered the largest deleveraging event in the history of the crypto market.
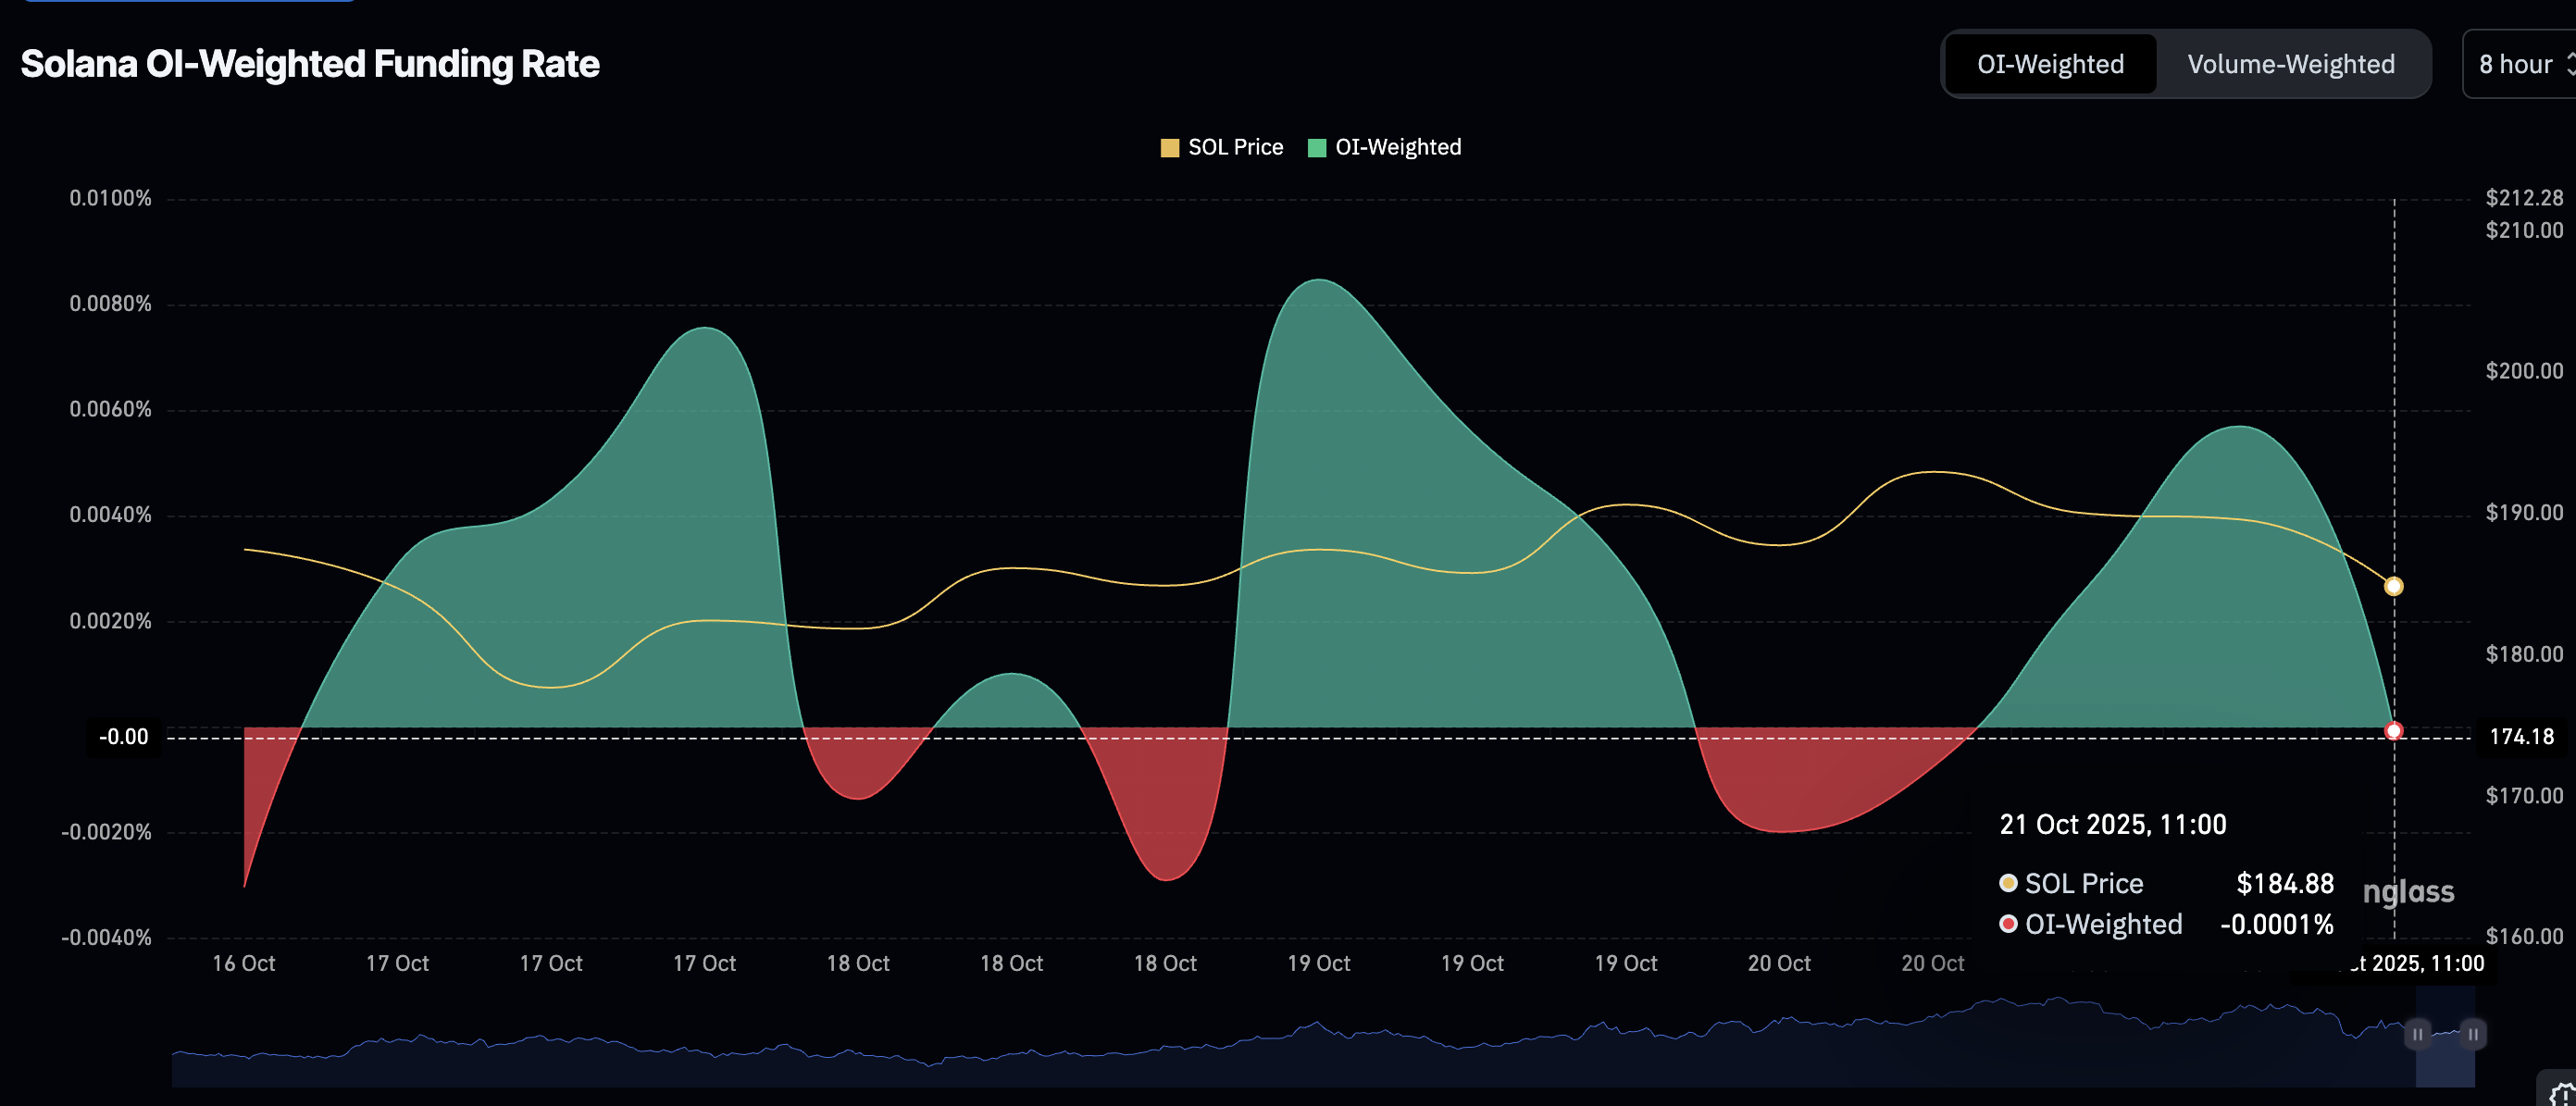
Solana OI Weighted Funding Rate | Source: CoinGlass
Technical outlook: Solana edges lower as bears tighten grip
Solana is trading below the 200-day Exponential Moving Average (EMA), currently at $186 at the time of writing on Tuesday. The path of least resistance remains downward, according to SOL’s technical picture on the daily chart.
A sell signal from the Moving Average Convergence (MACD) indicator in the same daily range encourages investors to continue reducing their risk exposure.
A daily close below the 200-day EMA would reinforce the bearish outlook, increasing the odds of Solana dropping 6% to test the next key support at $174.
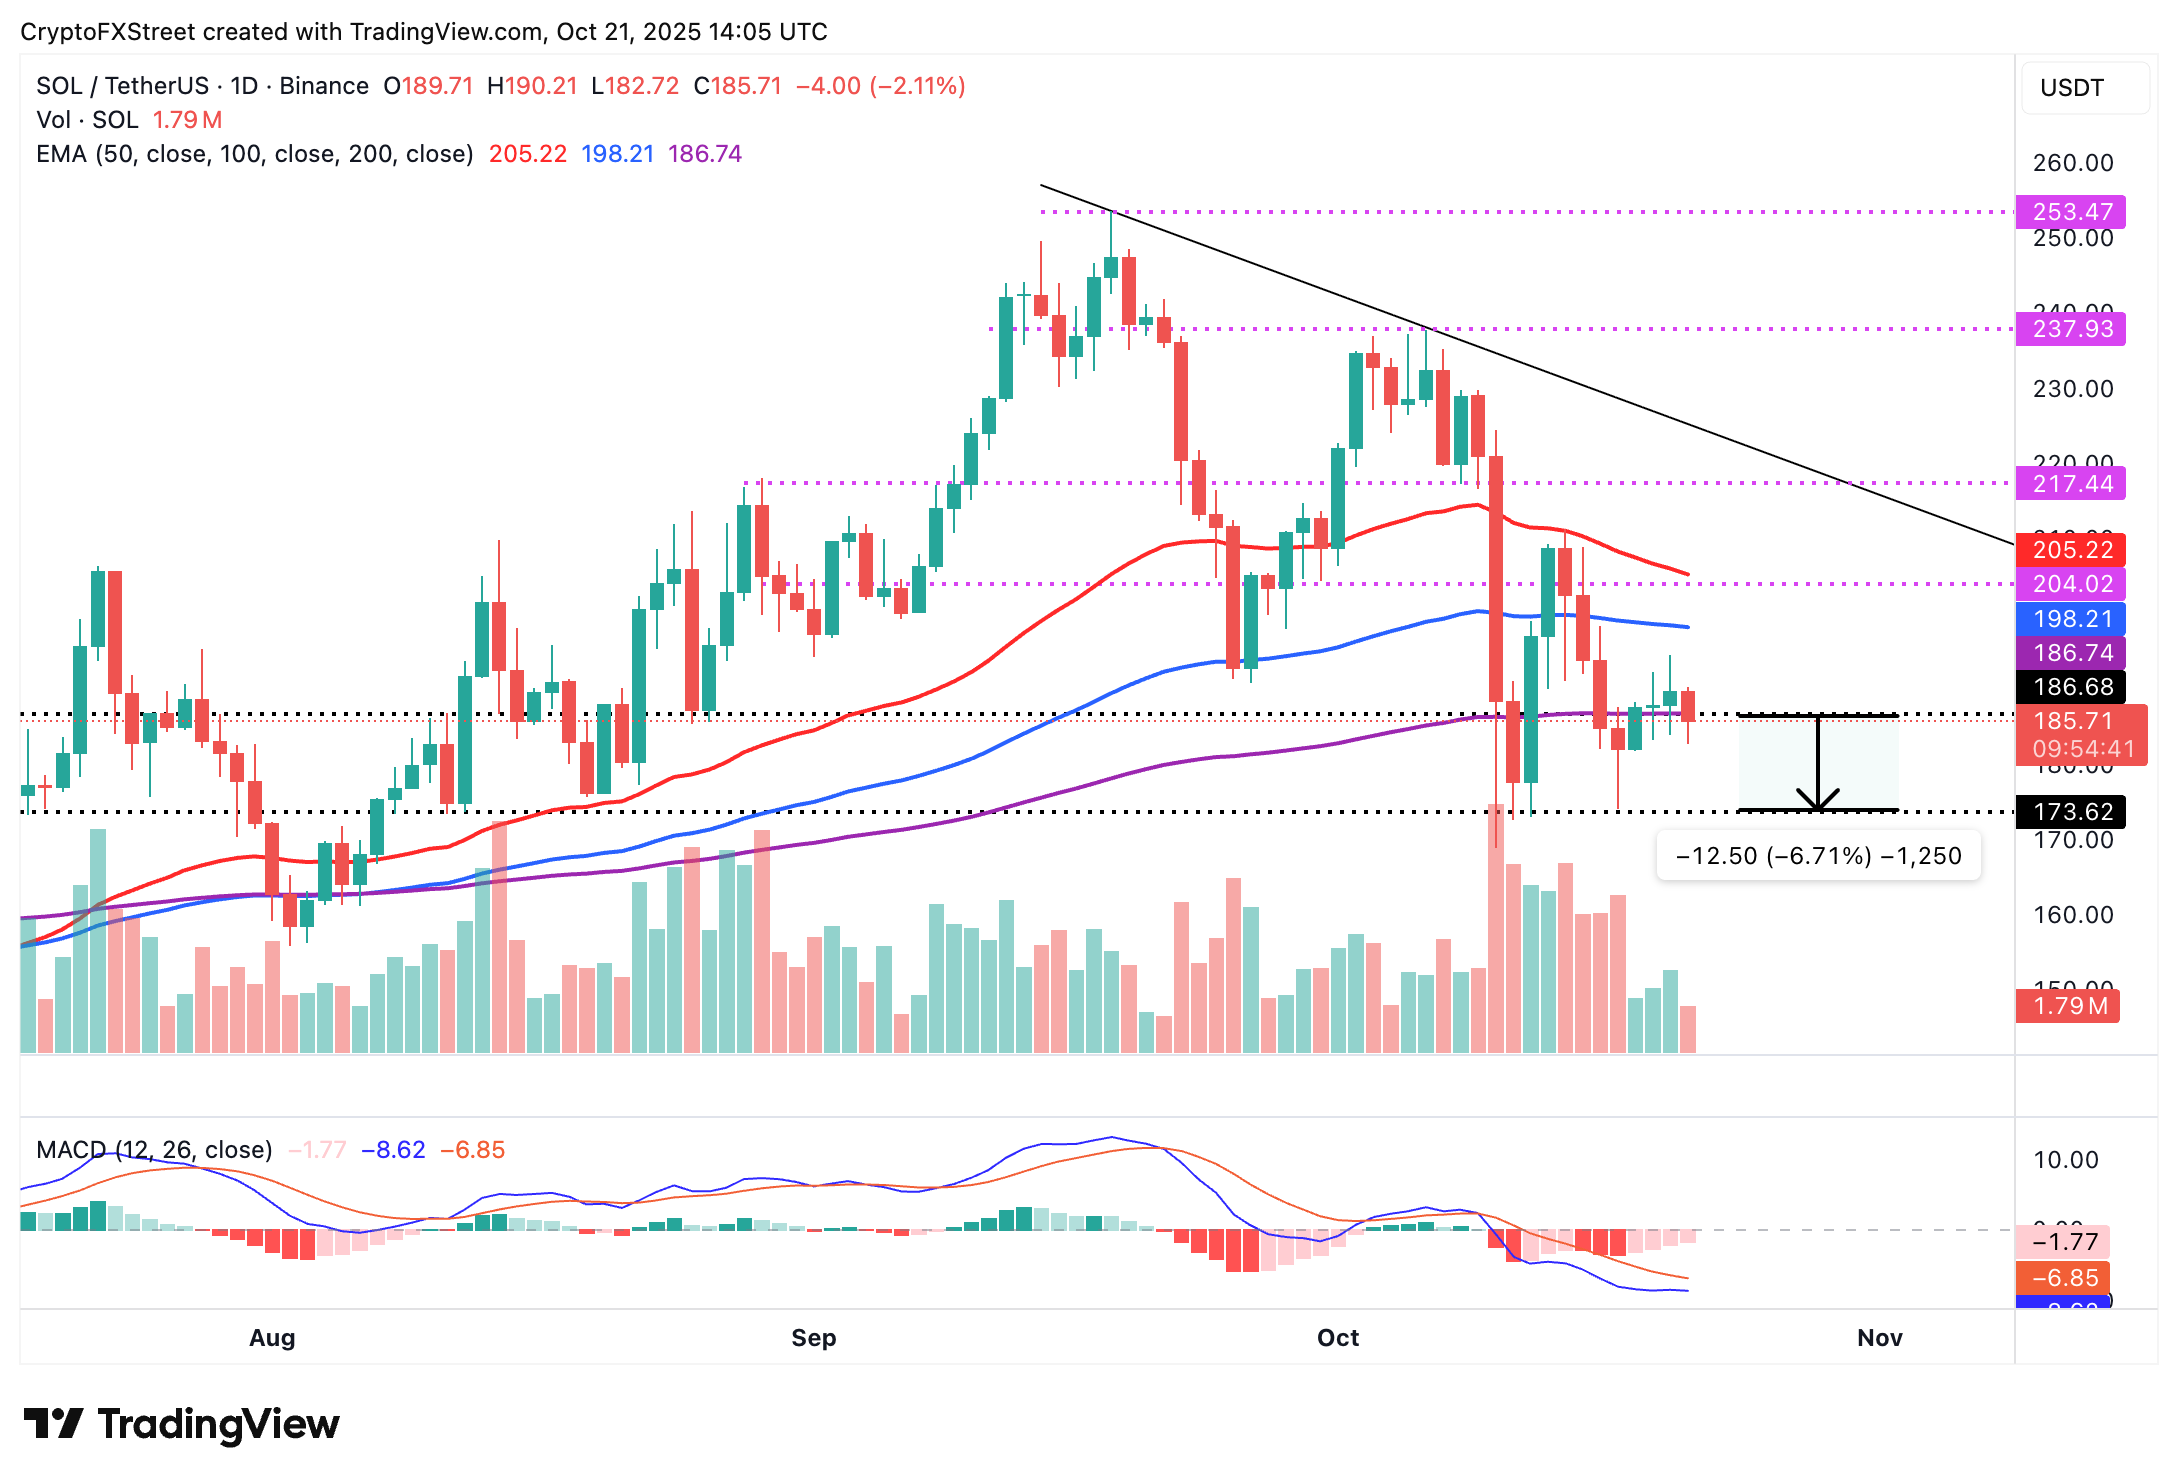
SOL/USDT daily chart
Conversely, an immediate rebound above the 200-day EMA cannot be ruled out, especially if sentiment improves across the crypto market. In this case, traders would anticipate a buy signal from the MACD indicator, which will manifest with the blue line crossing above the red signal line. Key milestones include a break above the supply area at $190 and a subsequent move toward the $200 level.
Cryptocurrency metrics FAQs
The developer or creator of each cryptocurrency decides on the total number of tokens that can be minted or issued. Only a certain number of these assets can be minted by mining, staking or other mechanisms. This is defined by the algorithm of the underlying blockchain technology. On the other hand, circulating supply can also be decreased via actions such as burning tokens, or mistakenly sending assets to addresses of other incompatible blockchains.
Market capitalization is the result of multiplying the circulating supply of a certain asset by the asset’s current market value.
Trading volume refers to the total number of tokens for a specific asset that has been transacted or exchanged between buyers and sellers within set trading hours, for example, 24 hours. It is used to gauge market sentiment, this metric combines all volumes on centralized exchanges and decentralized exchanges. Increasing trading volume often denotes the demand for a certain asset as more people are buying and selling the cryptocurrency.
Funding rates are a concept designed to encourage traders to take positions and ensure perpetual contract prices match spot markets. It defines a mechanism by exchanges to ensure that future prices and index prices periodic payments regularly converge. When the funding rate is positive, the price of the perpetual contract is higher than the mark price. This means traders who are bullish and have opened long positions pay traders who are in short positions. On the other hand, a negative funding rate means perpetual prices are below the mark price, and hence traders with short positions pay traders who have opened long positions.

FXStreet
100만 명이 넘는 사용자가 FXStreet를 통해 실시간 시장 데이터, 차트 도구, 전문가 인사이트, 포렉스 뉴스를 이용합니다. 포괄적인 경제 캘린더와 교육 웨비나는 트레이더가 정보를 유지하고 신중한 결정을 내리도록 돕습니다. FXStreet는 바르셀로나 본사와 전 세계 지역에 걸쳐 약 60명의 팀으로 구성되어 있습니다.
Read More


