
Trade The World
Solana Price Forecast: SOL trades under pressure and bearish signals
작성자 John Isige
게시일: 24 Nov 2025 | 수정일: 24 Nov 2025


POPULAR ARTICLES

Solana (SOL) remains marginally below $130 at the time of writing on Monday, reflecting risk-off sentiment in the broader cryptocurrency market. SOL hit an intraday high of $134 but retraced, signaling growing uncertainty and high volatility.
- Solana holds below $130 as supply continues to overwhelm demand on Monday.
- The 100-day EMA confirms a Death Cross pattern after crossing below the 200-day EMA on the daily chart.
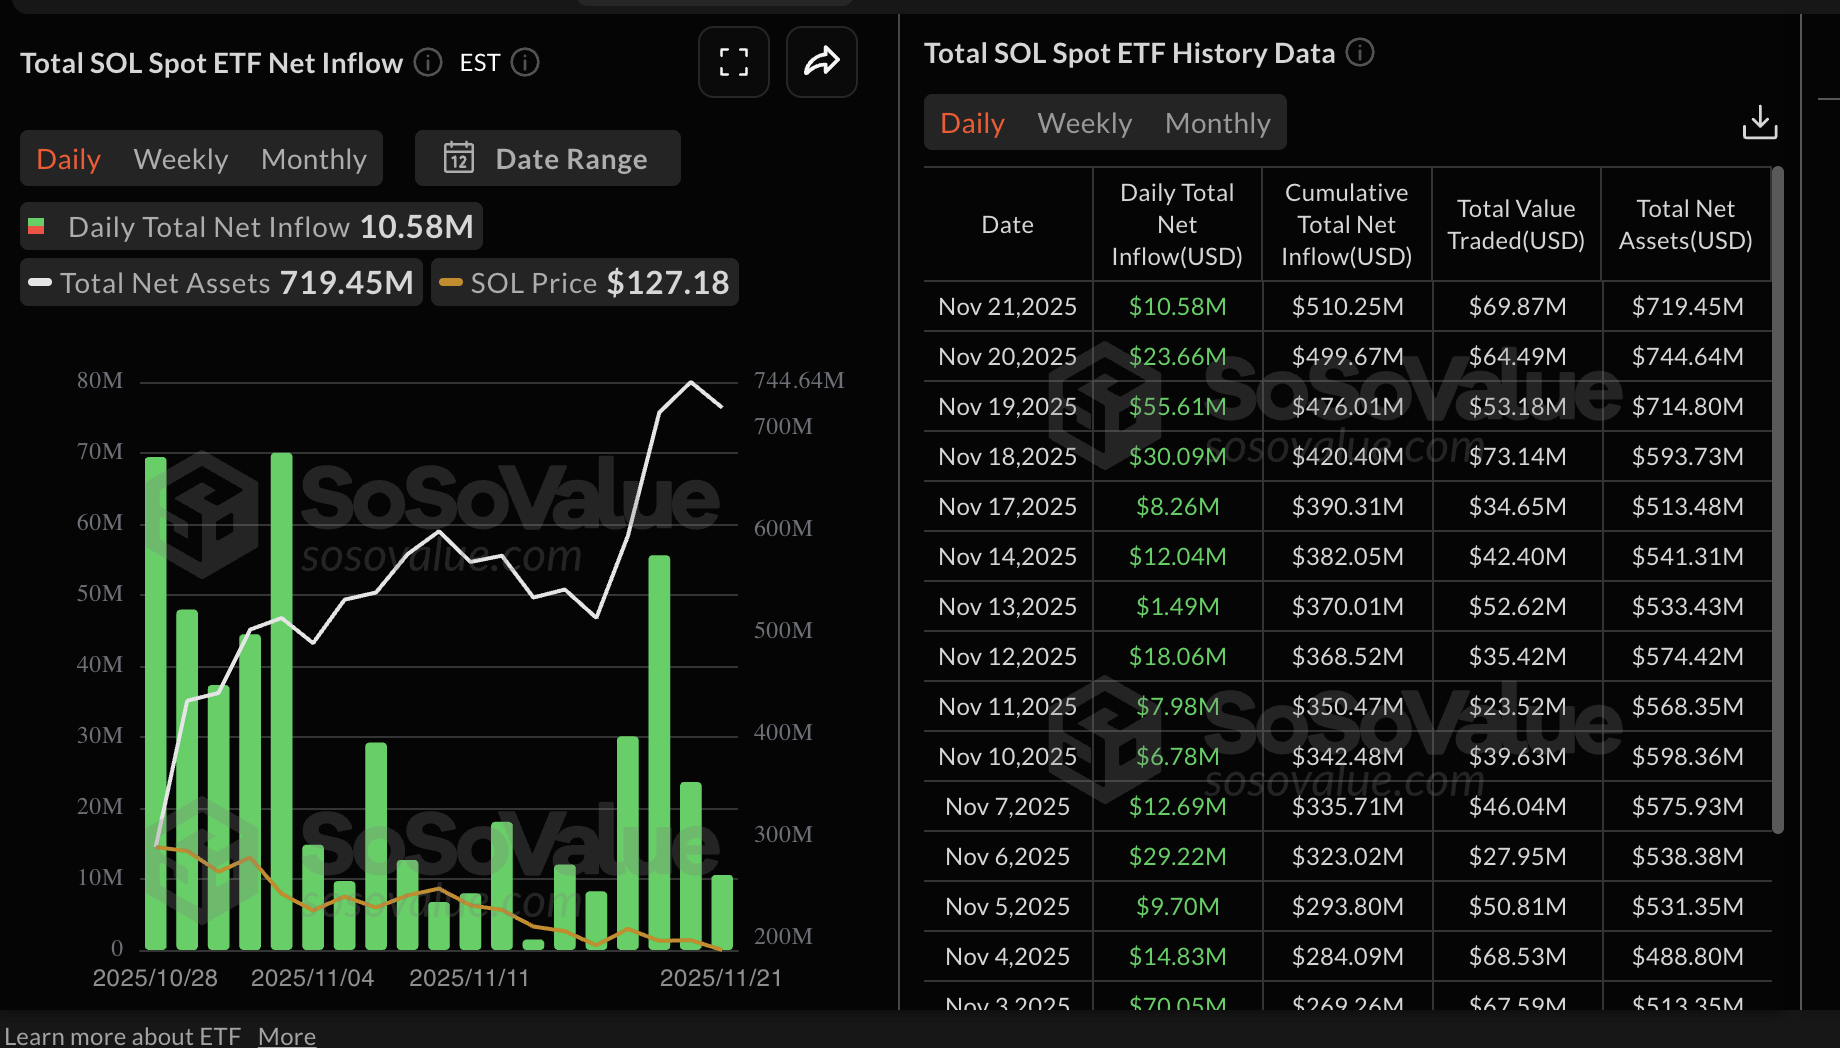
- SOL ETFs extended inflows on Friday even as related investment products experienced outflows of $156 million last week.
Solana (SOL) remains marginally below $130 at the time of writing on Monday, reflecting risk-off sentiment in the broader cryptocurrency market. SOL hit an intraday high of $134 but retraced, signaling growing uncertainty and high volatility.
Retail interest in Solana remains relatively low, as evidenced by the futures market Open Interest (OI) $6.95 billion on Monday. Since OI, which represents the notional value of outstanding futures contracts, hit a record high of $17.1 billion on September 19, a price downtrend has persisted amid an elusive recovery.
Solana futures OI must steadily rise to support risk-on sentiment as investors increasingly bet on higher prices. However, a weak derivatives market could uphold the downtrend toward $100.
Solana struggles amid steady ETF inflows
Solana Exchange Traded Funds (ETFs) listed in the United States (US) maintained their steady inflow streak, recording nearly $11 million in inflows on Friday. According to SoSoValue, SOL ETFs have cumulative net inflows of approximately $510 million, with net assets averaging $719 million.
The steady inflow trend suggests that institutional investors are turning toward newly launched altcoin-based ETFs. ETF demand is crucial for driving sentiment in the cryptocurrency market, with inflows supporting a short-term bullish outlook.
Technical outlook: Solana recovery stalls
Solana is trading below the round-number hurdle of $130 at the time of writing on Monday. The token also holds below the 50-day Exponential Moving Average (EMA) at $166, 100-day EMA at $178 and the 200-day EMA at $178, which slope lower and maintain a bearish bias.
The 50-day EMA at sits under both the 100- and 200-day EMAs, delineating a descending supply band. At the same time, the Moving Average Convergence Divergence (MACD) line edges above the signal line near zero, with a modest positive histogram that suggests nascent upside momentum.
Meanwhile, the Relative Strength Index (RSI) is stabilizing at 32, but still below the midline. Without a recovery through the short-term average, sellers would remain in control.
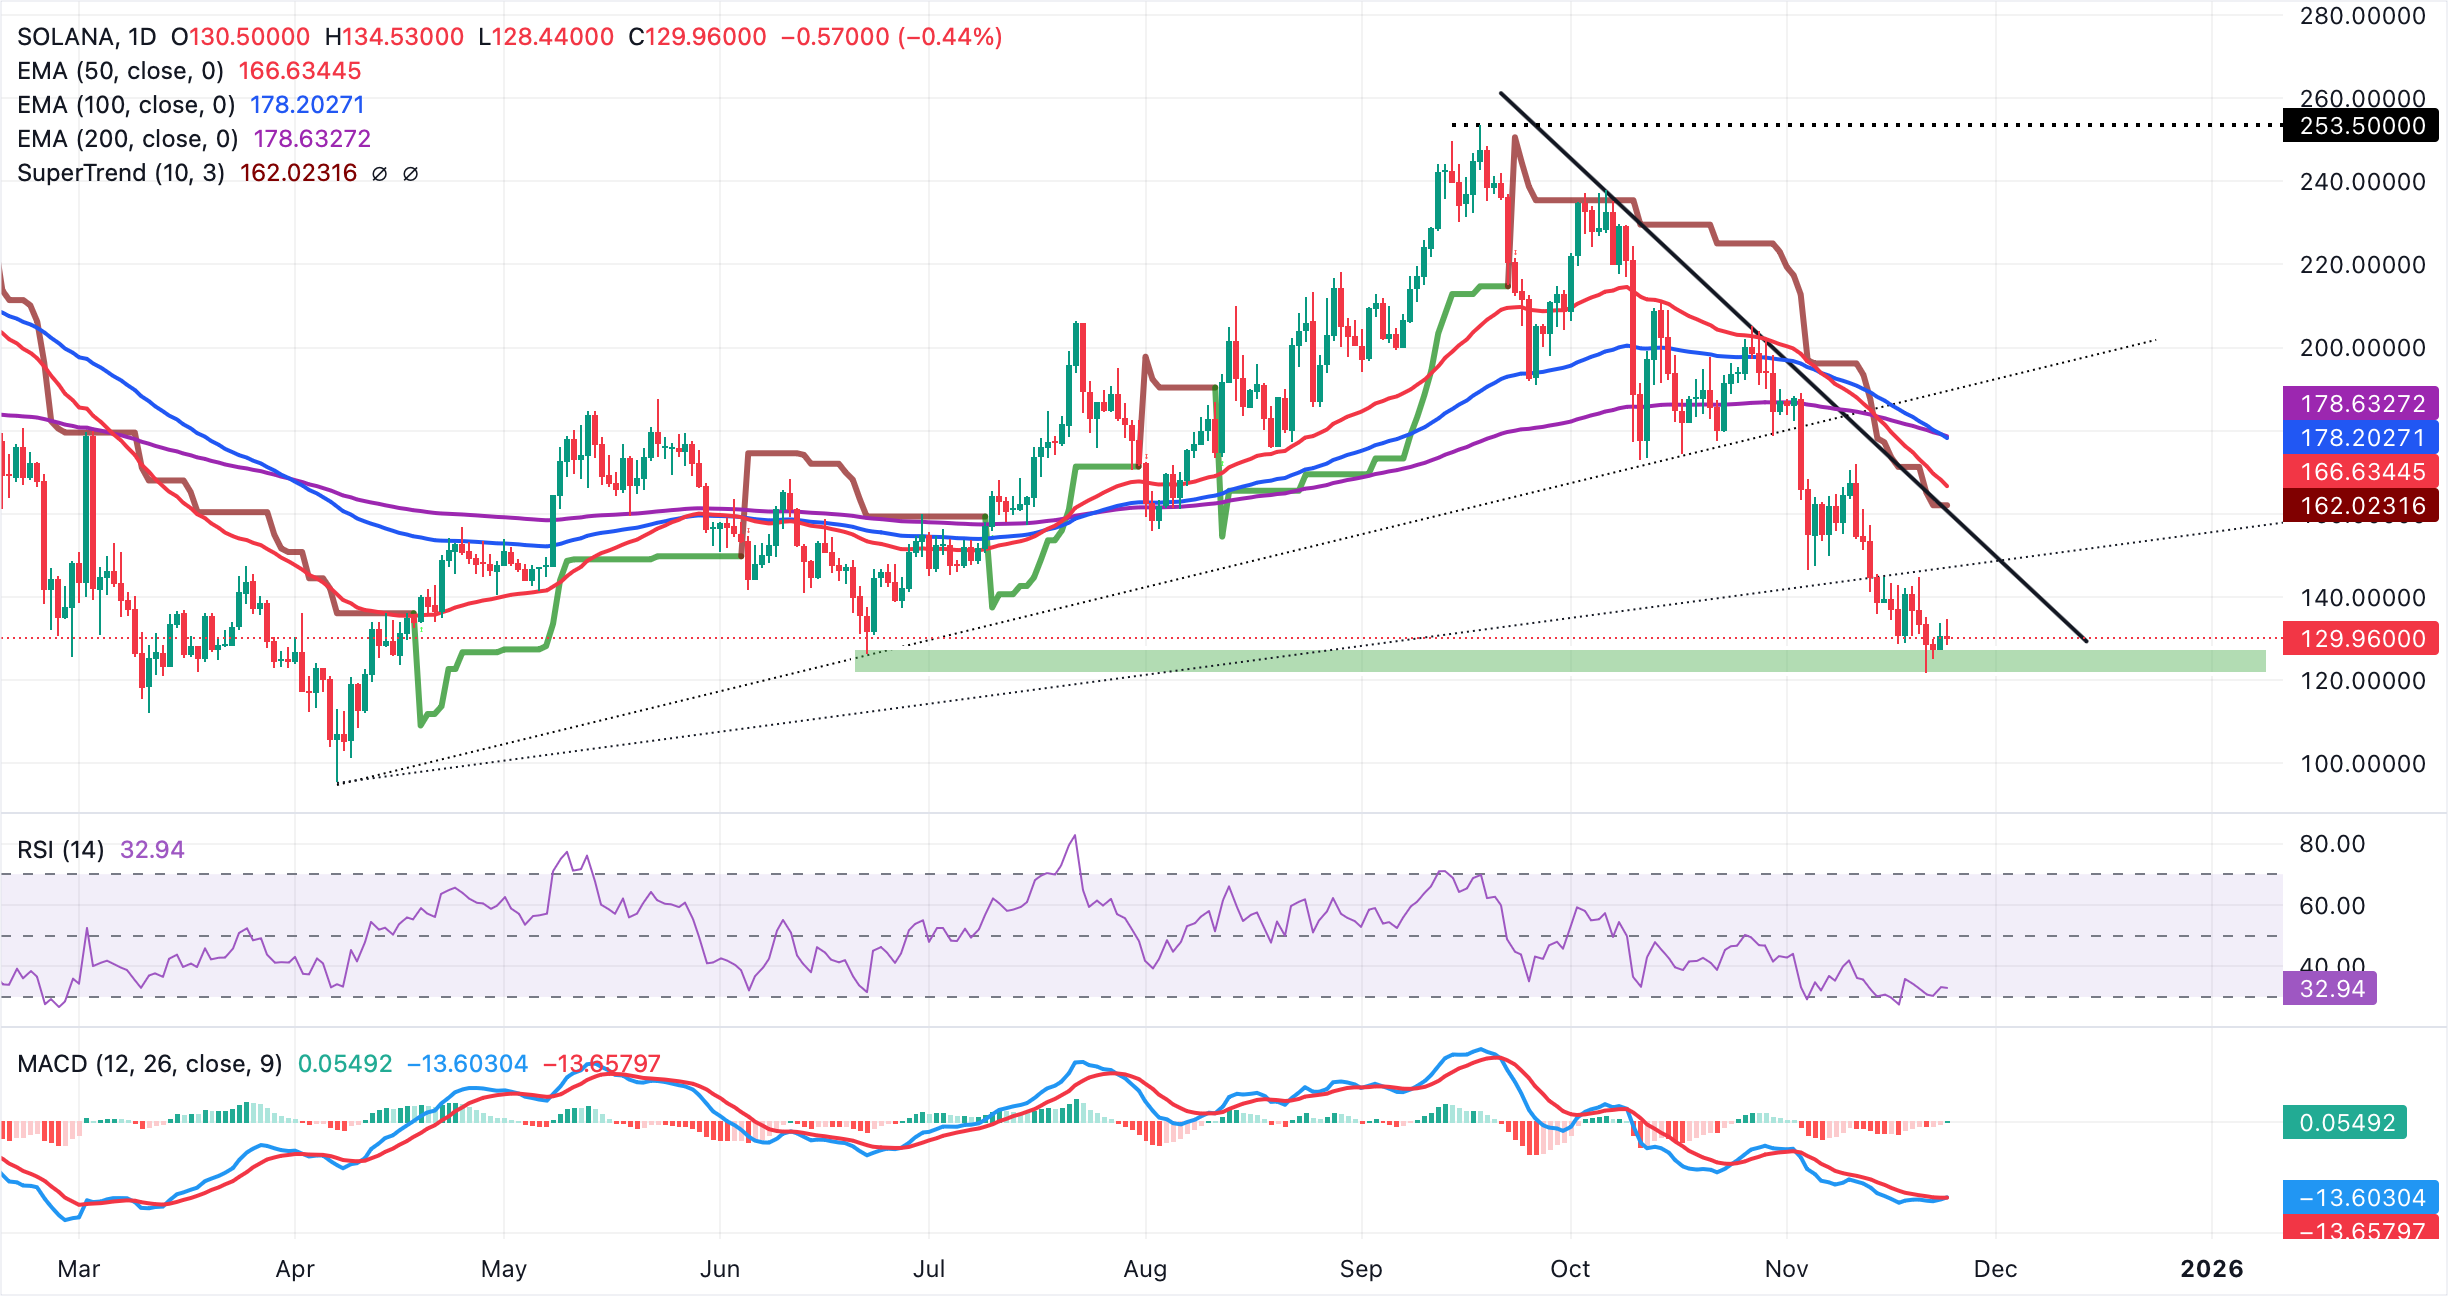
Overhead resistance aligns at $159 – $162, where the descending trend line from $261 meets the SuperTrend indicator. A break below the rising trend line from $95 reinforces the downside tone. Unless buyers reclaim that cluster, any bounce would face supply, while the broader downtrend would extend on fresh lows, targeting $100.
Open Interest, funding rate FAQs
Higher Open Interest is associated with higher liquidity and new capital inflow to the market. This is considered the equivalent of increase in efficiency and the ongoing trend continues. When Open Interest decreases, it is considered a sign of liquidation in the market, investors are leaving and the overall demand for an asset is on a decline, fueling a bearish sentiment among investors.
Funding fees bridge the difference between spot prices and prices of futures contracts of an asset by increasing liquidation risks faced by traders. A consistently high and positive funding rate implies there is a bullish sentiment among market participants and there is an expectation of a price hike. A consistently negative funding rate for an asset implies a bearish sentiment, indicating that traders expect the cryptocurrency’s price to fall and a bearish trend reversal is likely to occur.
(The technical analysis of this story was written with the help of an AI tool)

FXStreet
100만 명이 넘는 사용자가 FXStreet를 통해 실시간 시장 데이터, 차트 도구, 전문가 인사이트, 포렉스 뉴스를 이용합니다. 포괄적인 경제 캘린더와 교육 웨비나는 트레이더가 정보를 유지하고 신중한 결정을 내리도록 돕습니다. FXStreet는 바르셀로나 본사와 전 세계 지역에 걸쳐 약 60명의 팀으로 구성되어 있습니다.
Read More


