
Solana rebounds amid ETF inflows, futures data highlights sell-side dominance
작성자 Vishal Dixit
게시일: 21 Jan 2026 | 수정일: 21 Jan 2026


인기 기사

Solana (SOL) rises against headwinds by over 1% at press time on Wednesday, after four consecutive days of losses. Institutional inflows on Tuesday reaffirm steady interest in Solana, while retail sentiment falters, as evidenced by declining Open Interest and massive long liquidations.
- Solana recovers by 1% on Wednesday after a four-day freefall amid persistent downside bias.
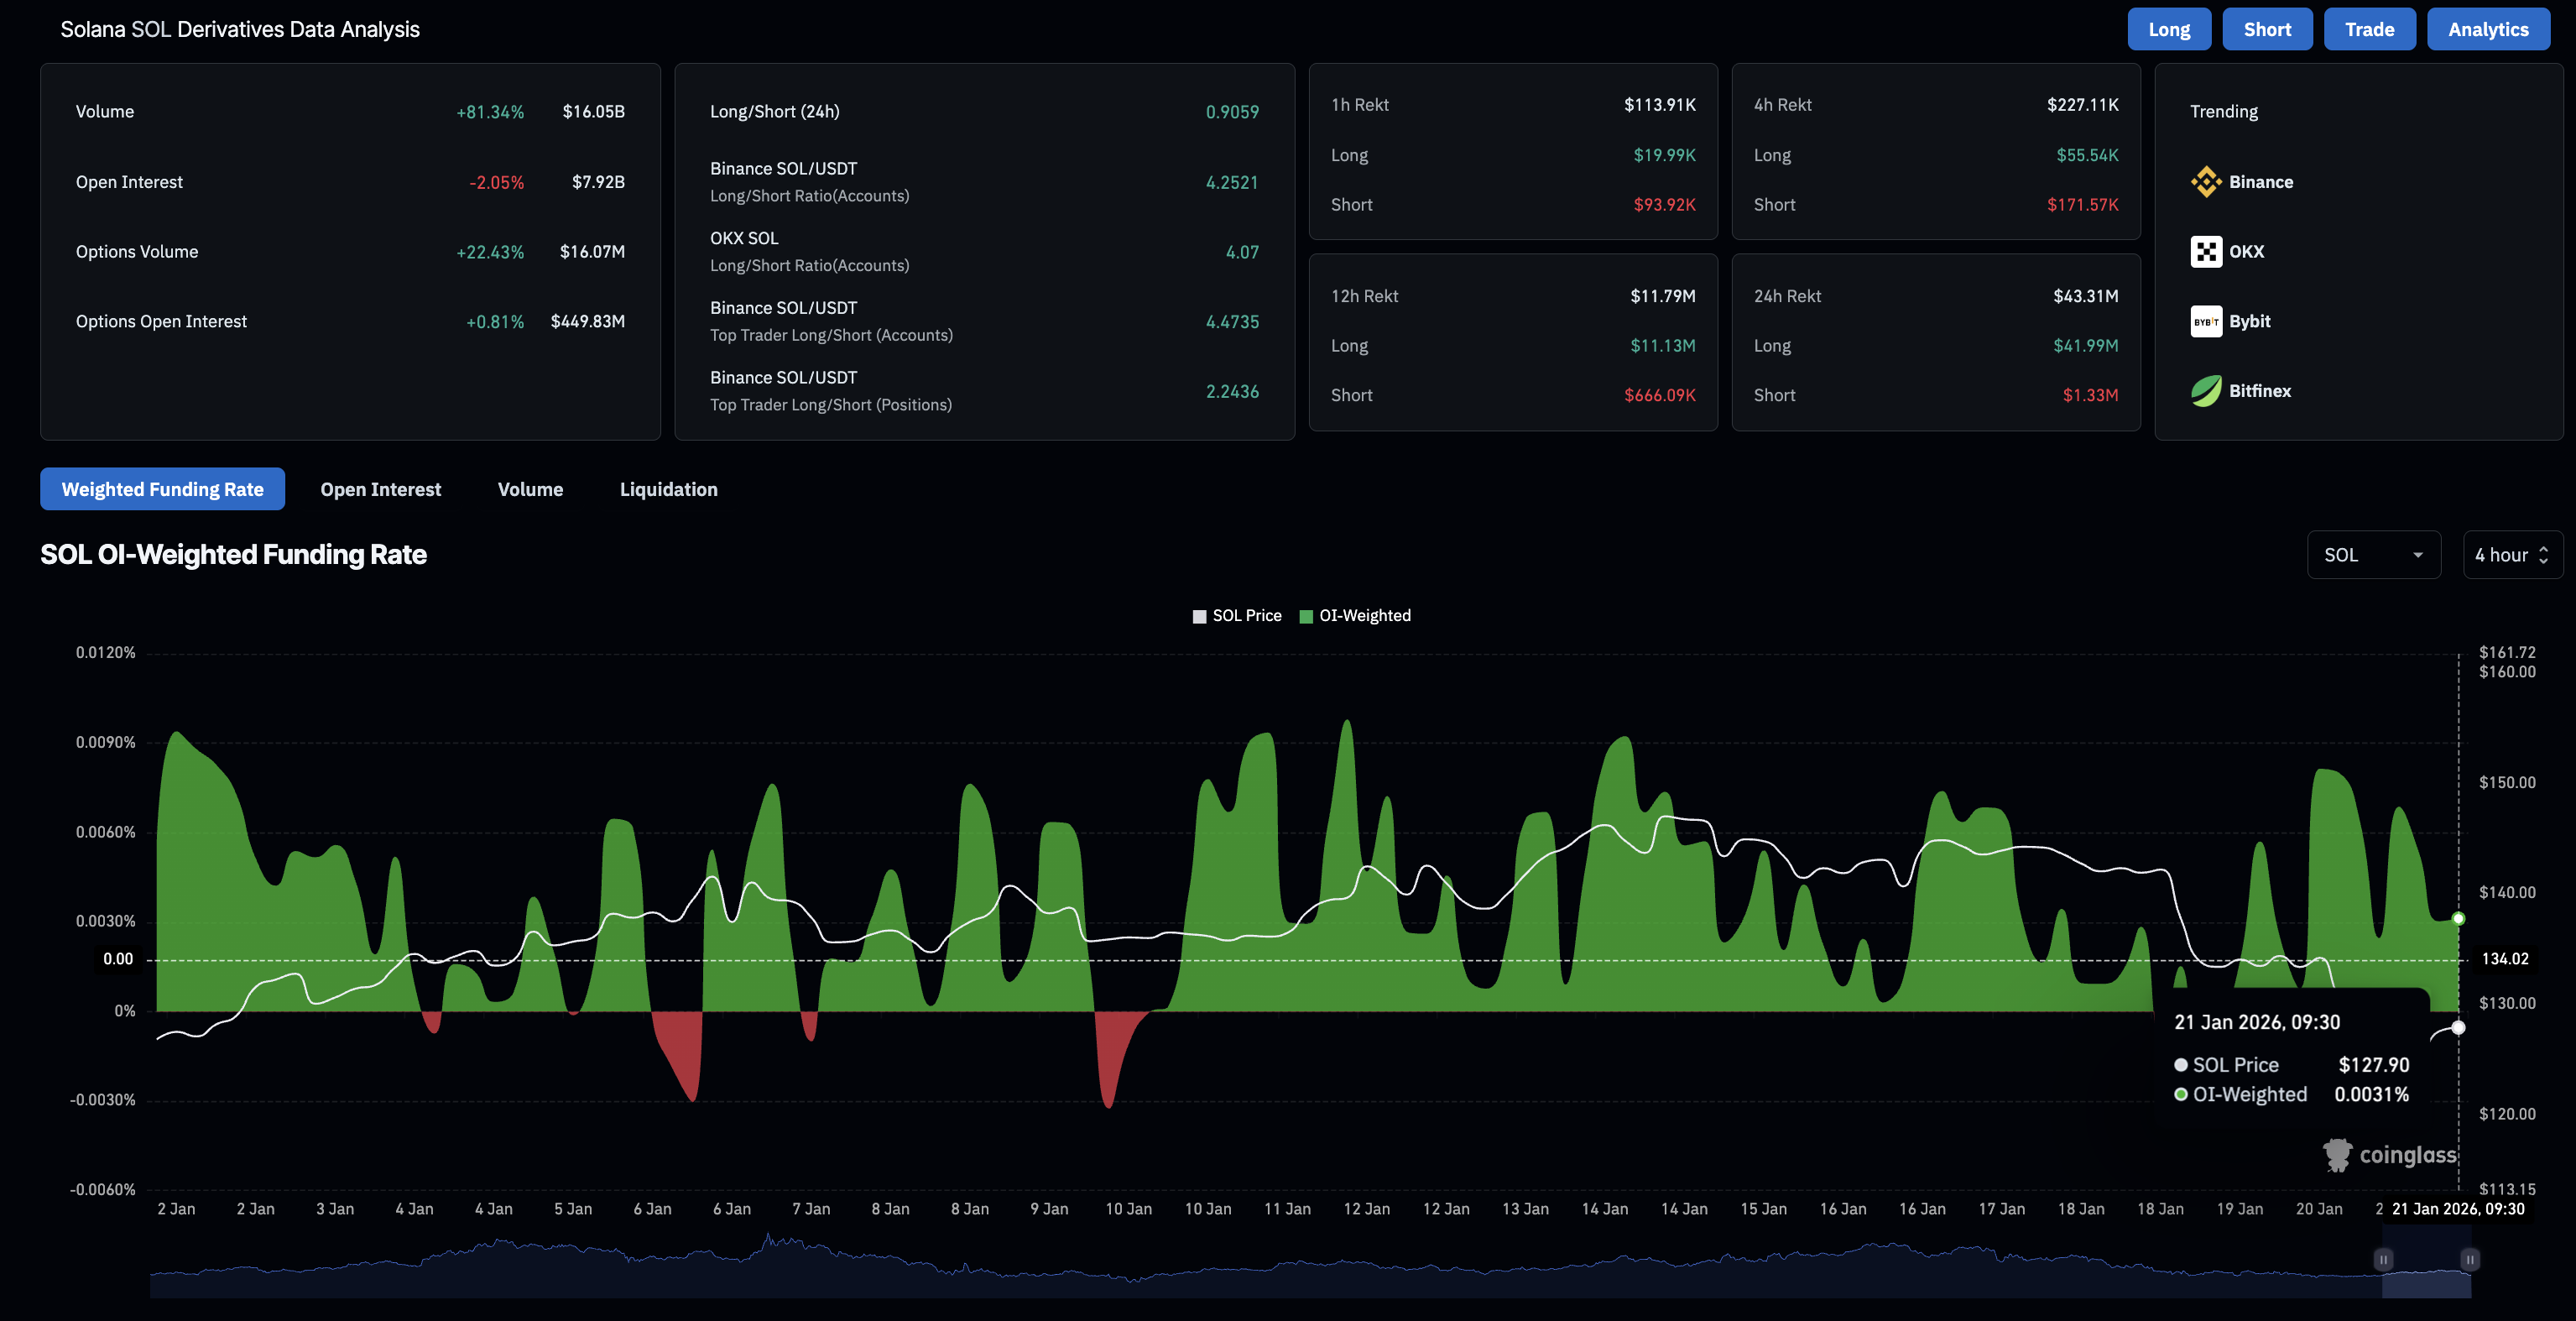
- Nearly $42 million in long liquidation and a 2% drop in Open interest in the last 24 hours signal sell-side dominance in Solana futures.
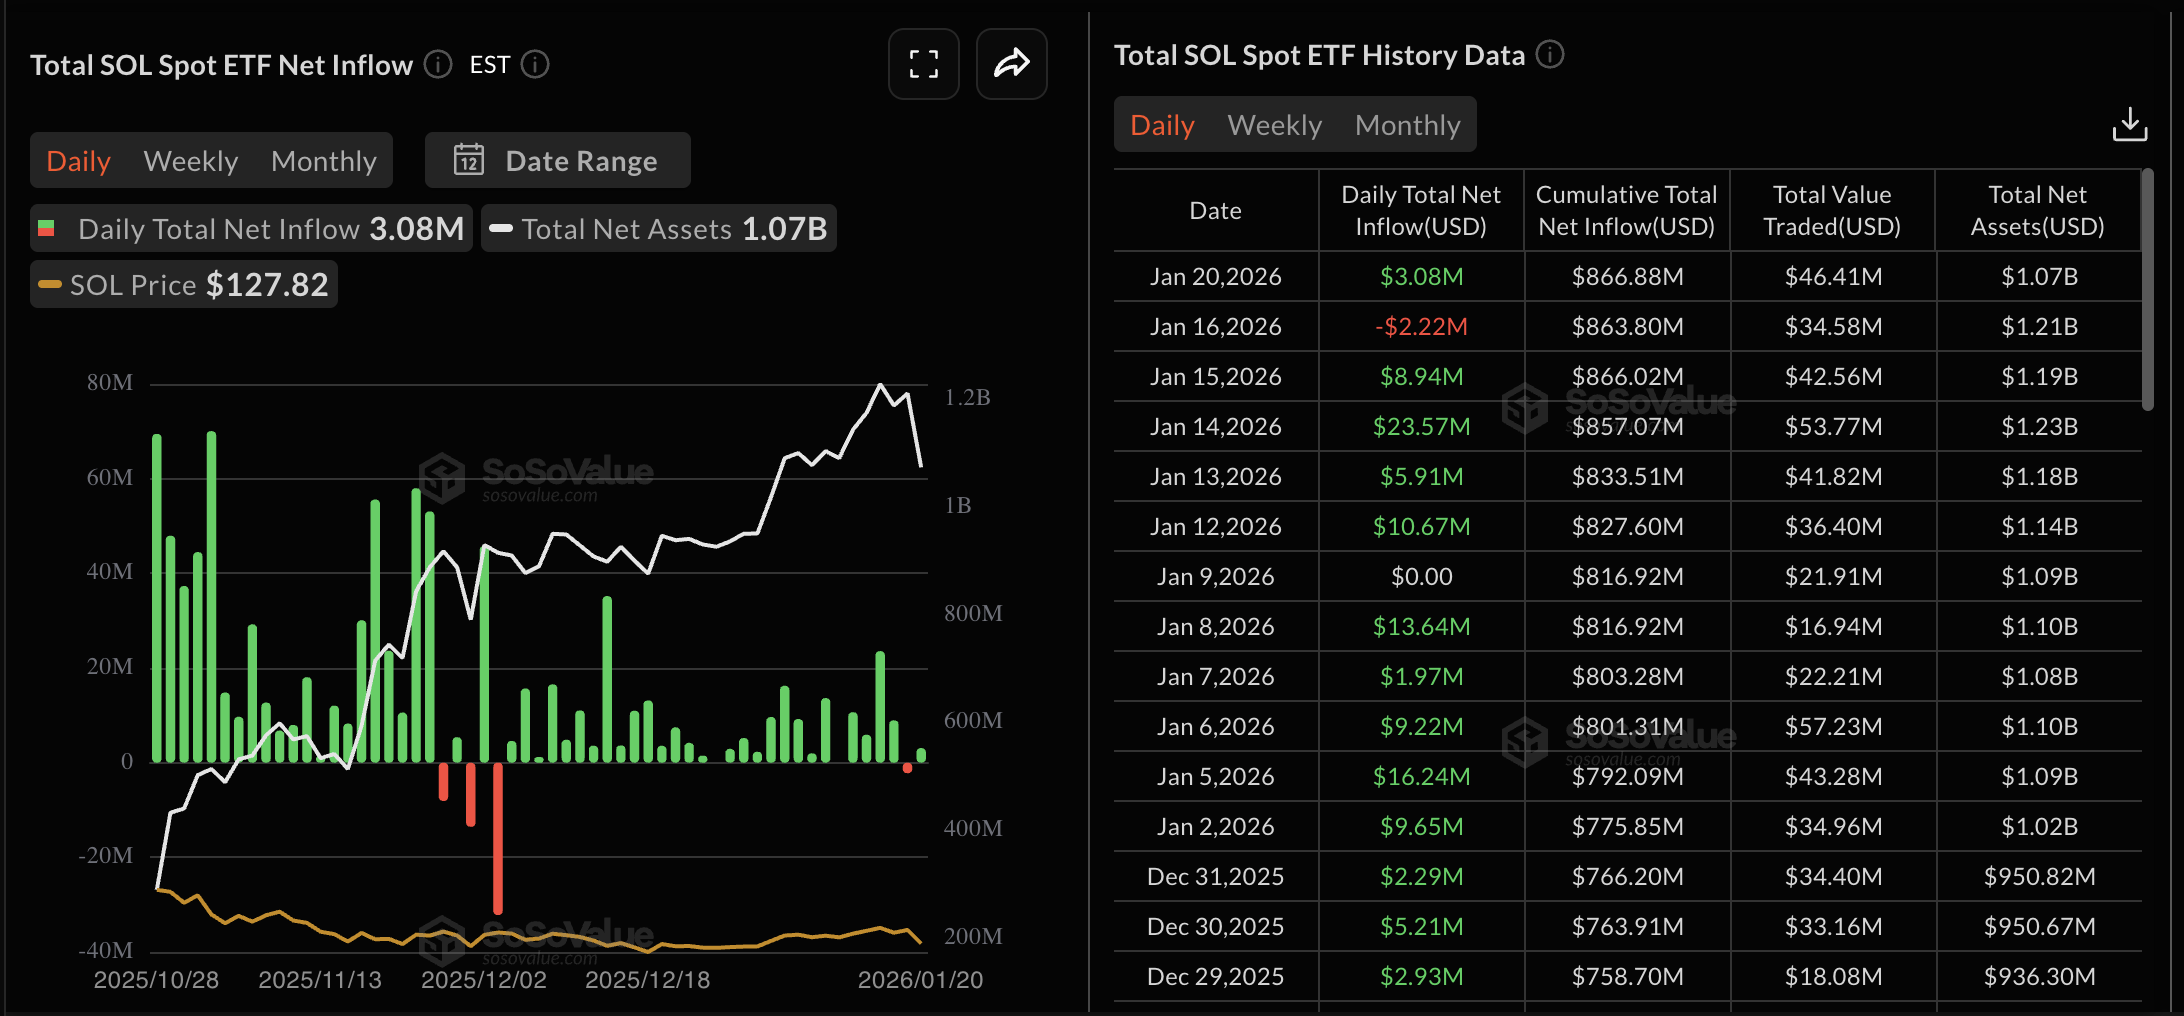
- Solana ETFs recorded a net inflow of over $3 million on Tuesday, suggesting steady institutional interest.
Solana (SOL) rises against headwinds by over 1% at press time on Wednesday, after four consecutive days of losses. Institutional inflows on Tuesday reaffirm steady interest in Solana, while retail sentiment falters, as evidenced by declining Open Interest and massive long liquidations. The technical outlook for Solana focuses on increased selling pressure, shifting momentum, and the potential for a path of least resistance to the downside.
Retail sentiment falters despite ETF inflows
The US spot SOL Exchange Traded Funds (ETFs) on Tuesday recorded $3.80 million in inflows, recovering from $2.22 million in outflows from Friday. This inflow signals steady institutional interest in Solana amid declining crypto and global financial markets.
Meanwhile, the Solana Open Interest (OI) is down 2.05% over the last 24 hours, to $7.92 billion, reflecting a significant decline in the value of outstanding futures contracts, including leverage. In line with reduced capital, long liquidations of $41.99 million in the same timeframe outpaced short liquidations of $1.33 million, wiping out broadly bullish-aligned positions.
The institutional interest could hold Solana in the short term, while a steady decline in market sentiment would increase the likelihood of a sharp correction.
Technical outlook: Will Solana extend its pullback to $100?
Solana trades below $130 at press time on Wednesday, down roughly 7% so far this week amid rising geopolitical tensions driven by US President Donald Trump's tariff threats. The 20-day Exponential Moving Average (EMA) at $135 reverses from the 50-day EMA, signaling renewed short-term selling.
Technical indicators on the daily chart suggest strengthening downward momentum for Solana. The Moving Average Convergence Divergence (MACD) line extends below the red signal line toward the zero line, deepening negative histogram bars. The Relative Strength Index (RSI) stands at 41, below the midline, reinforcing sellers' control.
A downside continuation in Solana could test the support zone between the December 18 low at $116 and the S1 Pivot Point at $112.
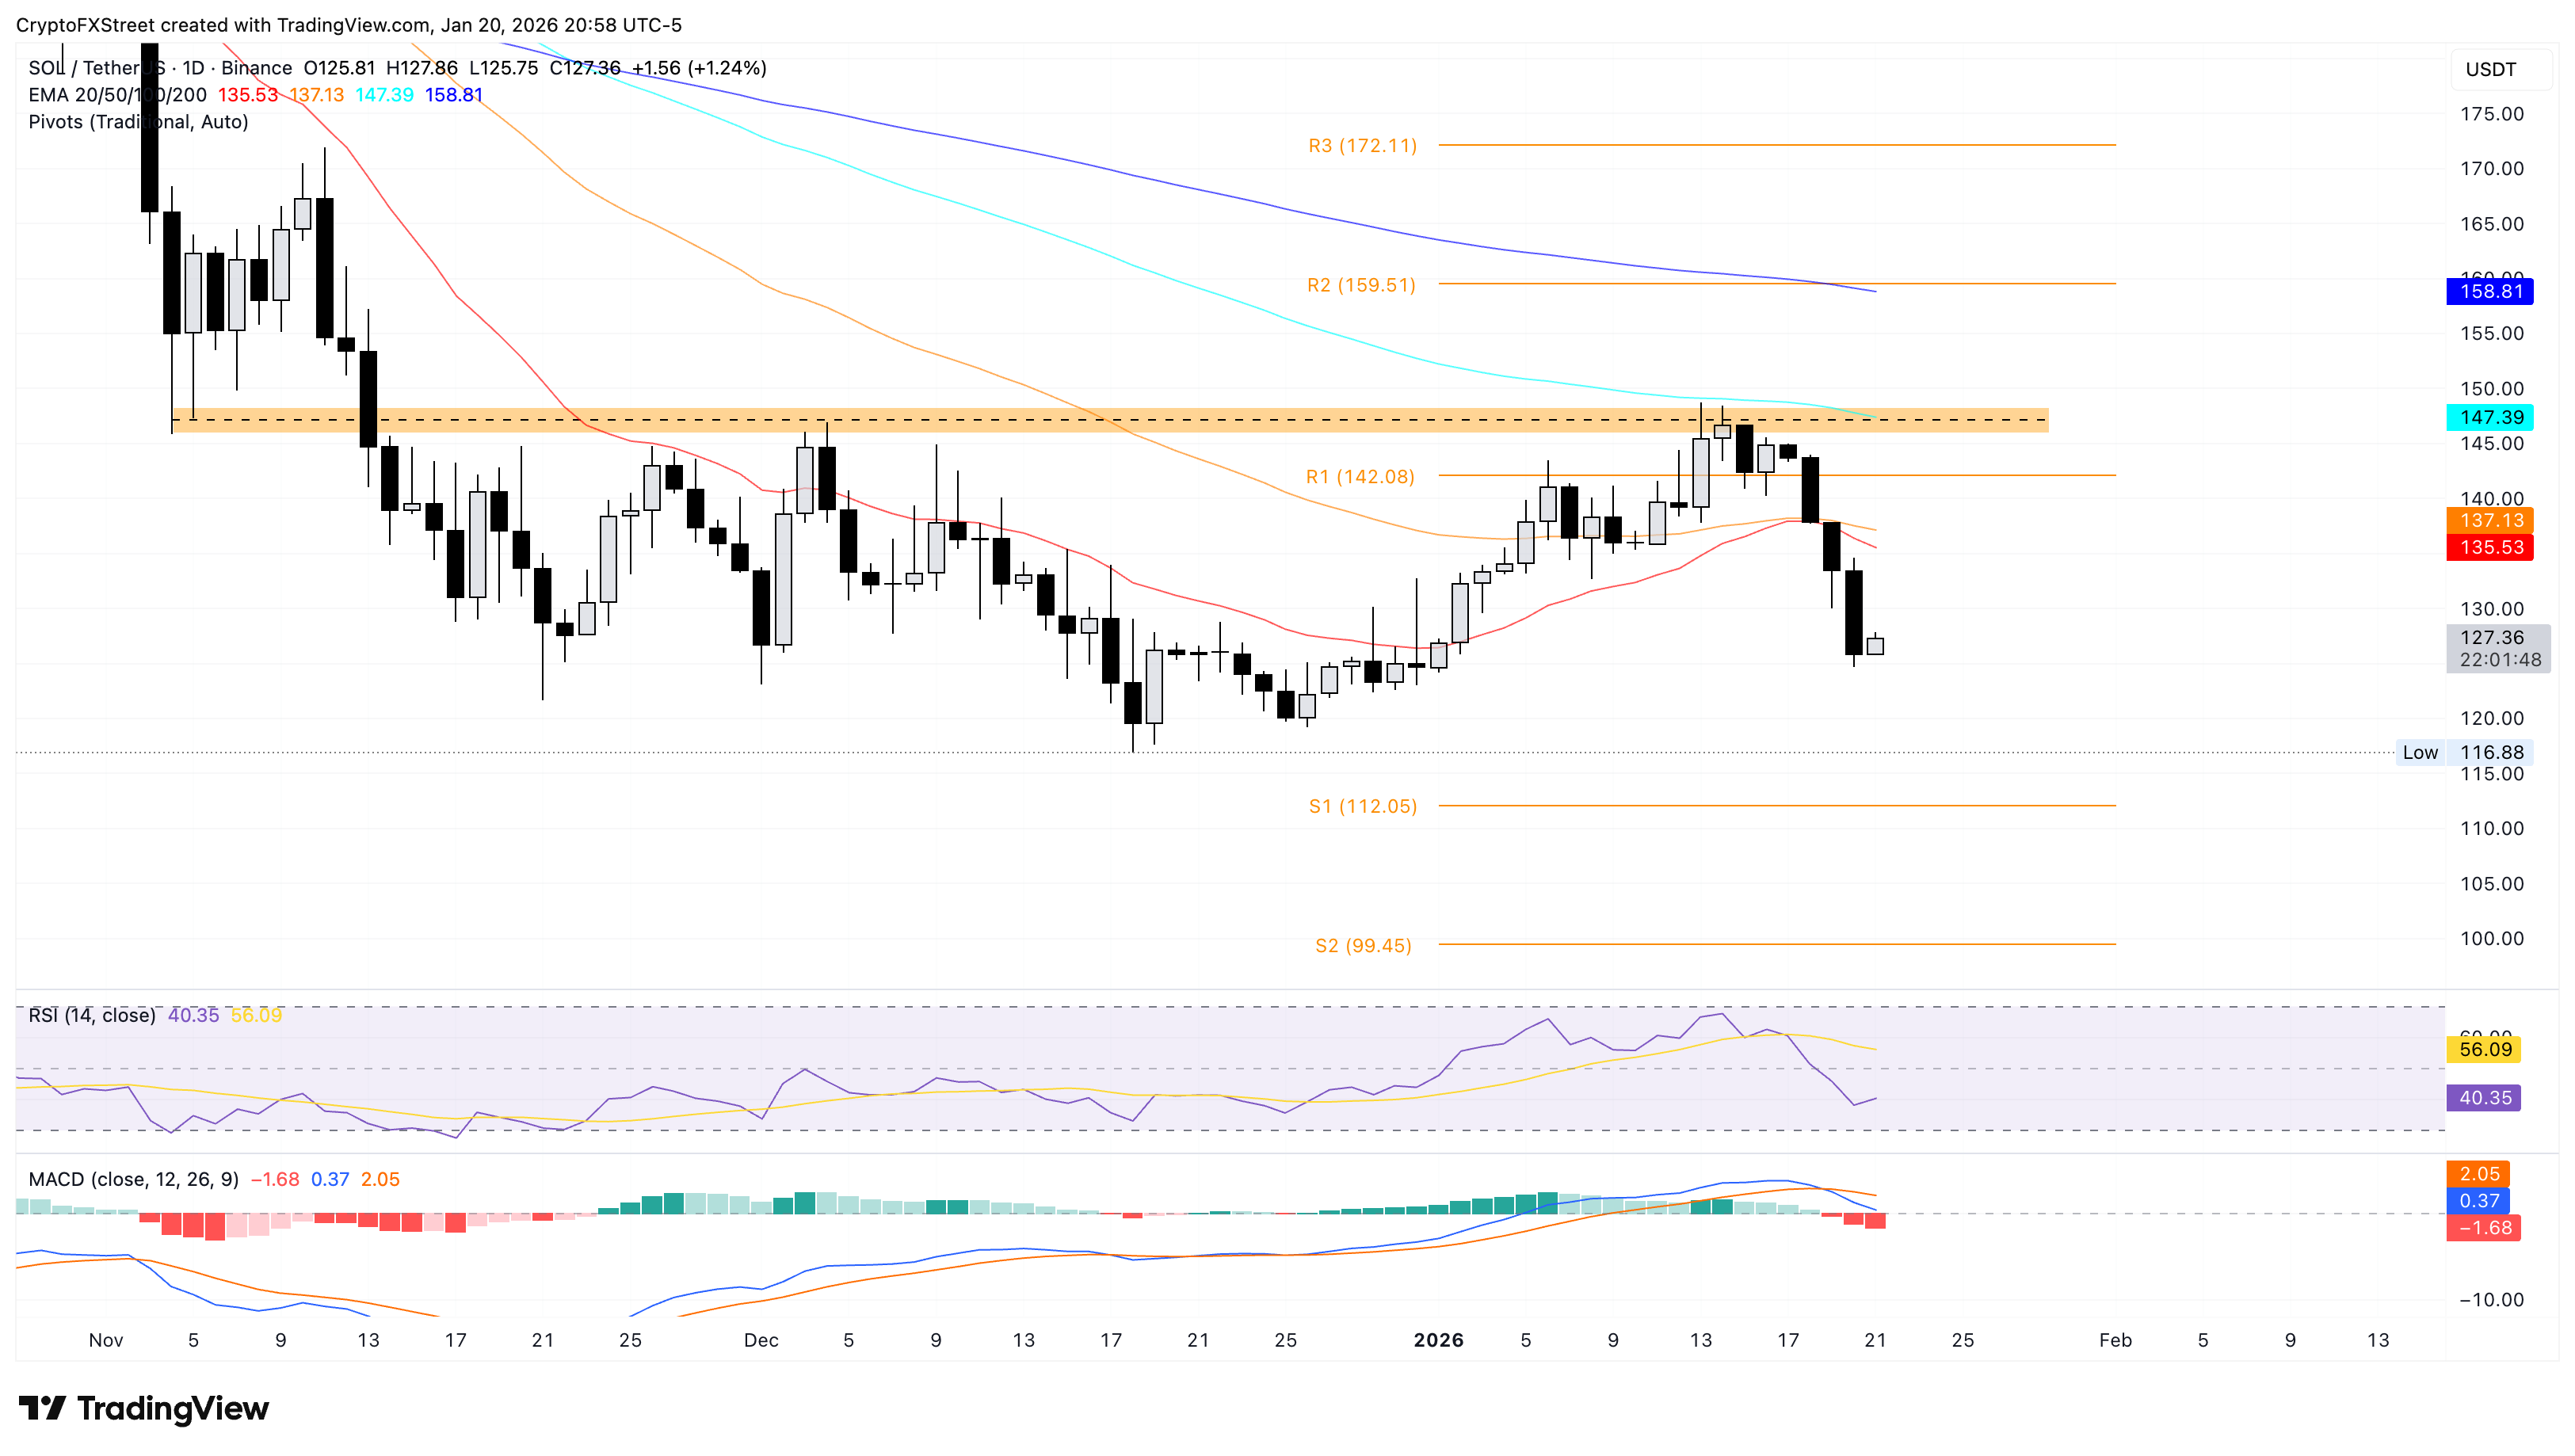
Apart from the 20-day and 50-day EMAs, Solana could face significant headwinds near the $145-$148 resistance zone, which also coincides with the 100-day EMA at $147.
(The technical analysis of this story was written with the help of an AI tool.)

100만 명이 넘는 사용자가 FXStreet를 통해 실시간 시장 데이터, 차트 도구, 전문가 인사이트, 포렉스 뉴스를 이용합니다. 포괄적인 경제 캘린더와 교육 웨비나는 트레이더가 정보를 유지하고 신중한 결정을 내리도록 돕습니다. FXStreet는 바르셀로나 본사와 전 세계 지역에 걸쳐 약 60명의 팀으로 구성되어 있습니다.
더 읽기


