
Trade The World
Stellar Price Forecast: Bearish outlook amid losing streak targets April low
작성자 Vishal Dixit
게시일: 16 Dec 2025 | 수정일: 16 Dec 2025


POPULAR ARTICLES

Stellar (XLM) trades in the red for the seventh straight day, losing over 1% at press time on Tuesday. The closest competitor to Ripple (XRP) in the crypto space is losing retail support, evidenced by rising bearish bets in XLM derivatives.
- Stellar extends losses for the seventh consecutive day by 1% on Tuesday, after hitting its lowest daily close in nine months on Monday.
- Derivatives data signals a bearish positional buildup as declining prices largely wipe out bullish positions.
- The technical outlook for XLM remains bearish, targeting April’s low at $0.2001.
Stellar (XLM) trades in the red for the seventh straight day, losing over 1% at press time on Tuesday. The closest competitor to Ripple (XRP) in the crypto space is losing retail support, evidenced by rising bearish bets in XLM derivatives. Technically, XLM risks the $0.2000 psychological support as it approaches April’s low.
XLM derivatives warn of bearish bias among traders
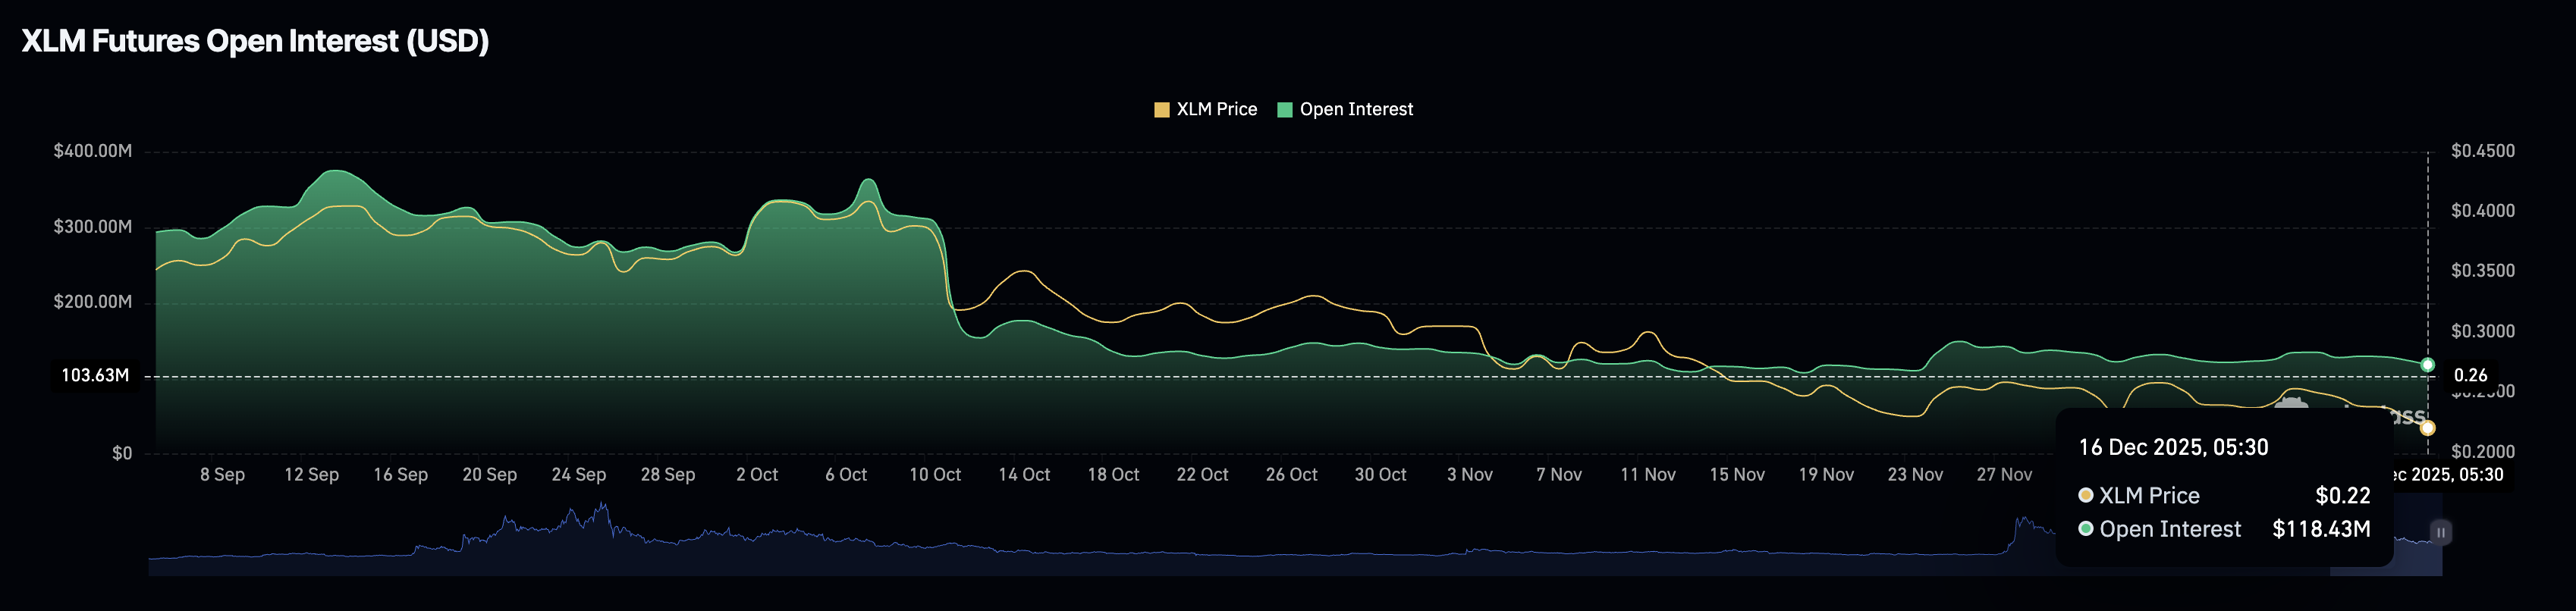
CoinGlass data shows that XLM futures Open Interest (OI) is in a largely declining trend, at $118.43 million, down from $124.72 million on Monday. Falling OI indicates a loss in the notional value of XLM futures, which is the total value of all active positions (long and short), including the leverage.
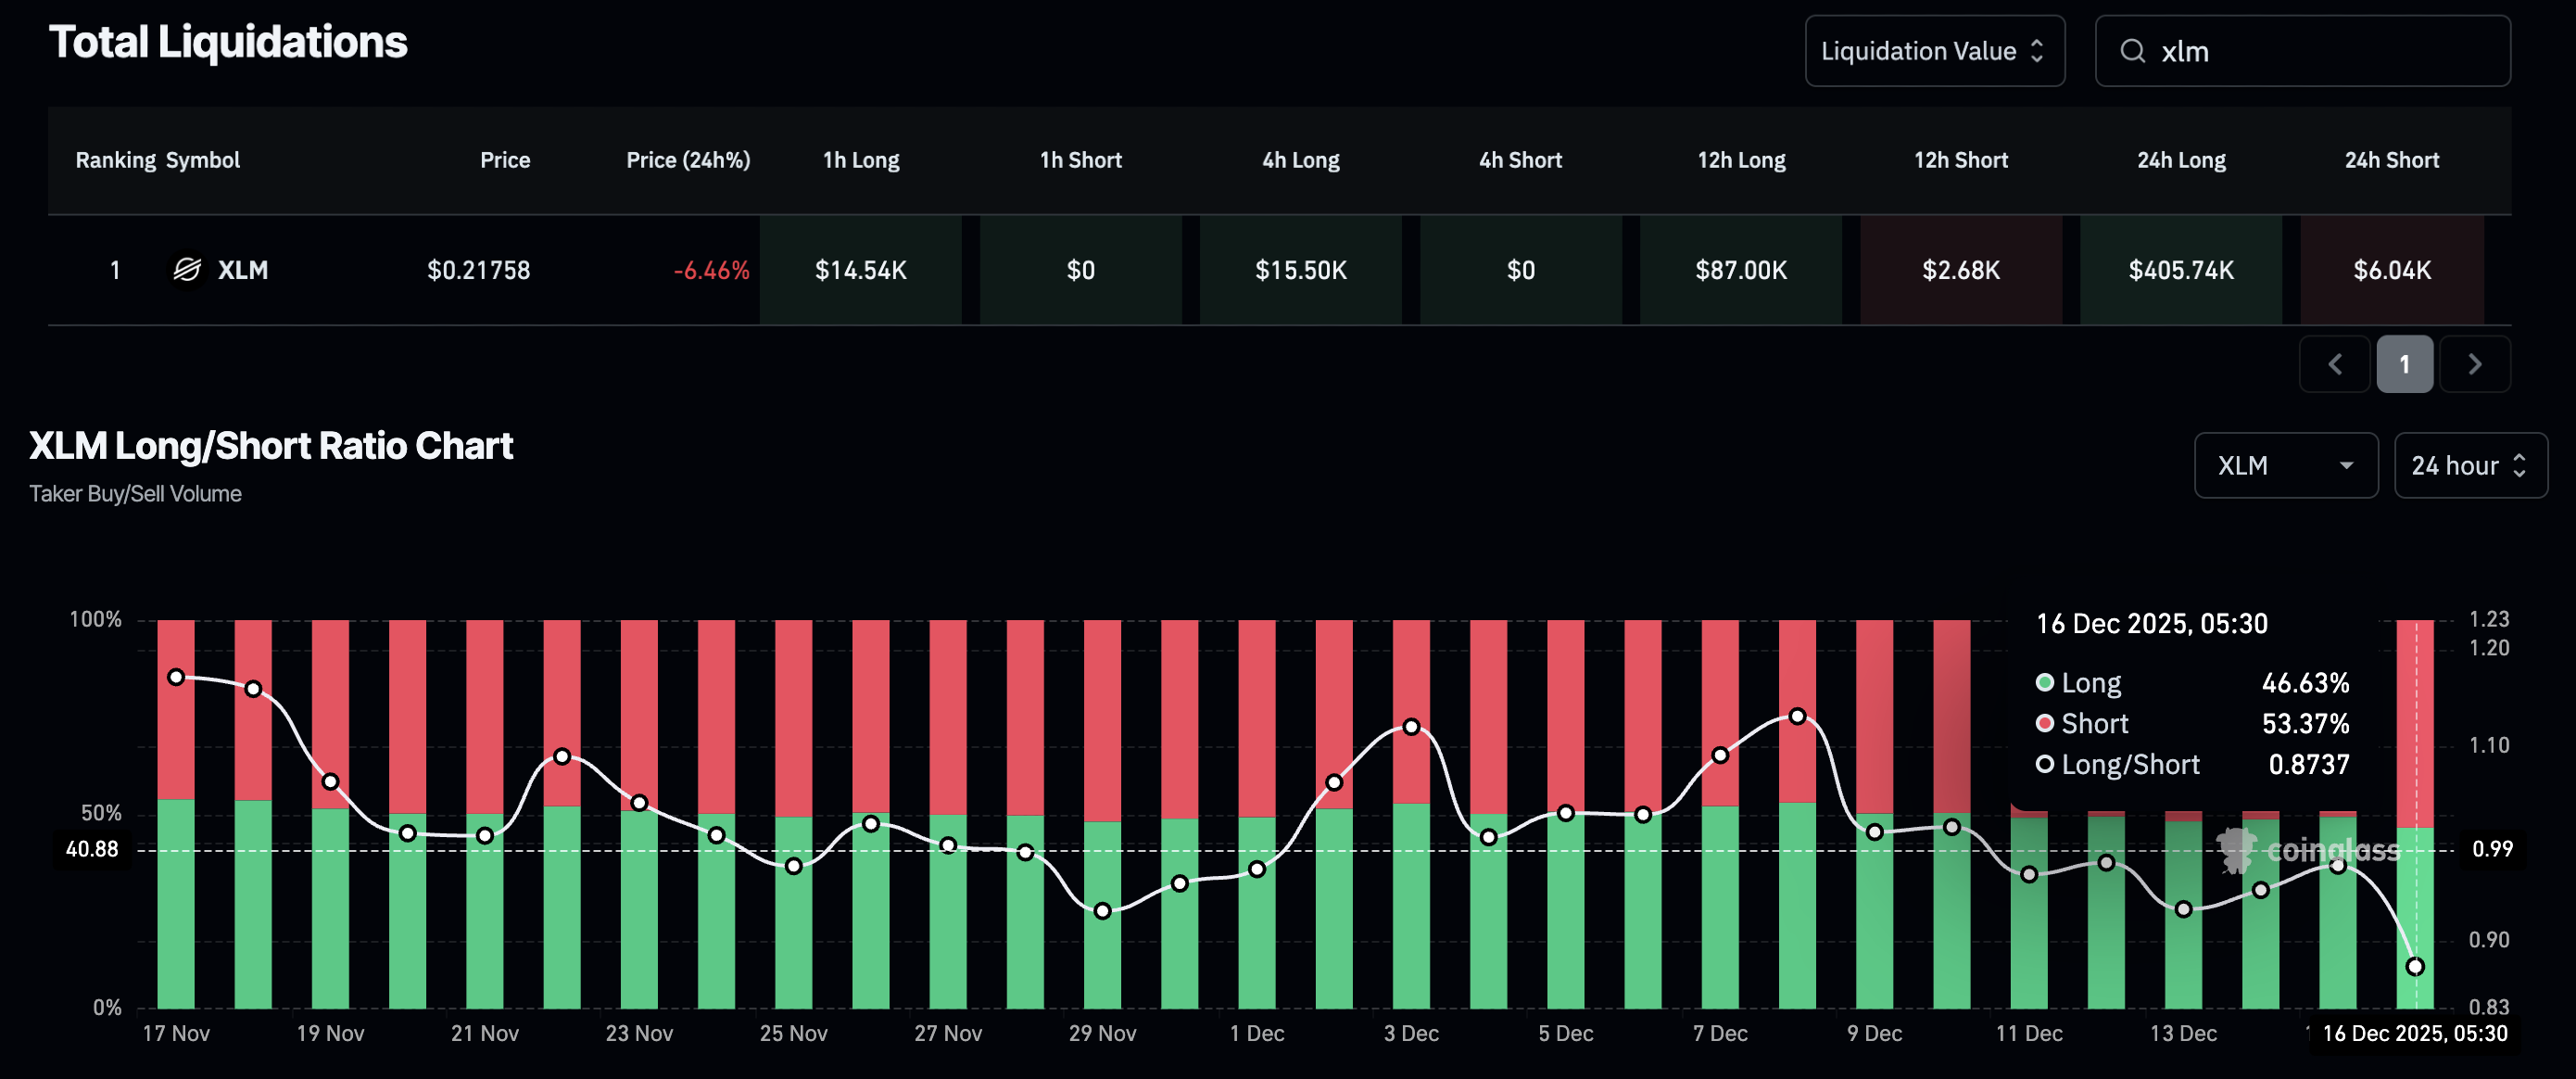
Amid declining risk appetite, long liquidations over the last 24 hours totaled $406,740, outpacing short liquidations of $6,040 in the same period. This increased wipeout of long positions left a larger number of active short positions, creating a sell-side dominance in the XLM derivatives. The long-to-short ratio chart shows that short positions surged to 53.37% on Tuesday, from 50.57% over the last 24 hours.
Stellar’s freefall threatens a key psychological support
Stellar extends its steady downside move after recording the lowest daily close so far in 2025 at $0.2205 on Monday. The declining trend in XLM approaches the $0.2001 level marked by the April 7 low.
If the cross-border remittance token slips below this level, it could aim for the S2 Pivot Point at $0.1642, followed by the annual low of $0.1600.
Technically, Stellar could move further to the downside, as momentum indicators on the daily chart signal a bearish bias. The Relative Strength Index (RSI) is at 33, pointing toward the oversold zone, while the Moving Average Convergence Divergence (MACD) is falling steeply after crossing below the signal line on Monday.
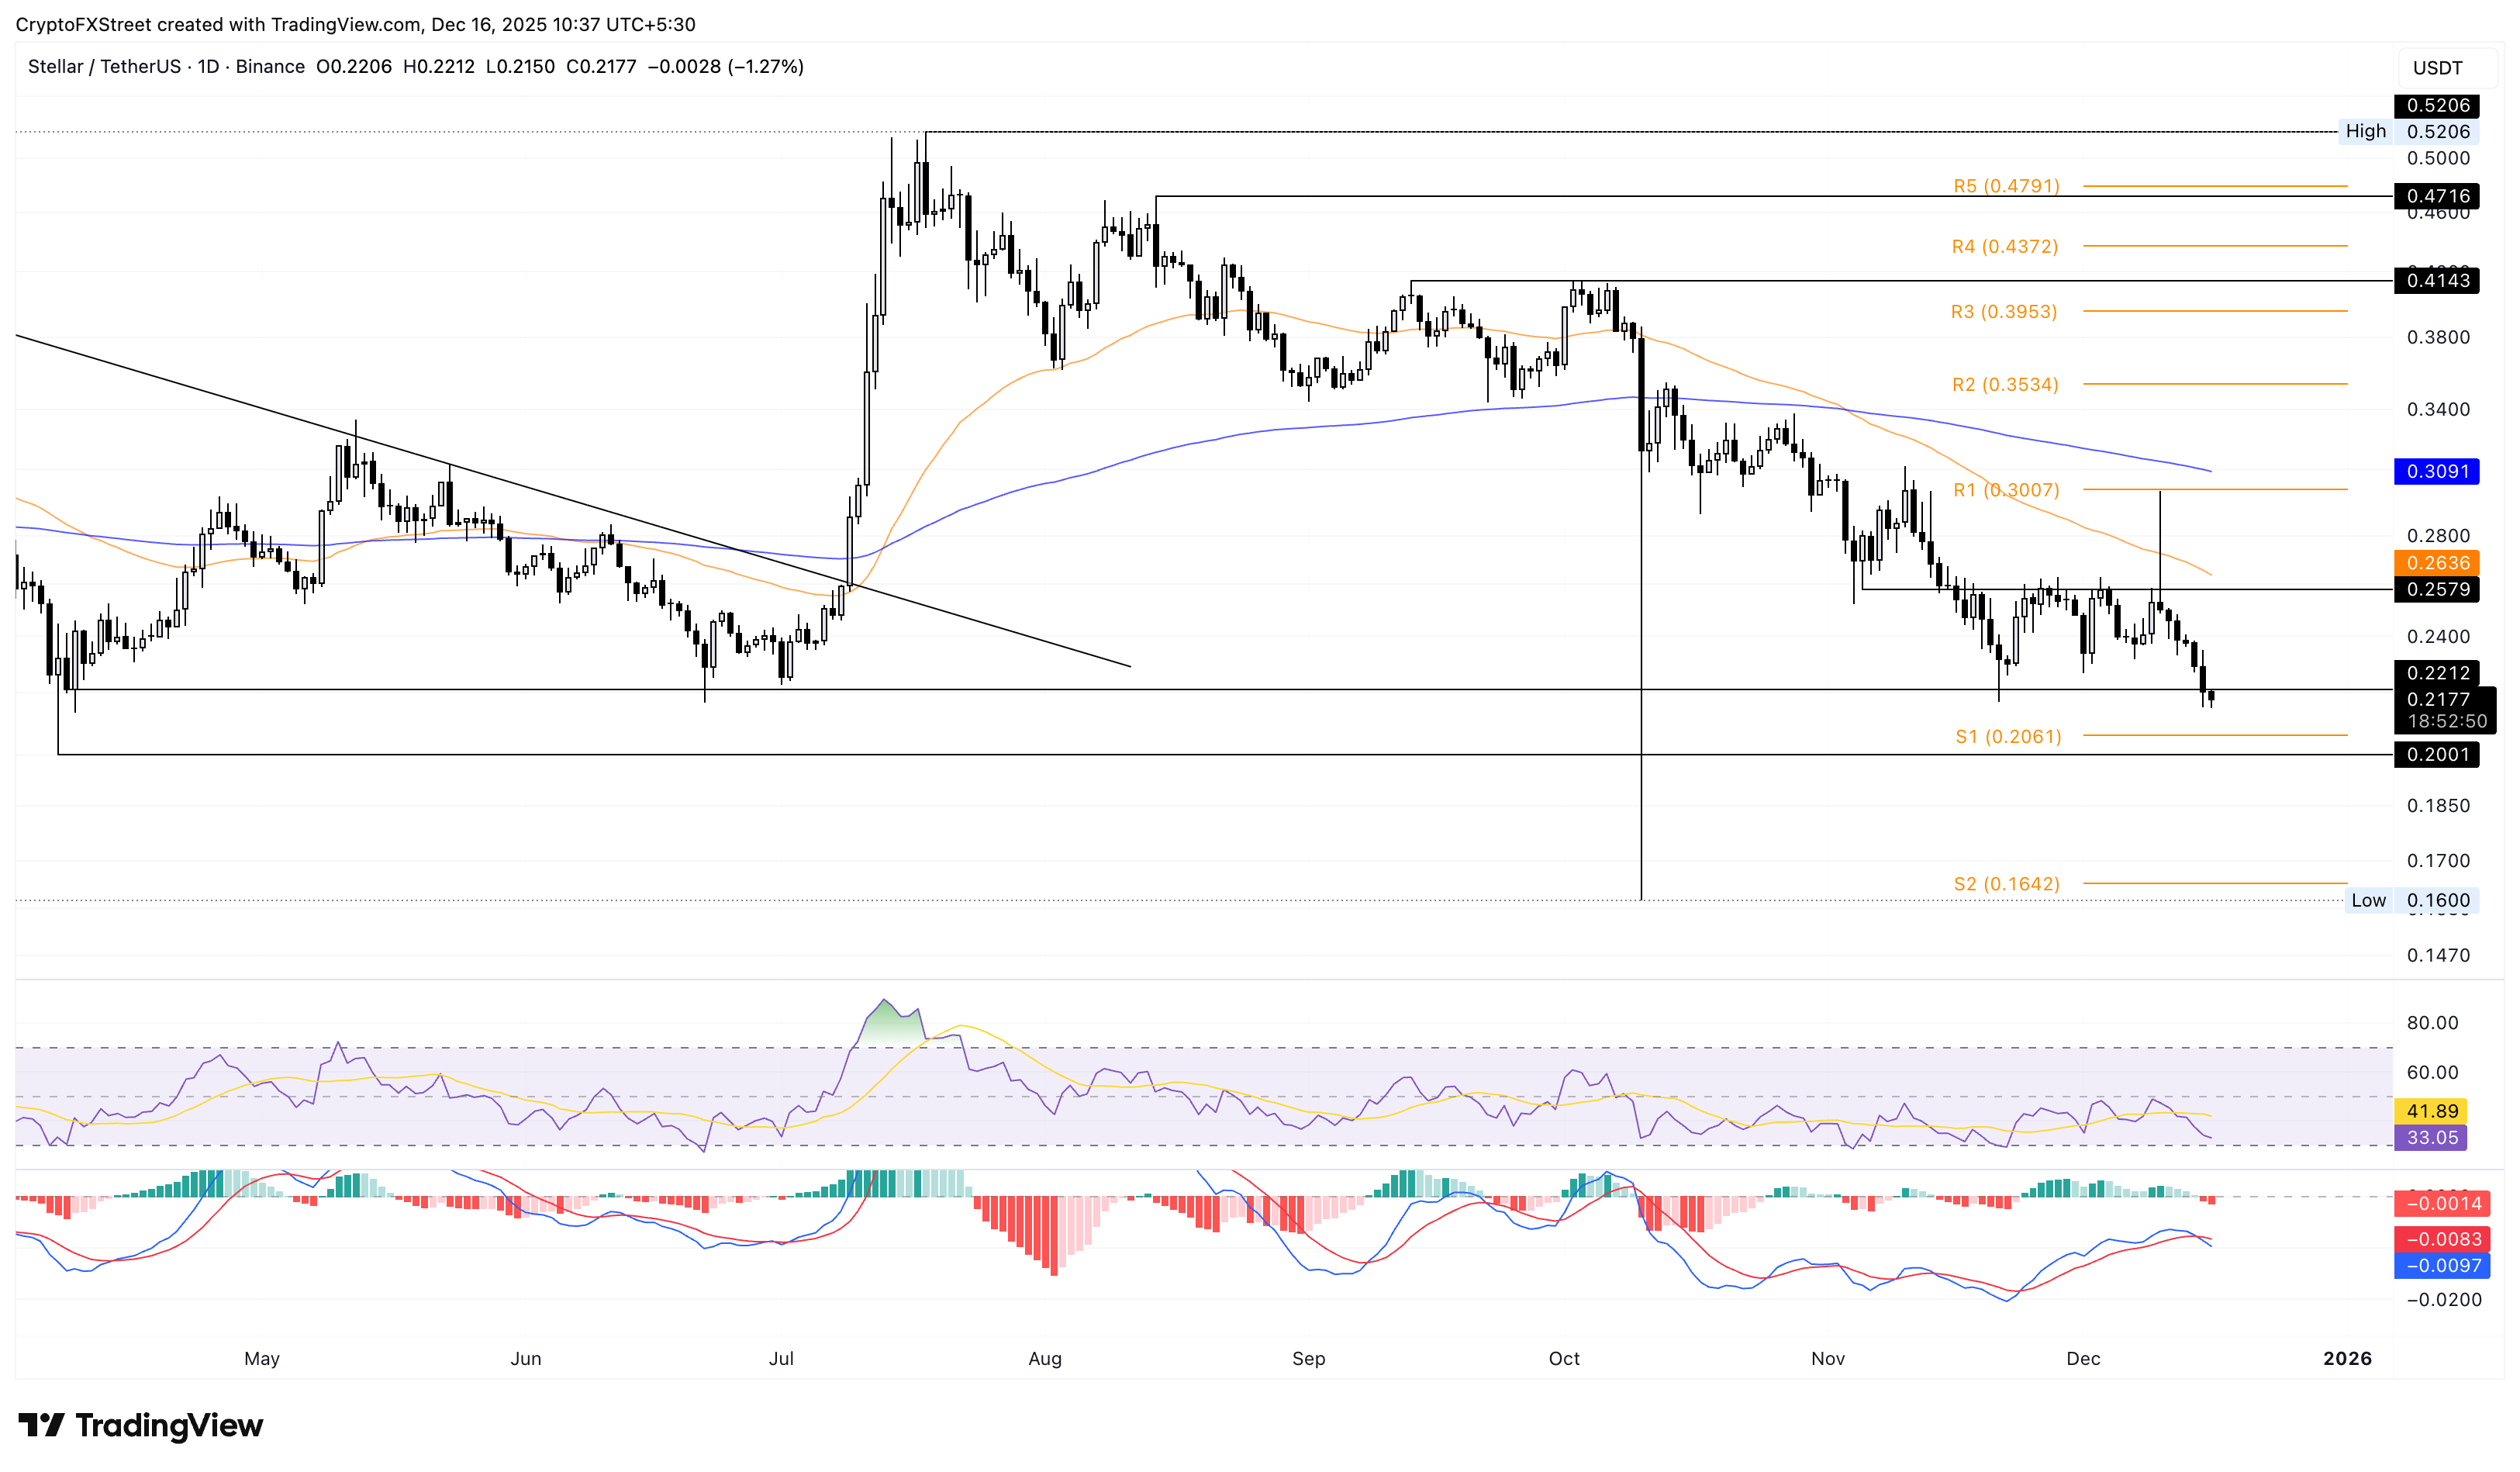
On the upside, a potential rebound in XLM could flip the bearish streak and retest the $0.2579 level marked by the November 5 low, which capped recovery attempts in late November and early December.

FXStreet
100만 명이 넘는 사용자가 FXStreet를 통해 실시간 시장 데이터, 차트 도구, 전문가 인사이트, 포렉스 뉴스를 이용합니다. 포괄적인 경제 캘린더와 교육 웨비나는 트레이더가 정보를 유지하고 신중한 결정을 내리도록 돕습니다. FXStreet는 바르셀로나 본사와 전 세계 지역에 걸쳐 약 60명의 팀으로 구성되어 있습니다.
Read More


