
Trade The World
Stellar Price Forecast: XLM flashes bullish potential as accumulation zone emerges
작성자 Manish Chhetri
게시일: 31 Jul 2025 | 수정일: 31 Jul 2025


POPULAR ARTICLES

Stellar (XLM) price trades within a bullish pennant pattern at $0.42 at the time of writing on Thursday, hinting at a potential bullish continuation.
- Stellar price trades inside a bullish pennant pattern, gearing up for an upward trend continuation.
- Sideline investors looking to accumulate XLM could do so between $0.40 and $0.36.
- Derivatives and on-chain data suggest a potential bullish continuation, given positive funding rates and declining retail speculation.
Stellar (XLM) price trades within a bullish pennant pattern at $0.42 at the time of writing on Thursday, hinting at a potential bullish continuation. On-chain and derivatives data suggest sidelined retail traders may be creating room for smart money accumulation, while positive funding rates and rising bullish bets add to the bullish case.
Stellar’s derivatives and on-chain data suggest a potential reversal
Stellar’s derivatives data hints at a potential reversal. According to Coinglass, the long-to-short ratio for XLM has reached 1.14 on Thursday, the highest level in over a month. The ratio above one suggests that more traders are betting on XLM’s price to rally.
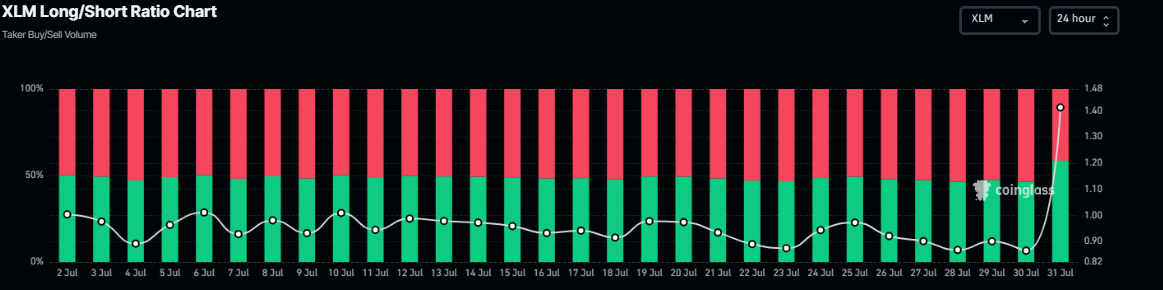
XLM long-to-short ratio chart. Source: Coinglass
XLM’s funding rate data is positive and reads 0.0085% on Thursday, indicating that longs are paying shorts. Generally, a positive rate (longs pay shorts) indicates bullish sentiment, while negative numbers (shorts pay longs) indicate bearishness.
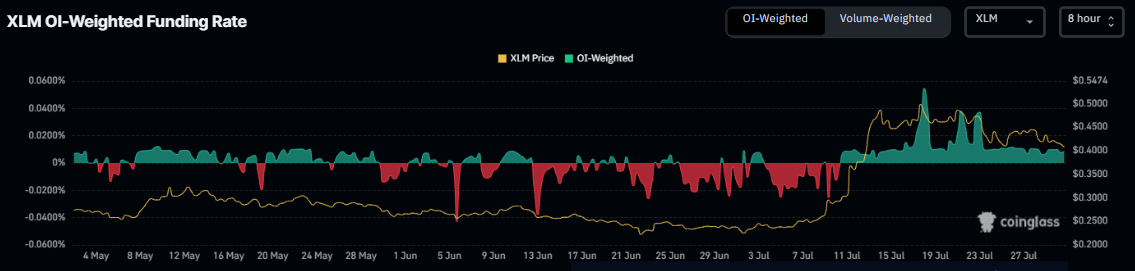
XLM funding rate chart. Source: Coinglass
CryptoQuant Spot Retail Activity Through Trading Frequency Surge data shows that XLM currently has less retail activity. Historically, when XLM had little retail speculation, it cleared the way for sustained, trend-based movements, boosting its prices.
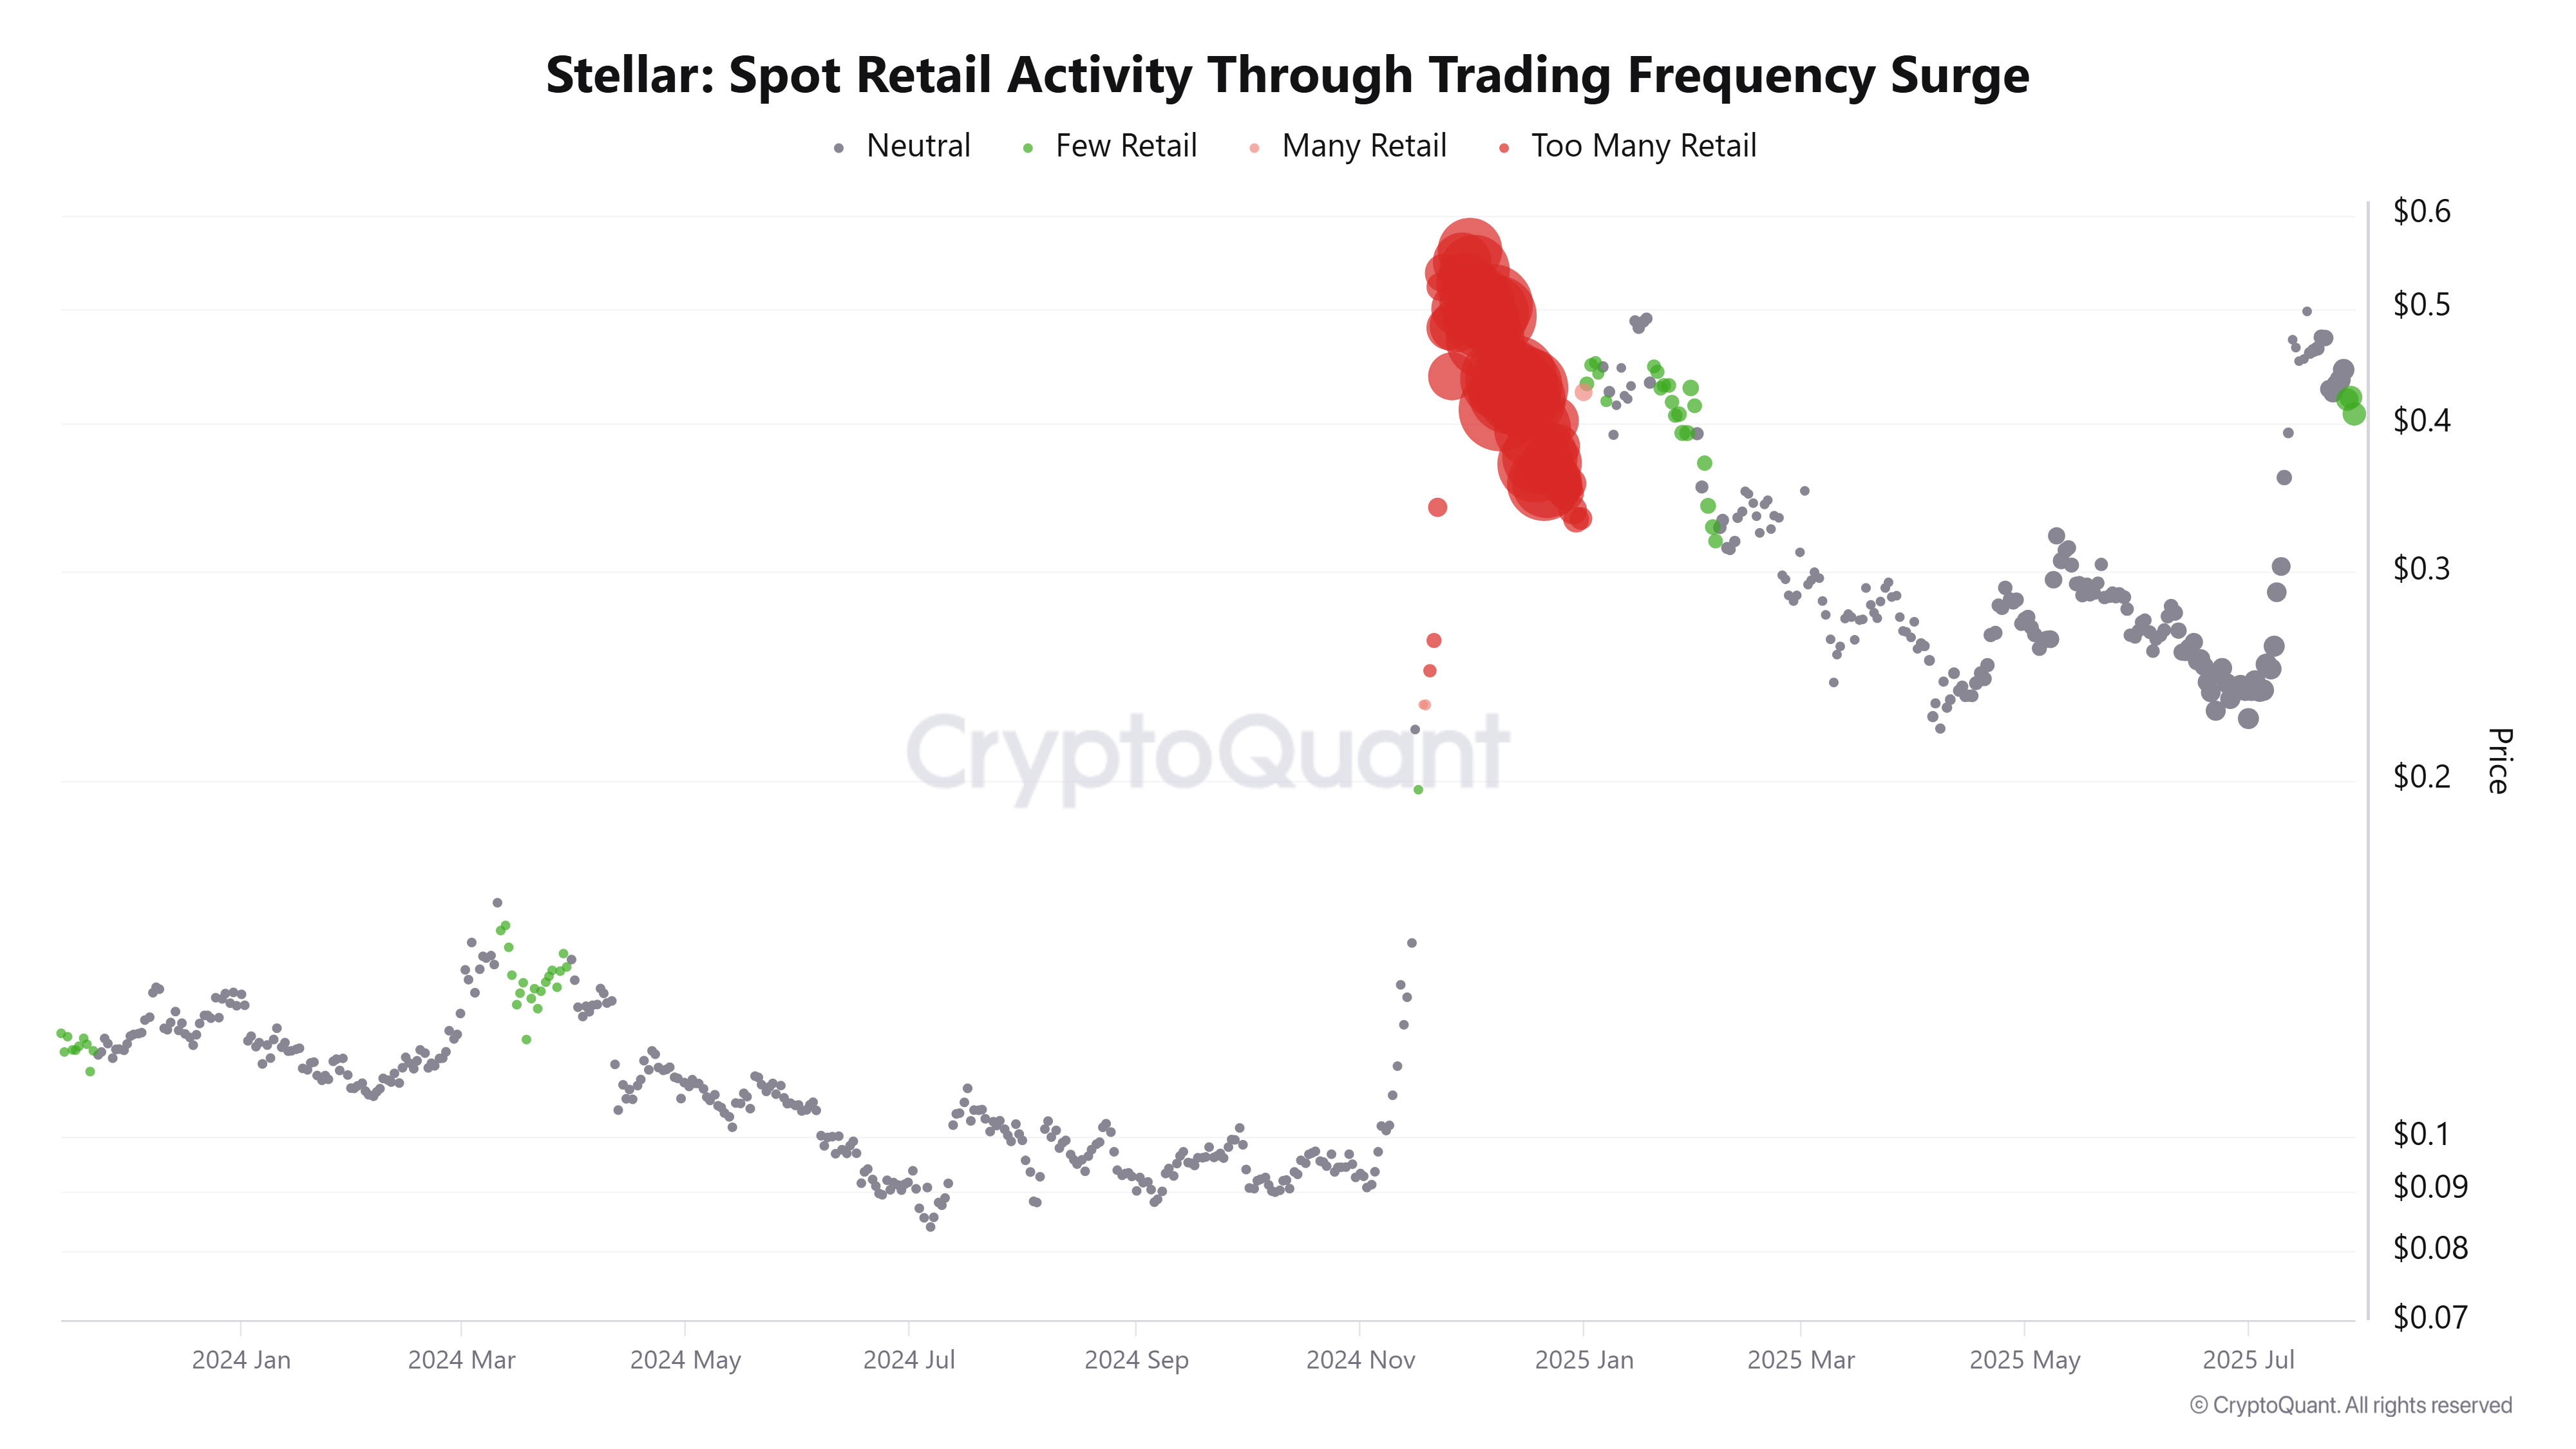
XLM Spot Retail Activity Through Trading Frequency Surge chart. Source: CryptoQuant
Stellar Price Forecast: XLM shows a bullish pennant pattern
Stellar price trades inside a bullish pennant pattern formed by connecting two trendlines, joining the highs and lows. This pattern favours the bull as it is formed after a massive upward price trend, and a breakout indicates continuation of the upward momentum. At the time of writing on Thursday, XLM trades around $0.42 within the pattern.
Sideline investors looking to accumulate XLM could do so between $0.40 and $0.36, support ranges, with a tighter stop loss below its 50-day Exponential Moving Average at $0.35.
If XLM breaks above this pennant pattern, it could extend the rally toward its July 18 high at $0.52. A successful close above this level could extend gains towards its November high of $0.63.
The Relative Strength Index (RSI) on the daily chart reads 54, after bouncing off its neutral level of 50 and pointing upwards, indicating bullish momentum is gaining traction.
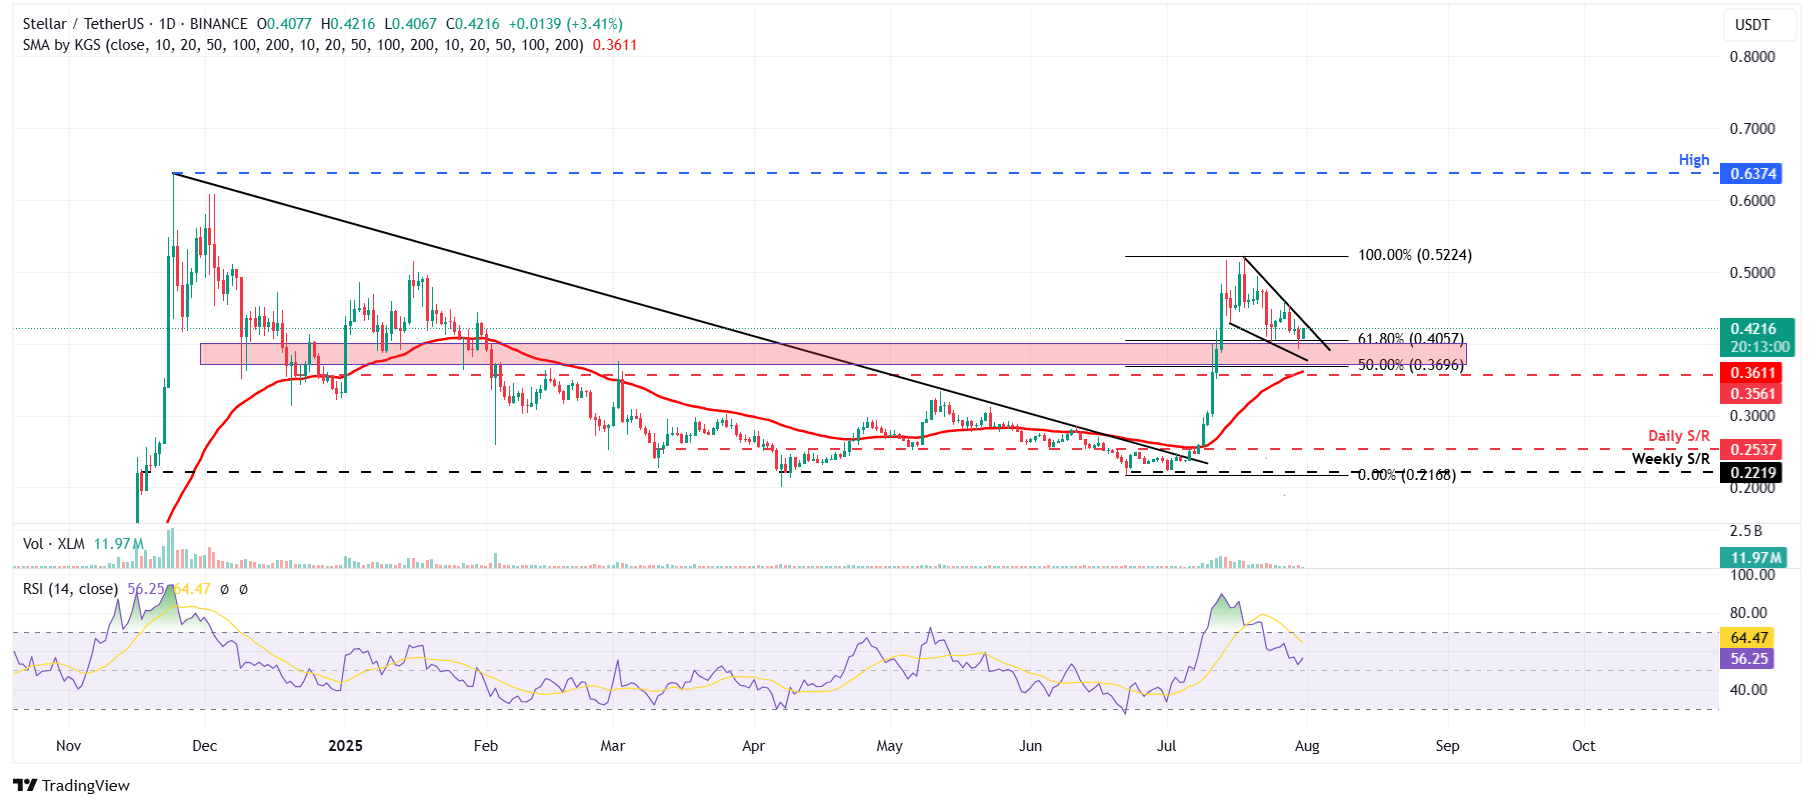
XLM/USDT daily chart
However, if XLM faces a correction, it could extend the decline toward its 50-day EMA at $0.35.

FXStreet
100만 명이 넘는 사용자가 FXStreet를 통해 실시간 시장 데이터, 차트 도구, 전문가 인사이트, 포렉스 뉴스를 이용합니다. 포괄적인 경제 캘린더와 교육 웨비나는 트레이더가 정보를 유지하고 신중한 결정을 내리도록 돕습니다. FXStreet는 바르셀로나 본사와 전 세계 지역에 걸쳐 약 60명의 팀으로 구성되어 있습니다.
Read More


