
Trade The World
Sui Price Forecast: Extends rally with bullish indicators targeting $2.34
작성자 Manish Chhetri
게시일: 6 Jan 2026 | 수정일: 6 Jan 2026


POPULAR ARTICLES

Sui (SUI) price trades above $1.95 near a two-month high at the time of writing on Tuesday, extending its rally after printing six consecutive green candlesticks.
- Sui price extends gains above $1.95 on Tuesday, printing six consecutive green candlesticks.
- On-chain and derivatives data support a positive outlook, with rising trading volume, TVL, and open interest.
- The technical outlook suggests further gains, with bulls aiming for levels above $2.34.
Sui (SUI) price trades above $1.95 near a two-month high at the time of writing on Tuesday, extending its rally after printing six consecutive green candlesticks. Positive on-chain and derivatives data further support the bullish momentum, while technical analysis suggests further gains, targeting the immediate resistance at $2.34.
On-chain and derivatives data suggest growing market participation
Santiment data indicates that the Sui ecosystem’s trading volume (the aggregate trading volume generated by all exchange applications on the chain) reached $967.43 million on Tuesday, the highest since early December, and has been steadily rising since then. This volume rise indicates a surge in traders’ interest and liquidity in Sui, boosting its bullish outlook.
 [07-1767669449622-1767669449624.35.14, 06 Jan, 2026].png)
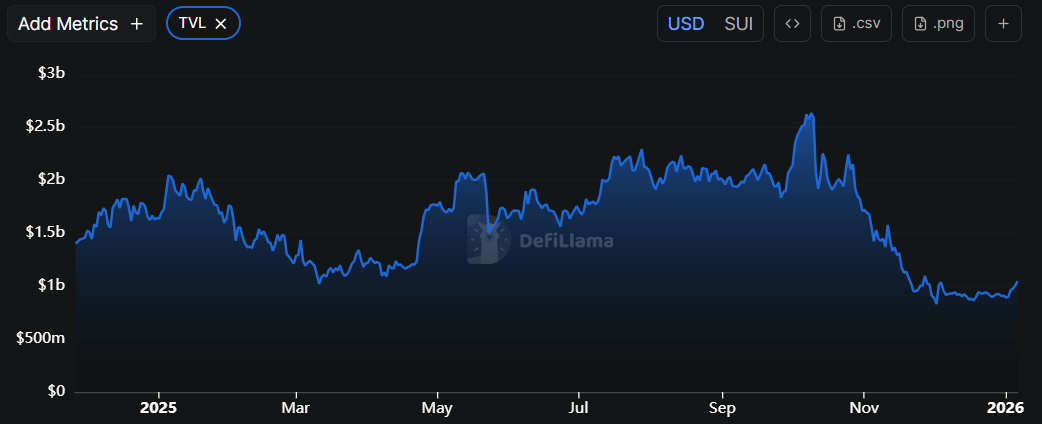
Data from crypto intelligence tracker DefiLlama shows that Sui’s Total Value Locked (TVL) has been steadily rising since the end of December, reaching $1.04 billion on Tuesday. This increase in TVL indicates growing activity and interest in Sui’s ecosystem, suggesting that more users are depositing or using assets on SUI-based protocols.
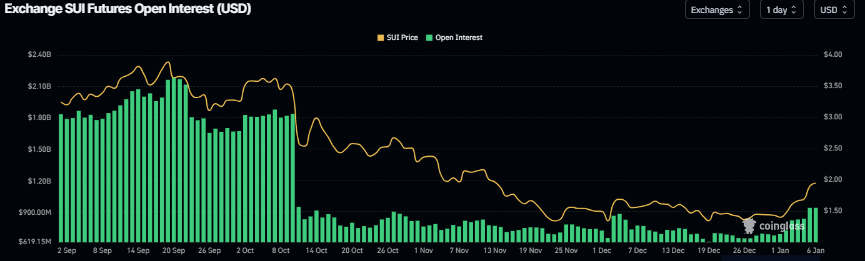
On the derivatives side, CoinGlass’ data shows that SUI futures Open Interest (OI) at exchanges rose to $947.26 million on Tuesday, up from $685 million on Wednesday, the highest level since October 10. An increasing OI represents new or additional money entering the market and new buying, which could fuel the current SUI price rally.
Sui Price Forecast: SUI bulls aiming for levels above $2.34
Sui price broke above the falling wedge pattern (formed by connecting multiple highs and lows since October) on December 26 and rose by more than 35% through Monday. At the time of writing on Tuesday, SUI continues to trade higher above $1.94.
If SUI continues its upward trend, it could extend the rally toward the weekly resistance level at $2.34.
The Relative Strength Index (RSI) on the daily chart is 73, above the overbought threshold, indicating strong bullish momentum. In addition, the Moving Average Convergence Divergence (MACD) indicator shows a bullish crossover and rising green histogram bars above the neutral level, further supporting the bullish outlook.
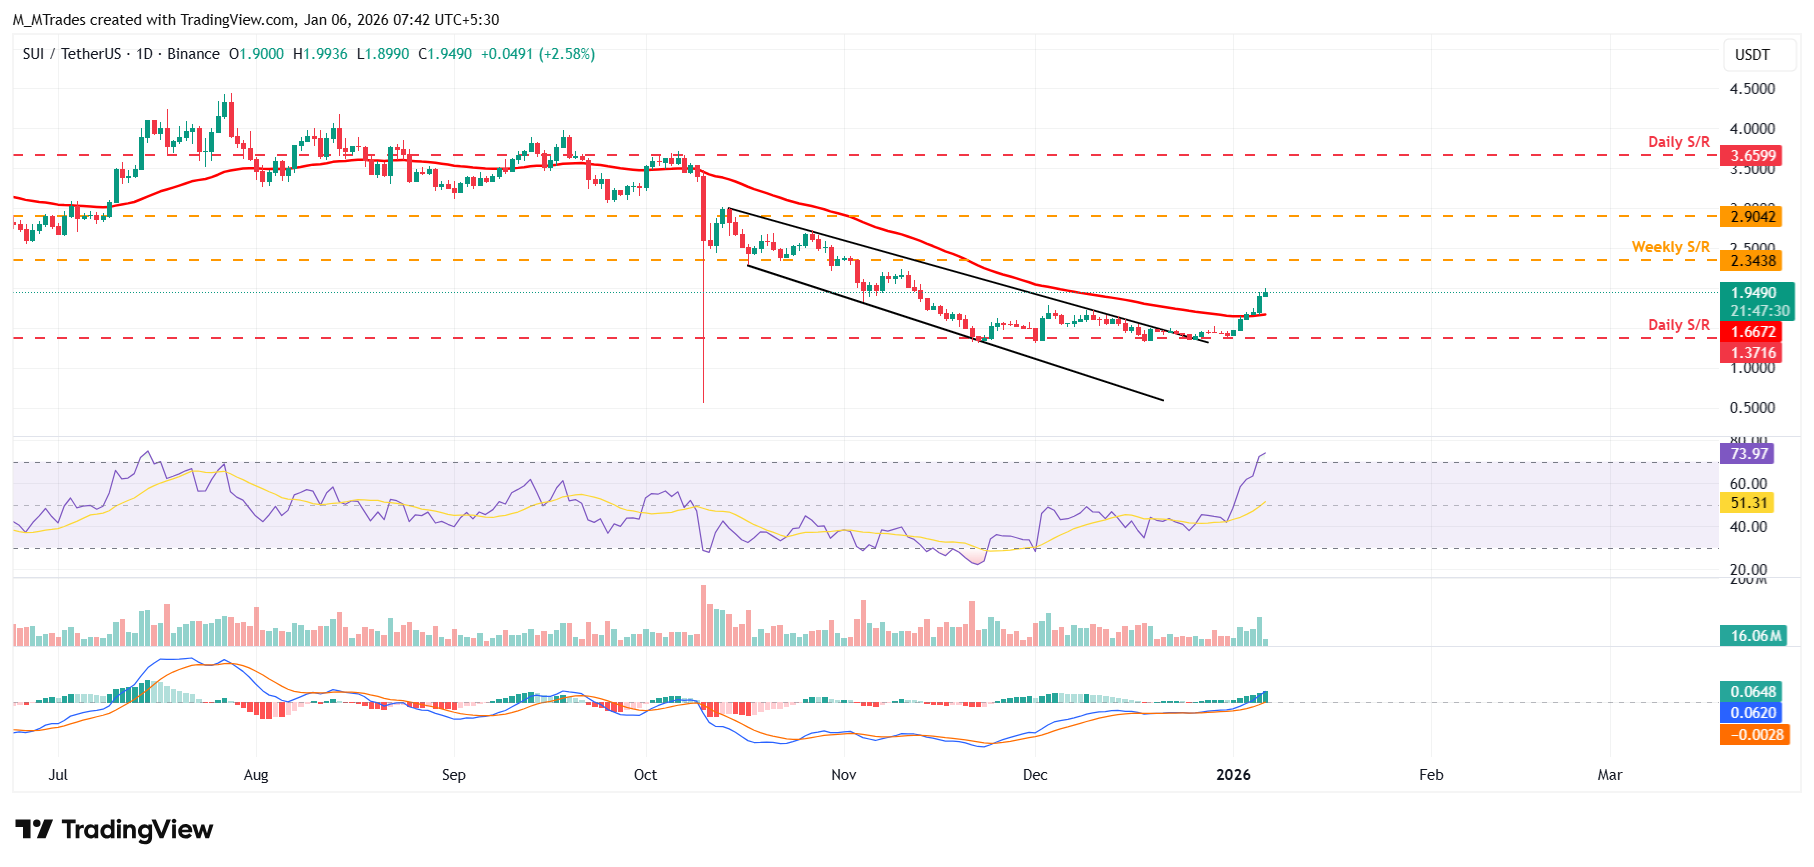
On the other hand, if SUI corrects, it could extend the decline toward the 50-day Exponential Moving Average (EMA) at $1.66.

FXStreet
100만 명이 넘는 사용자가 FXStreet를 통해 실시간 시장 데이터, 차트 도구, 전문가 인사이트, 포렉스 뉴스를 이용합니다. 포괄적인 경제 캘린더와 교육 웨비나는 트레이더가 정보를 유지하고 신중한 결정을 내리도록 돕습니다. FXStreet는 바르셀로나 본사와 전 세계 지역에 걸쳐 약 60명의 팀으로 구성되어 있습니다.
Read More


