
Trade The World
Sui Price Forecast: SUI derivatives and on-chain data hint at a bearish shift
작성자 Manish Chhetri
게시일: 7 Aug 2025 | 수정일: 7 Aug 2025


POPULAR ARTICLES

Sui (SUI) price is showing signs of weakness, trading below $3.5 at the time of writing on Thursday after closing below its ascending trendline.
- Sui price closes below its ascending trendline, signaling a potential shift from bullish to bearish market structure.
- On-chain and derivatives metrics turn negative, with Spot Taker CVD in the red, and short positions hit a one-month high.
- The technical outlook shows weakness in momentum indicators, suggesting a short-term correction.
Sui (SUI) price is showing signs of weakness, trading below $3.5 at the time of writing on Thursday after closing below its ascending trendline. Bearish cues from on-chain and derivatives data, such as negative Spot Taker CVD and a rise in short positions to a one-month high, add weight to the downside outlook. The technical analysis suggests a weakness in momentum, suggesting a short-term correction for SUI.
SUI bearish bets reach a monthly high
Sui derivatives data show a bearish outlook. CoinGlass’s long-to-short ratio reads 0.63 on Thursday, marking the lowest level in over a month. A ratio below one suggests bearish sentiment in the market as traders are betting that Sui’s price will fall.
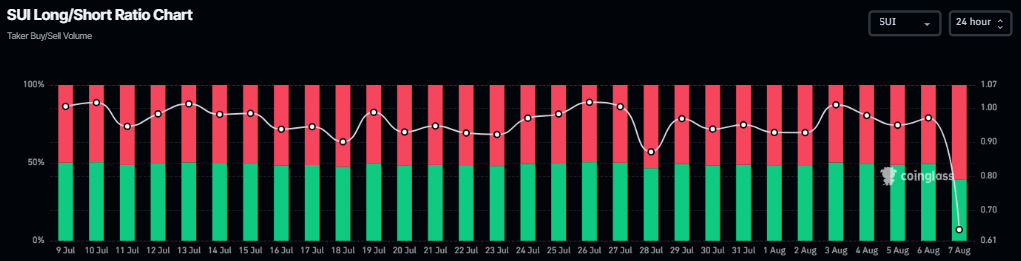
Sui long-to-short ratio chart. Source: CoinGlass
Looking at the on-chain data adds more credence to the rising selling pressure on SUI. CryptoQuant’s Taker CVD (Cumulative Volume Delta) for SUI is negative, and its value has been steadily decreasing since mid-July.
This metric measures the cumulative difference between market buy and sell volumes over three months. When the three-month CVD is positive and increasing, it suggests the Taker Buy Dominant Phase. A negative and decreasing value, as it is currently happening, indicates the Taker Sell Dominant Phase.
 (1)-1754531884980-1754531884981.png)
Sui Spot Taker CVD chart. Source: CryptoQuant
Sui Price Forecast: SUI momentum indicators show weakness
Sui price closed below its ascending trendline (drawn by joining multiple lows since June 22) last week on Friday and declined nearly 4% the next day. However, SUI recovered after finding support around the 200-day Exponential Moving Average (EMA) at $3.35 on Sunday, retesting its broken trendline the following day. This broken trendline roughly coincides with the daily resistance level at $3.65 and the 61.8% Fibonacci retracement level at $3.62, making it a key resistance zone. On Tuesday, it failed to close above this resistance zone, declined slightly, but found support the next day around its 200-day EMA. At the time of writing on Thursday, it hovers at around $3.50.
If SUI closes below the 200-day EMA at $3.35 on a daily basis, it could extend the correction toward its next daily support at $2.90.
The Relative Strength Index (RSI) indicator and Awesome Oscillator (AO) on the daily chart are trading below the neutral levels of 50 and zero, respectively. These momentum indicators strongly indicate bearish dominance. The Moving Average Convergence Divergence (MACD) showed a bearish crossover on July 29 that still holds, also indicating bearish momentum.
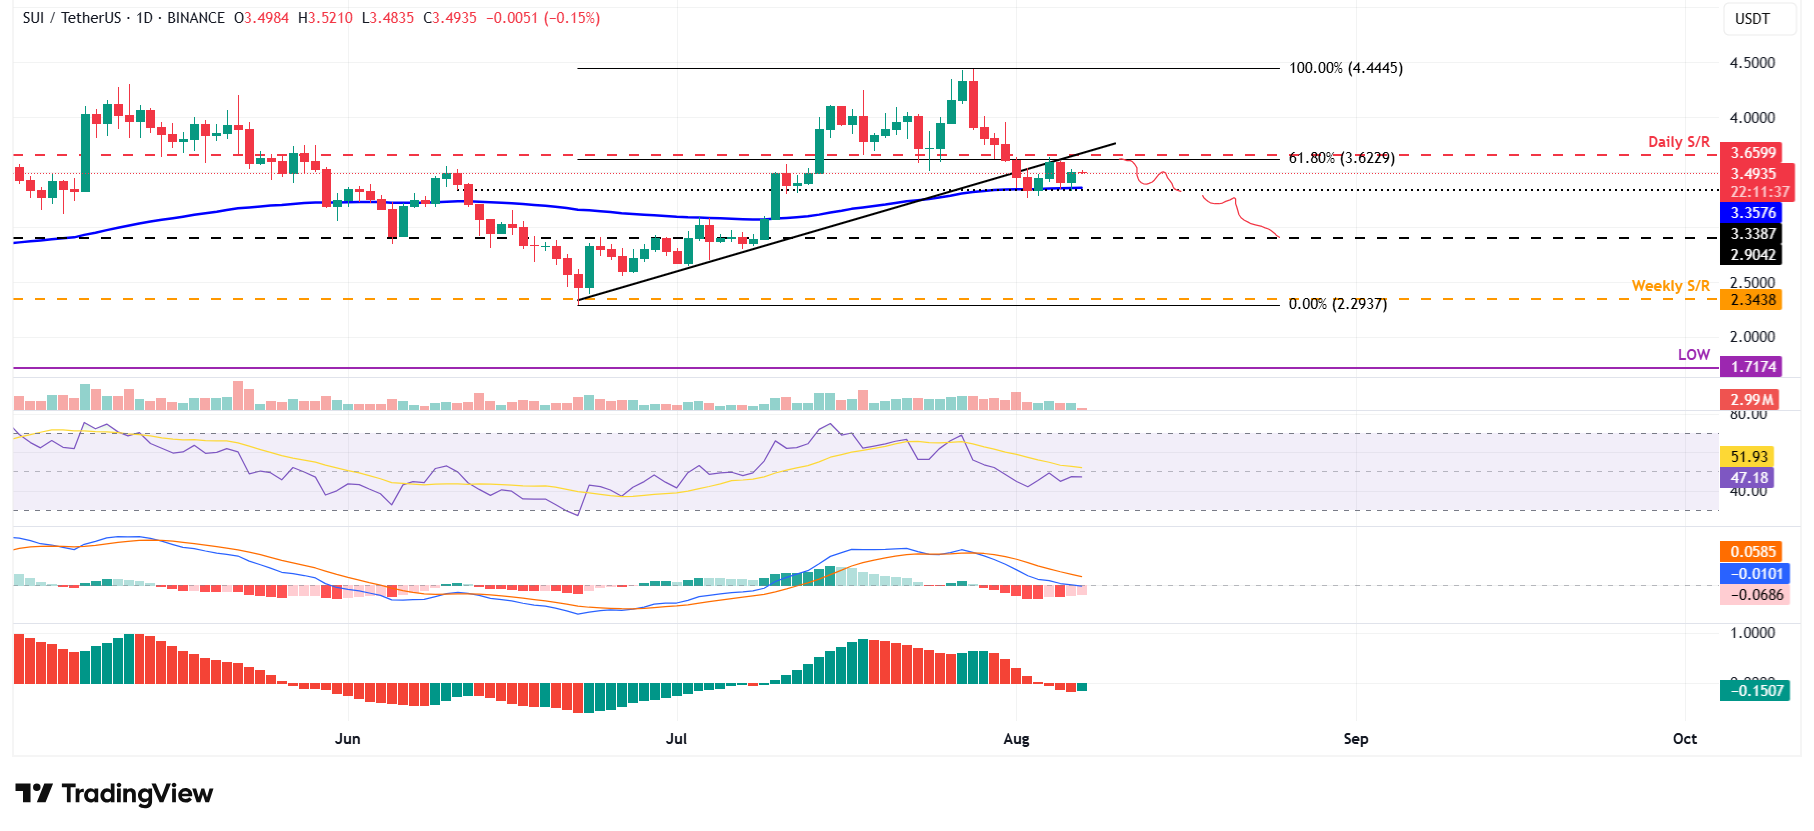
SUI/USDT daily chart
However, if SUI closes above the daily resistance at $3.65, it could extend the rally toward its July 28 high of $4.44.

FXStreet
100만 명이 넘는 사용자가 FXStreet를 통해 실시간 시장 데이터, 차트 도구, 전문가 인사이트, 포렉스 뉴스를 이용합니다. 포괄적인 경제 캘린더와 교육 웨비나는 트레이더가 정보를 유지하고 신중한 결정을 내리도록 돕습니다. FXStreet는 바르셀로나 본사와 전 세계 지역에 걸쳐 약 60명의 팀으로 구성되어 있습니다.
Read More


