


- Terra Classic holds above $0.00004000 on the New Year, following a 12% rise on Wednesday.
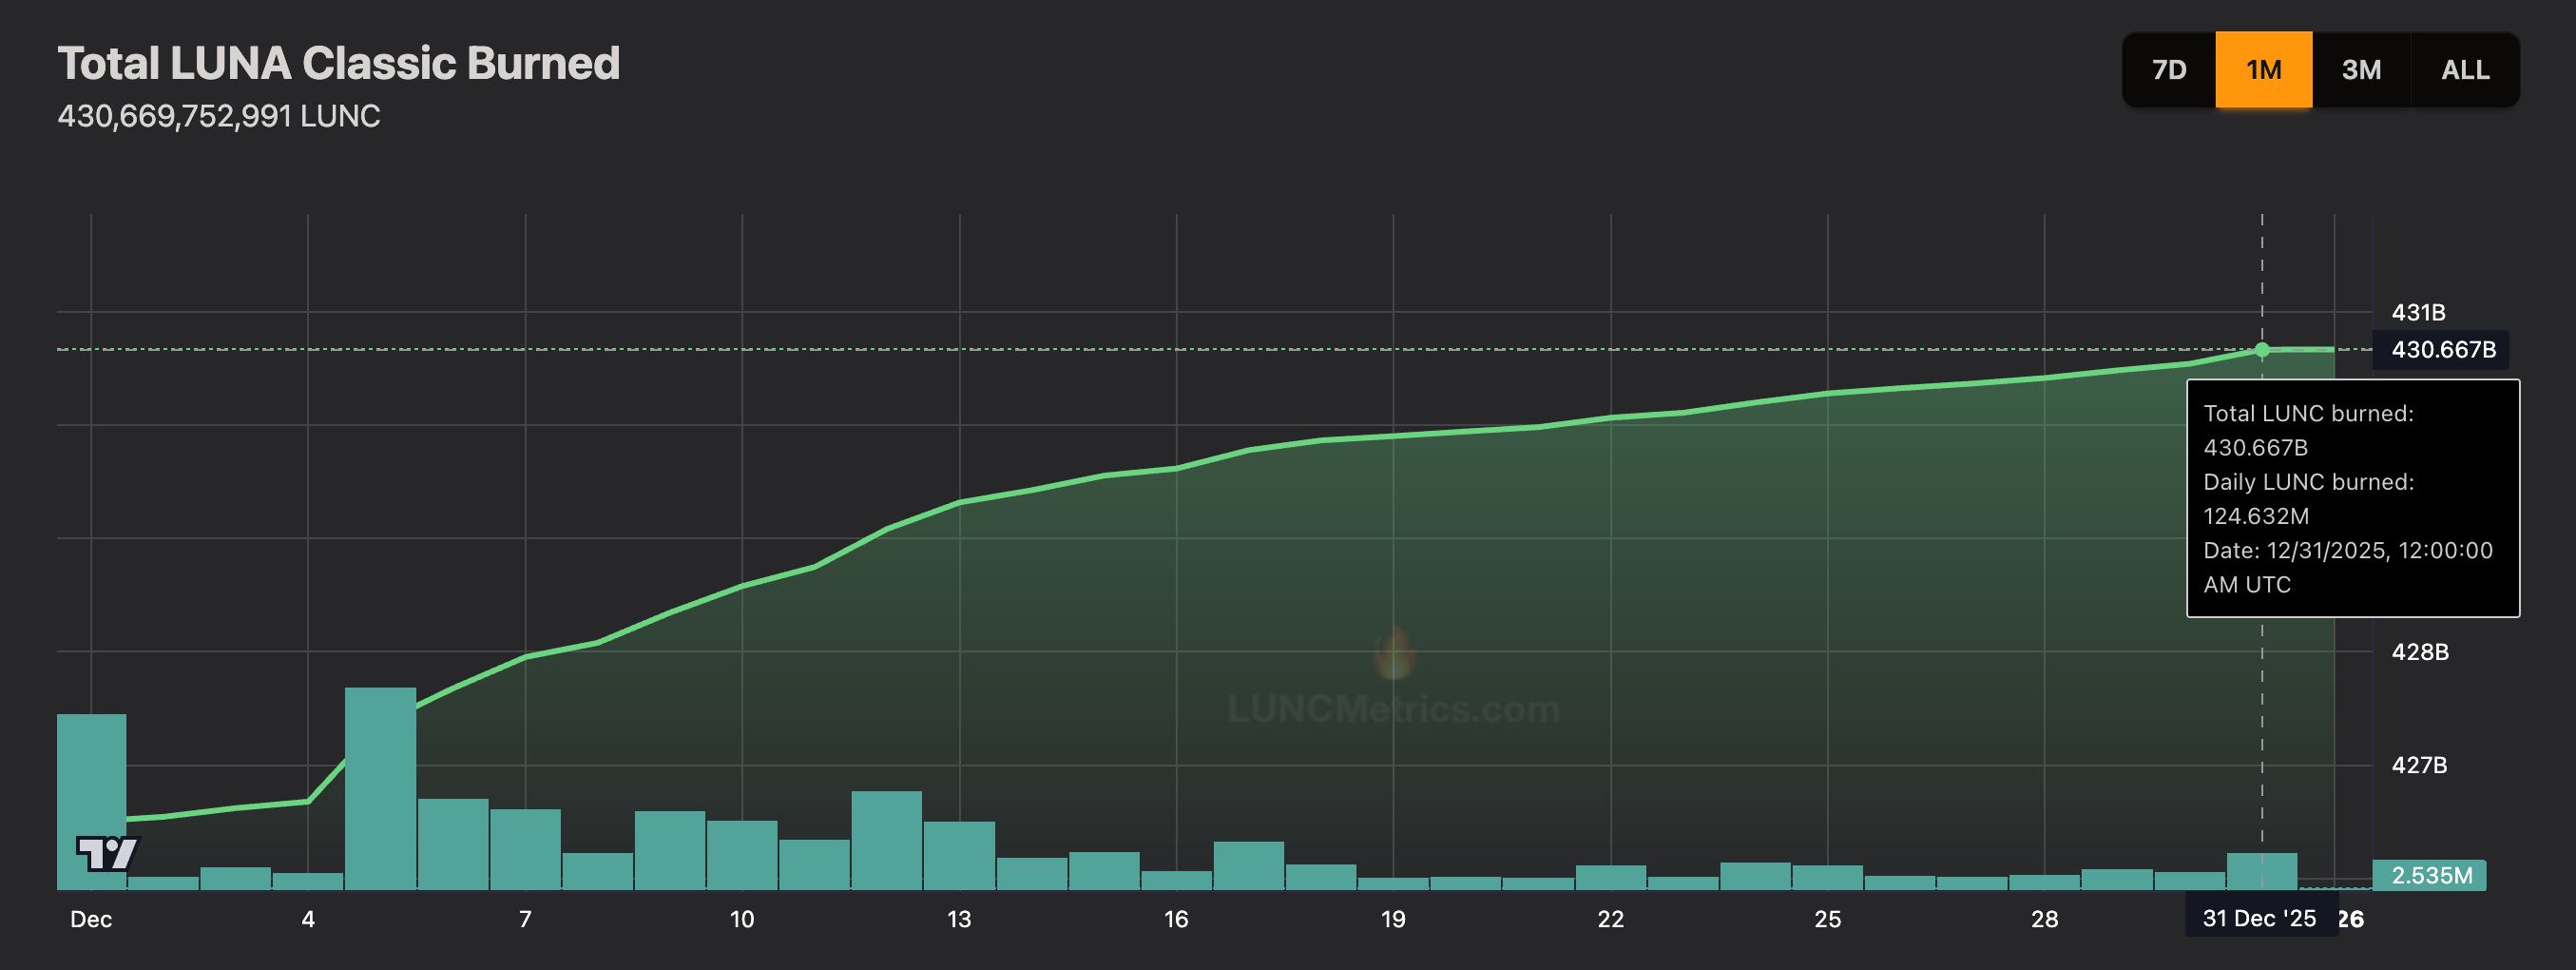
- Over 124 million LUNC tokens were burned on Wednesday, fueling a short-term recovery in Terra Classic.
- The technical outlook remains bearish, as recent LUNC recoveries have been short-lived.
Terra Classic (LUNC) is down 1% at press time on Thursday, taking a breather after Wednesday’s 13% rise. A steady burn of LUNC supply, with over 124 million LUNC tokens wiped out on Wednesday, fueled short-term surges in Terra Classic. However, the technical outlook anticipates the continuation of the prevailing downtrend, given previous short-lived recoveries.
Daily burns pump LUNC prices
LUNCmetrics data shows a sudden increase in the daily burn rate of LUNC tokens, fueling the Terra Classic price surge. Over 124 million LUNC were wiped out on Wednesday, marking the largest daily burn since December 17 and boosting the total to over 430 billion burned tokens. A reduction in supply often leads to a price surge; however, LUNC suffers from a severe oversupply of 6.47 trillion tokens, exerting persistent supply pressure.
The recovery suggests that Do Kwon’s final hearing on a 15-year prison sentence has been priced in alongside the $4 billion lawsuit against Jump Trading for illegally profiting from the $40 billion crash of Terra Labs.
Technical outlook: Could LUNC sustain the recovery?
Terra Classic’s 13% surge on Wednesday marked an end to a three-day decline and crossed above the 50-day Exponential Moving Average (EMA) $0.00004055. At the time of writing, LUNC drops by 1% on Thursday, struggling to surpass the 100-day EMA at $0.00004309.
If LUNC exceeds this moving average, it could reach the 200-day EMA at $0.004963 near the R1 Pivot Point at $0.00004945.
The technical indicators on the daily chart remain neutral, with a potential bullish shift incoming. The Relative Strength Index (RSI) at 51 hovers near the midline, flashing a neutral stance.
At the same time, the Moving Average Convergence Divergence (MACD) approaches the signal line as bearish momentum wanes. A potential crossover could trigger a buy signal and renewed bullish momentum.
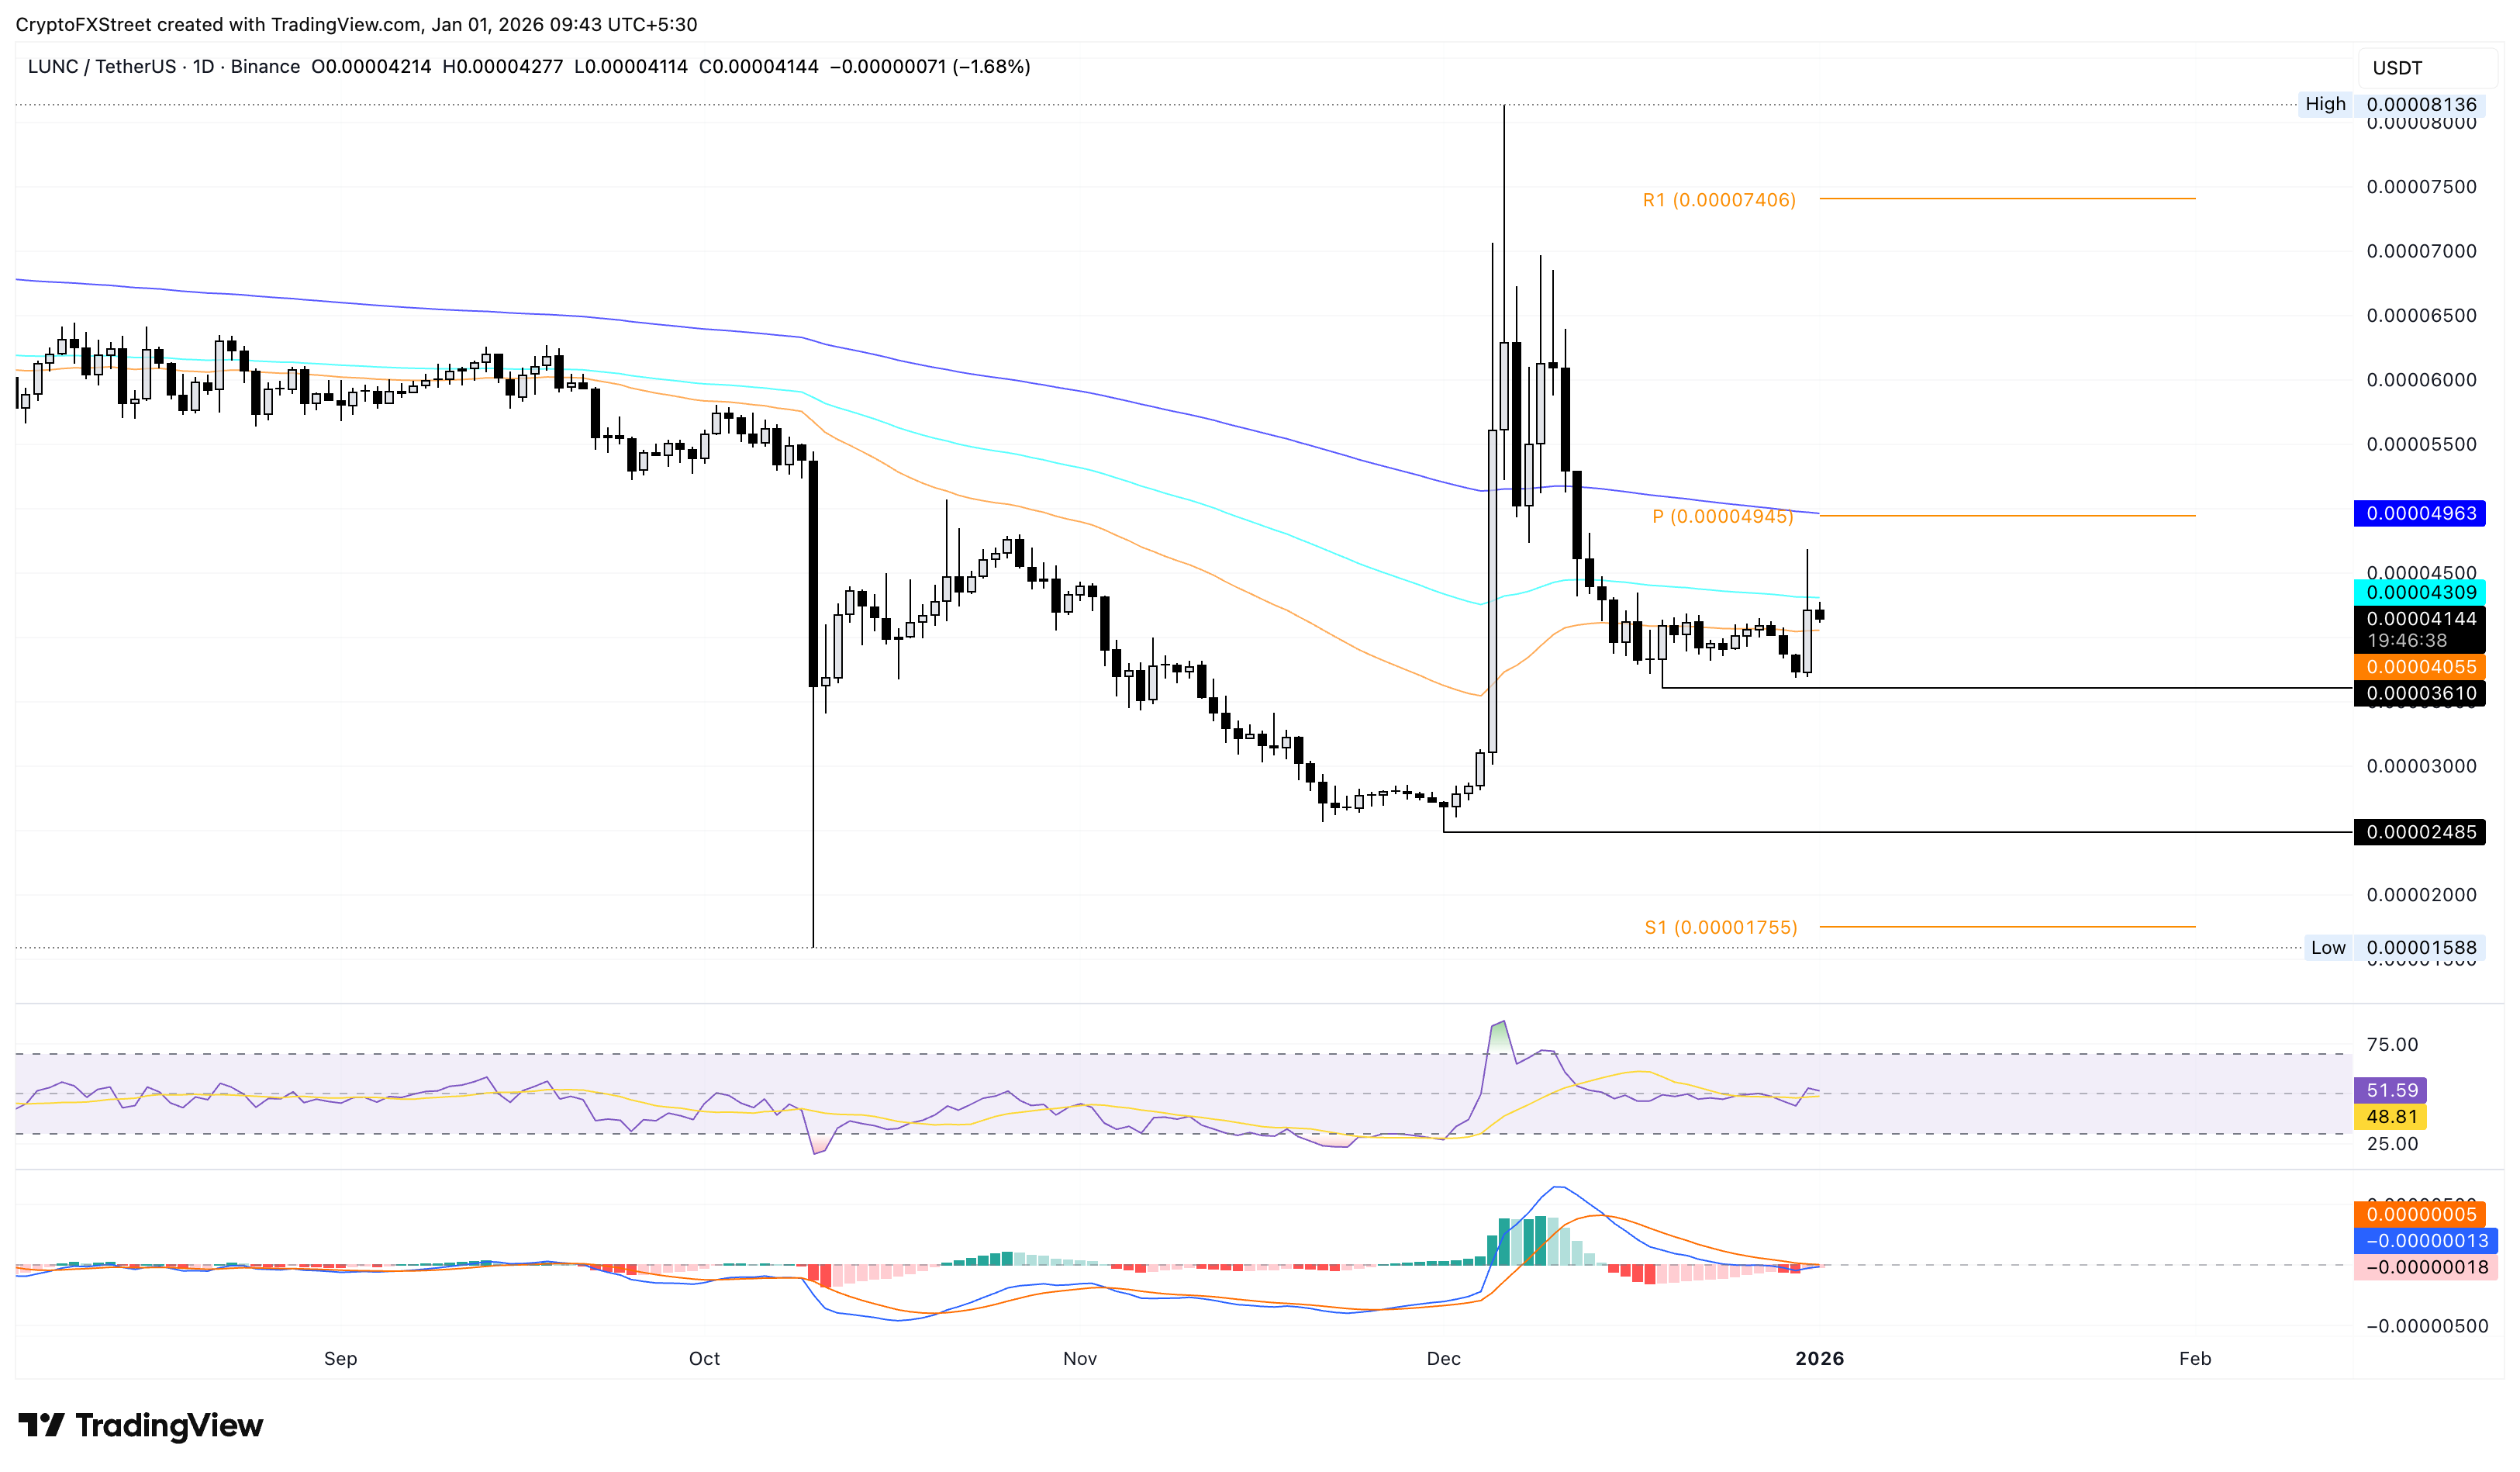
If LUNC drops below $0.00004055, it could threaten the December 19 low at $0.00003610.


