
Trade The World
Top 3 Price Prediction: Bitcoin, Ethereum, Ripple – BTC, ETH, and XRP could correct further on fading bullish momentum
작성자 Manish Chhetri
게시일: 25 Jul 2025 | 수정일: 25 Jul 2025


POPULAR ARTICLES

Bitcoin (BTC) price continues to trade within a tight consolidation range on Friday, suggesting a pause in bullish momentum. Meanwhile, Ethereum (ETH) and Ripple (XRP) have slid nearly 3% and 10%, respectively, so far this week.
- Bitcoin price has been consolidating within the $116,000 to $120,000 range for the last ten days.
- Ethereum price hovers around $3,670 on Friday, after rebounding from the key $3,500 level the previous day.
- Ripple’s XRP continues its decline, trading below $3.15, falling nearly 10% so far this week.
Bitcoin (BTC) price continues to trade within a tight consolidation range on Friday, suggesting a pause in bullish momentum. Meanwhile, Ethereum (ETH) and Ripple (XRP) have slid nearly 3% and 10%, respectively, so far this week. Traders should be cautious as the momentum indicators of these cryptocurrencies show signs of fading bullish momentum.
Bitcoin consolidates between $116,000 and $120,000 range
Bitcoin price has been consolidating in the $116,000 to $120,000 range for the last 10 days, following a new all-time high of $123,218 reached on June 14. At the time of writing on Friday, it trades slightly down, nearing its lower boundary of consolidation at $116,000.
If BTC falls below $116,000 on a daily basis, it could extend the decline to retest the 50-day Exponential Moving Average (EMA) at $111,458.
The Relative Strength Index (RSI) on the daily chart reads 55, pointing downward after being rejected from its overbought condition on Tuesday, indicating fading bullish momentum. Additionally, the Moving Average Convergence Divergence (MACD) also showed a bearish crossover on Wednesday, giving sell signals and indicating a bearish momentum.
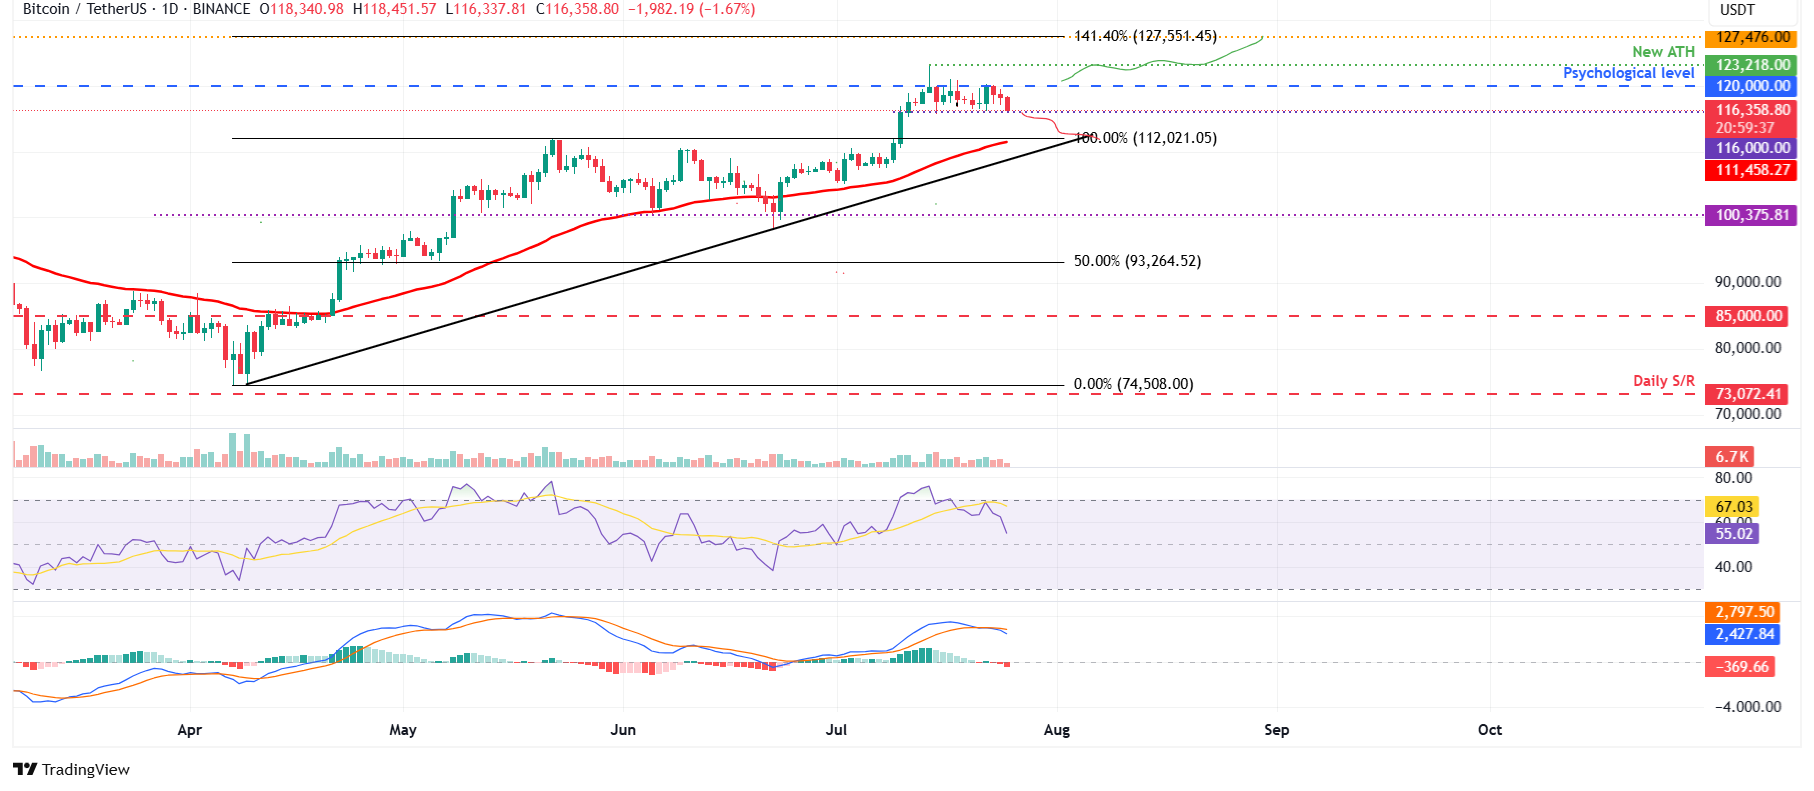
BTC/USDT daily chart
On the contrary, if BTC closes above the upper boundary of the consolidation range at $120,000 on a daily basis, it could extend the recovery toward the fresh all-time high at $123,218.
Ethereum shows early signs of weakness
Ethereum's price failed to find support around the daily level of $3,730 on Wednesday and declined by 3.15%. However, the next day, it recovered most of its losses after bouncing from its $3,500 psychological level. At the time of writing on Friday, it trades down, facing rejection from its daily level of $3,730.
If ETH closes below the $3,500 level on a daily basis, it could extend the decline to retest its key psychological level of $3,000.
The RSI on the daily chart reads 72, pointing downwards, from its extreme overbought conditions, indicating fading bullish momentum. Moreover, its MACD indicator is converging closer together, and the green histogram bars are also falling, further indicating fading bullish momentum.
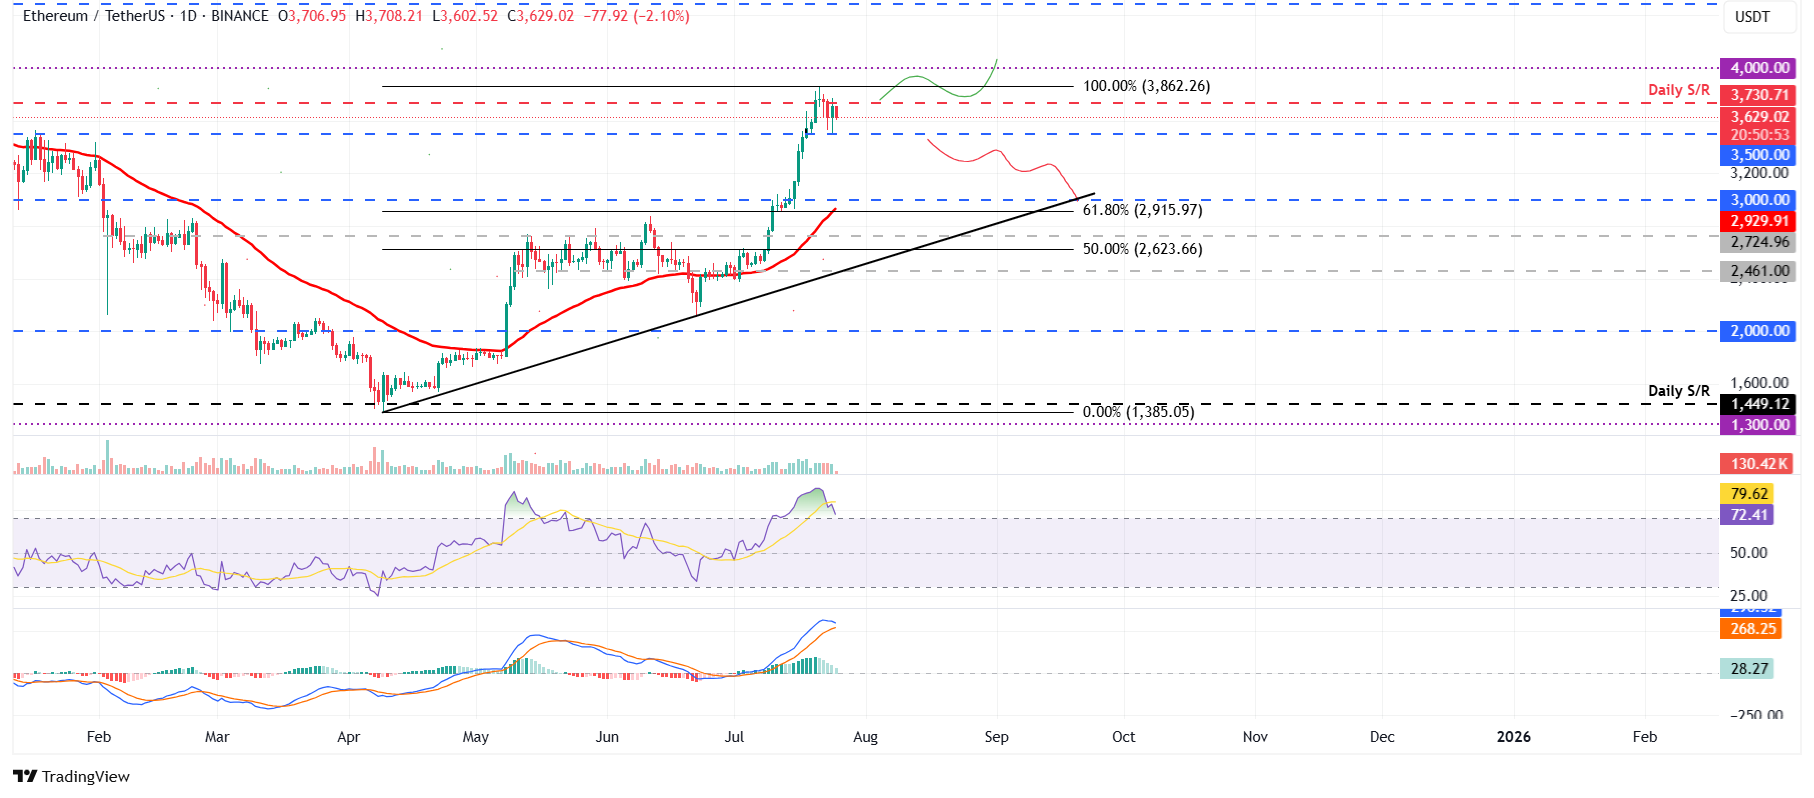
ETH/USDT daily chart
However, if the daily level at $3,500 holds as support and ETH closes above $3,730 on a daily basis, it could extend the rally toward its next key level at $4,000.
XRP shows bearish conditions on MACD indicator
XRP price reached a new all-time high of $3.66 last Friday and then declined slightly, finding support around the daily level of $3.40 before recovering by Tuesday. However, on Wednesday, it fell sharply by 10.33% closing below daily support at $3.40 and retesting its 61.8% Fibonacci level at $2.99 the next day. At the time of writing on Friday, it continues to trade down at $3.08.
If XRP closes below the $2.99 support level, it could extend the decline toward its next daily support at $2.72.
The RSI on the daily chart reads 58 after falling sharply from its overbought condition this week, indicating a fading bullish momentum. Additionally, the MACD showed a bearish crossover on Wednesday, giving sell signals and indicating a bearish momentum.
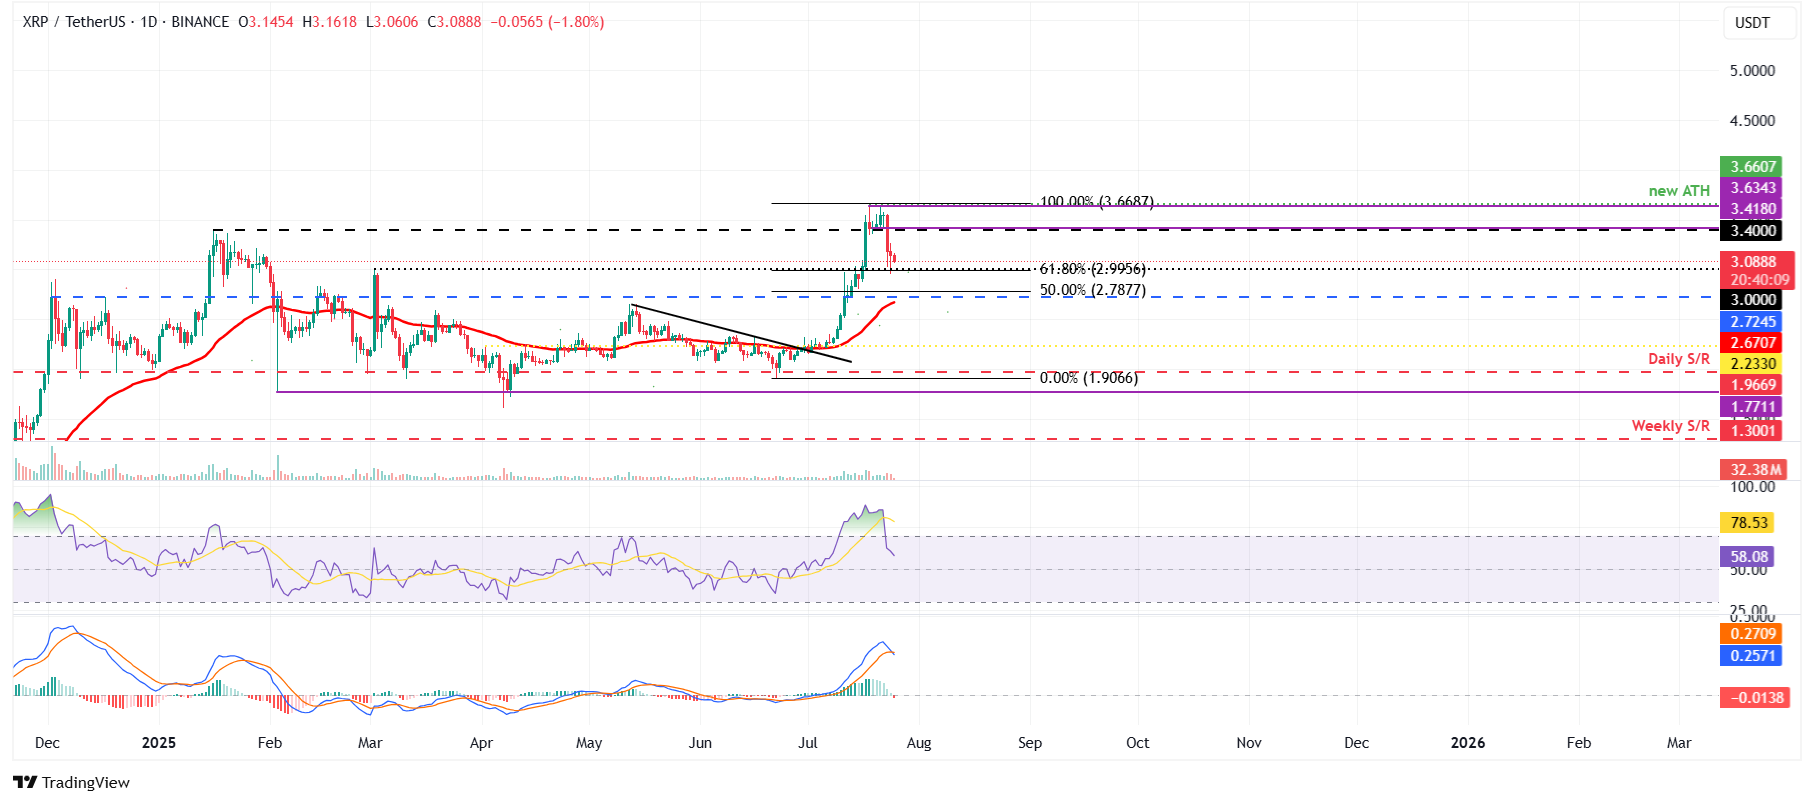
XRP/USDT daily chart
Conversely, if XRP recovers, it could extend the recovery toward its daily resistance level at $3.40.
Cryptocurrency metrics FAQs
The developer or creator of each cryptocurrency decides on the total number of tokens that can be minted or issued. Only a certain number of these assets can be minted by mining, staking or other mechanisms. This is defined by the algorithm of the underlying blockchain technology. On the other hand, circulating supply can also be decreased via actions such as burning tokens, or mistakenly sending assets to addresses of other incompatible blockchains.
Market capitalization is the result of multiplying the circulating supply of a certain asset by the asset’s current market value.
Trading volume refers to the total number of tokens for a specific asset that has been transacted or exchanged between buyers and sellers within set trading hours, for example, 24 hours. It is used to gauge market sentiment, this metric combines all volumes on centralized exchanges and decentralized exchanges. Increasing trading volume often denotes the demand for a certain asset as more people are buying and selling the cryptocurrency.
Funding rates are a concept designed to encourage traders to take positions and ensure perpetual contract prices match spot markets. It defines a mechanism by exchanges to ensure that future prices and index prices periodic payments regularly converge. When the funding rate is positive, the price of the perpetual contract is higher than the mark price. This means traders who are bullish and have opened long positions pay traders who are in short positions. On the other hand, a negative funding rate means perpetual prices are below the mark price, and hence traders with short positions pay traders who have opened long positions.

FXStreet
100만 명이 넘는 사용자가 FXStreet를 통해 실시간 시장 데이터, 차트 도구, 전문가 인사이트, 포렉스 뉴스를 이용합니다. 포괄적인 경제 캘린더와 교육 웨비나는 트레이더가 정보를 유지하고 신중한 결정을 내리도록 돕습니다. FXStreet는 바르셀로나 본사와 전 세계 지역에 걸쳐 약 60명의 팀으로 구성되어 있습니다.
Read More


