
Trade The World
Top 3 Price Prediction: Bitcoin, Ethereum, Ripple – BTC, ETH and XRP momentum fades, signaling deeper corrections
작성자 Manish Chhetri
게시일: 24 Sep 2025 | 수정일: 24 Sep 2025


POPULAR ARTICLES

Bitcoin (BTC), Ethereum (ETH), and Ripple (XRP) steadied on Wednesday after falling nearly 3%, 6%, and 5%, respectively, so far this week. The top three cryptocurrencies are showing signs of continued weakness, with fading momentum indicating deeper corrections may be on the horizon.
- Bitcoin price hovers around $112,300 on Wednesday, slipping almost 3% over the last two days.
- Ethereum closes below its daily support at $4,232, raising the risk of an extended downward move.
- XRP hovers around $2.83 after correcting nearly 5% so far this week.
Bitcoin (BTC), Ethereum (ETH), and Ripple (XRP) steadied on Wednesday after falling nearly 3%, 6%, and 5%, respectively, so far this week. The top three cryptocurrencies are showing signs of continued weakness, with fading momentum indicating deeper corrections may be on the horizon.
Bitcoin could correct further as momentum continues to weaken
Bitcoin price failed to find support around the daily level of $116,000 on Friday and declined 3.19% over the next four days, closing below the 50-day Exponential Moving Average at $113,794. At the time of writing on Wednesday, it hovers at around $112,157.
If BTC continues its ongoing correction, it could extend its decline to retest the next daily support at $107,245.
The Relative Strength Index (RSI) on the daily chart reads 42, below its neutral level of 50, indicating strong bearish momentum. The Moving Average Convergence Divergence (MACD) indicator also showed a bearish crossover on Monday, giving sell signals. Moreover, the rising red histogram bars below the neutral level also suggest a bearish momentum and continuation of the downward trend.
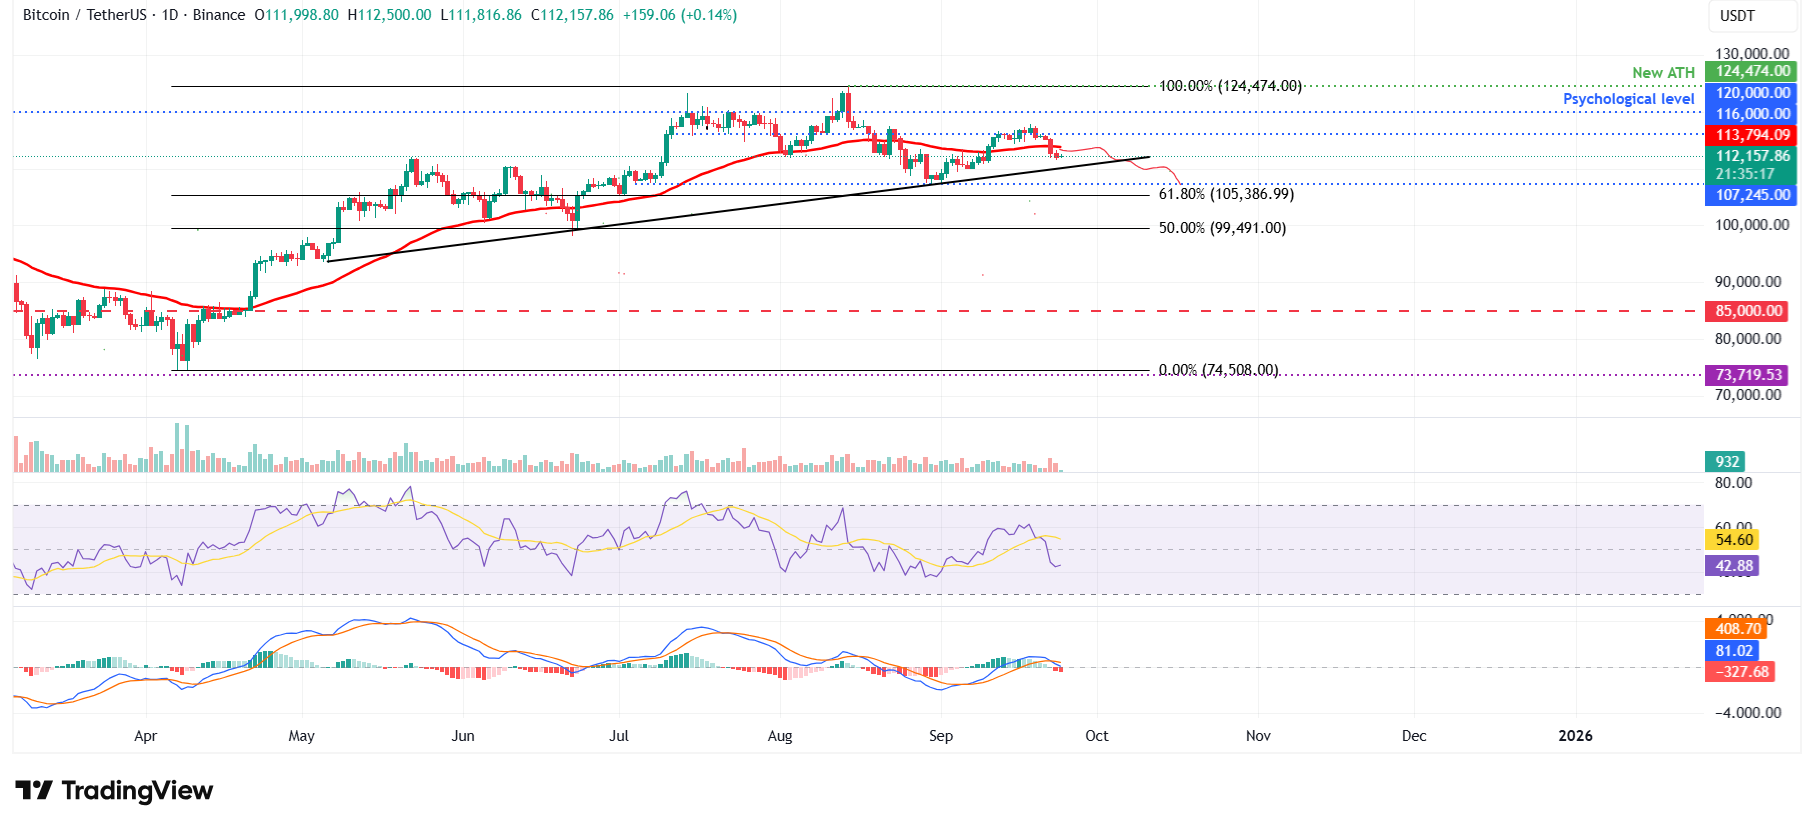
BTC/USDT daily chart
However, if BTC recovers and closes above the 50-day EMA at $113,794, it could extend the recovery toward the daily resistance at $116,000.
Ethereum bears are in control of the momentum
Ethereum price closed below the daily support level at $4,488 on Friday and declined by 6.77% over the next four days, ultimately closing below the next daily support level at $4,232 on Tuesday. At the time of writing on Wednesday, it hovers at around $4,171.
If ETH continues its downward trend, it could extend the decline to retest its 61.8% Fibonacci retracement level at $3,593.
Like Bitcoin, Ethereum’s RSI and MACD indicators also support the bearish view, indicating the continuation of the downward trend.
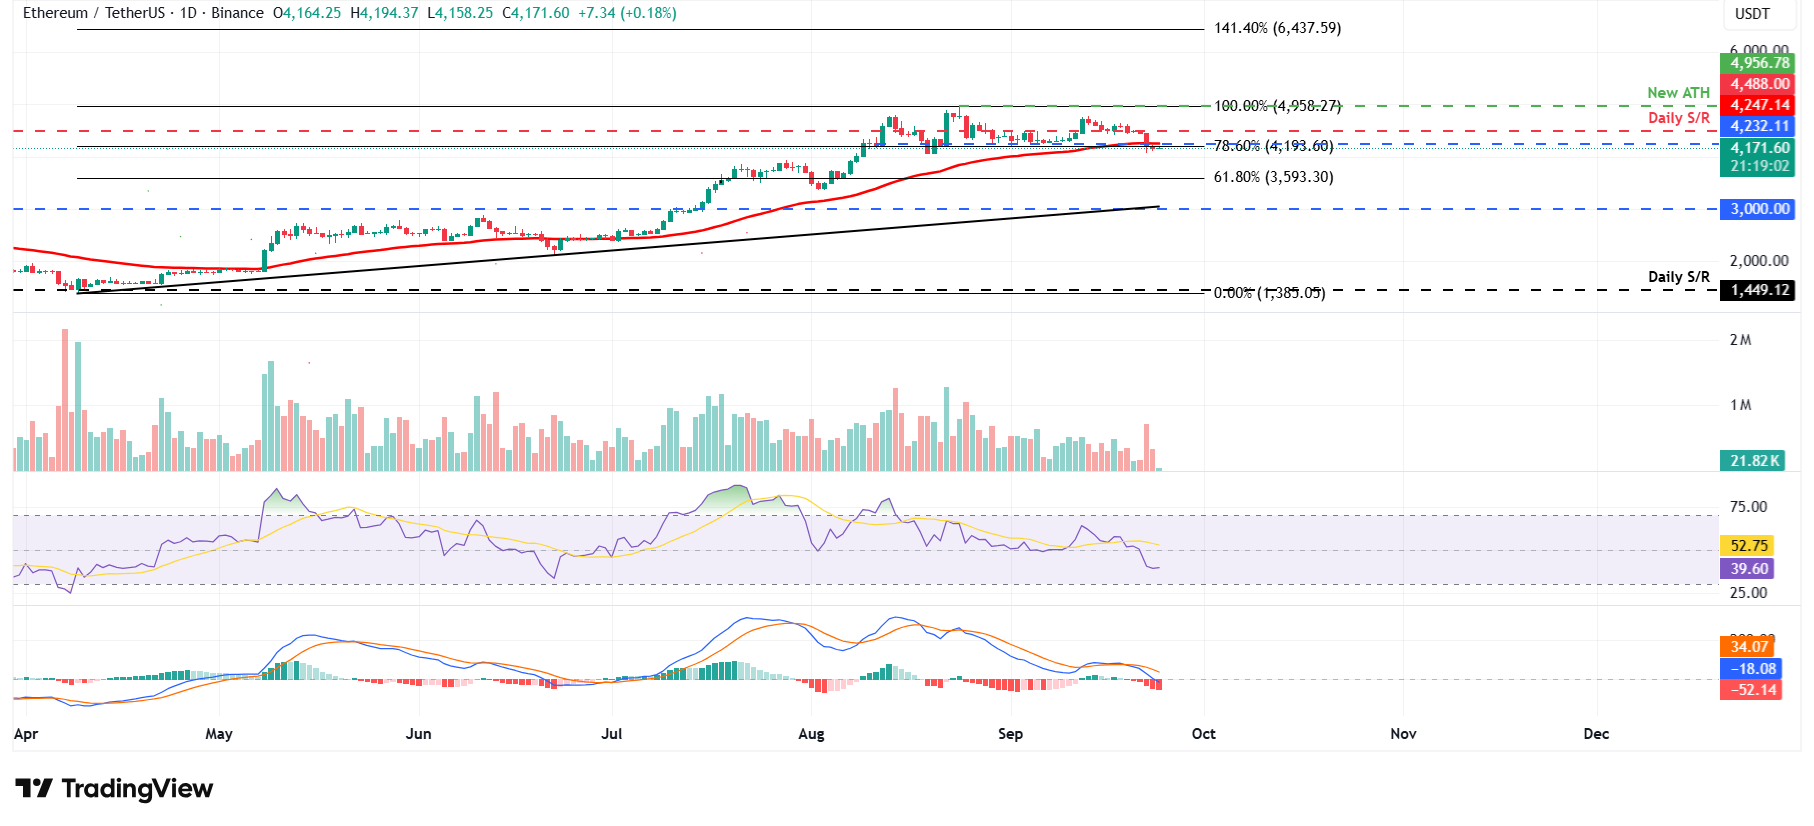
ETH/USDT daily chart
On the other hand, if ETH recovers and closes above the daily resistance at $4,232, it could extend the recovery toward the next daily resistance at $4,488.
XRP bears tighten grip as momentum slows
Ripple’s XRP failed to find support around the 61.8% Fibonacci retracement level at $2.99 on Friday and declined 6.62% by Tuesday. At the time of writing on Wednesday, it hovers at around $2.82.
If XRP continues to correct and closes below the daily support at $2.72, it could extend the decline to retest the next daily support at $2.35.
Like Bitcoin and Ethereum, XRP's momentum indicators also support the bearish view, suggesting a deeper correction ahead.
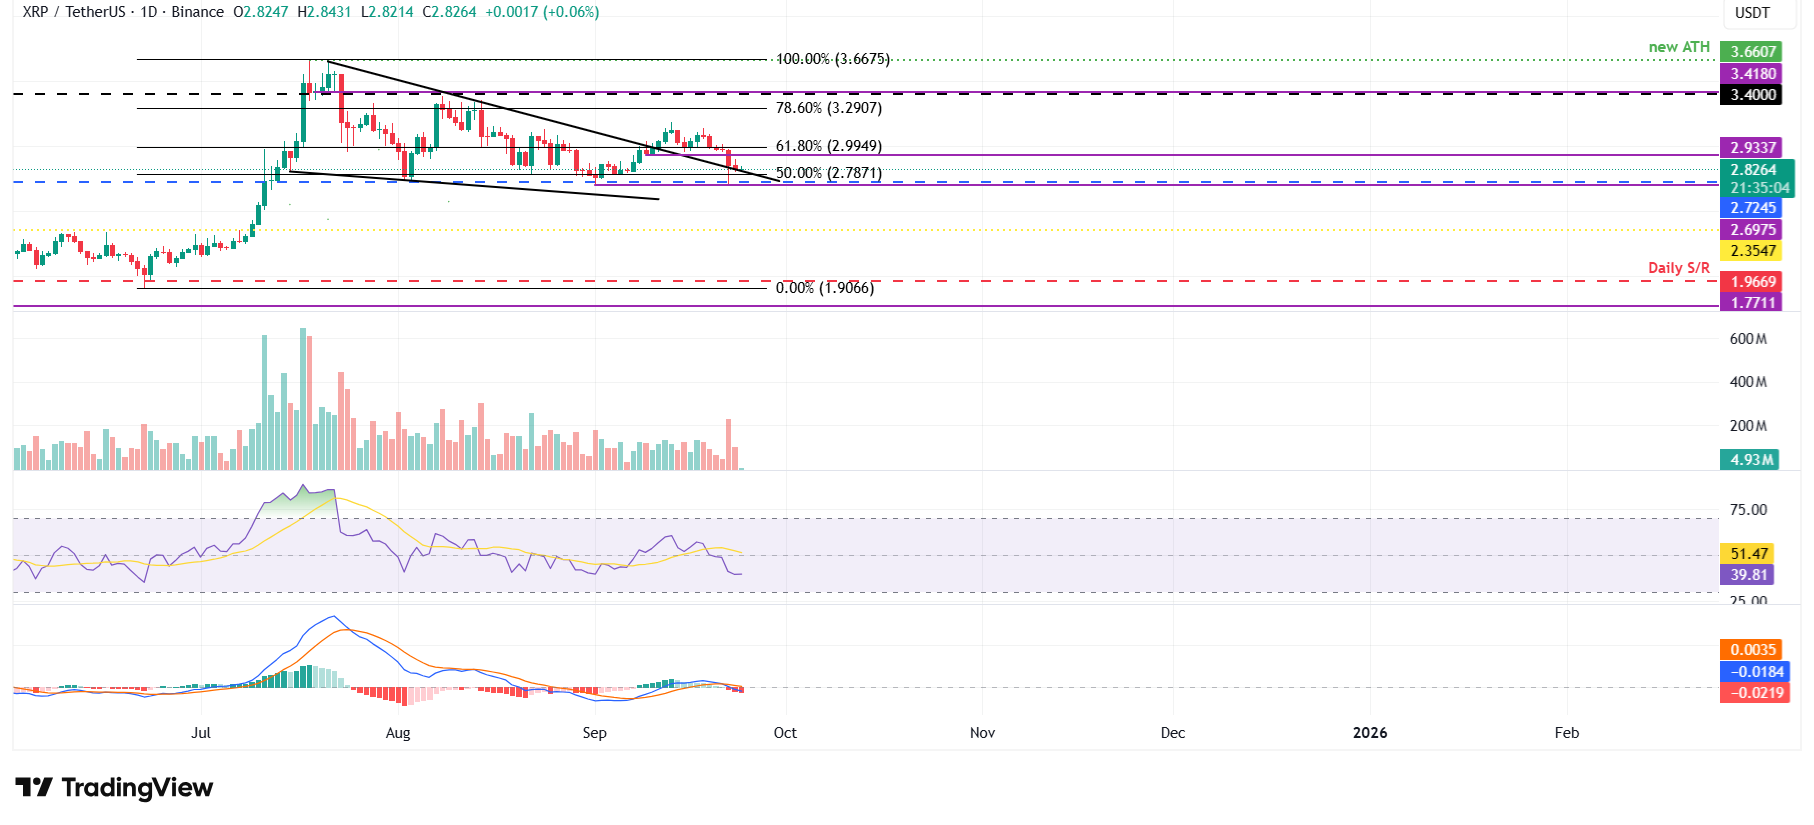
XRP/USDT daily chart
However, if XRP recovers, it could extend the recovery toward the resistance level at $2.99.
Cryptocurrency prices FAQs
Token launches influence demand and adoption among market participants. Listings on crypto exchanges deepen the liquidity for an asset and add new participants to an asset’s network. This is typically bullish for a digital asset.
A hack is an event in which an attacker captures a large volume of the asset from a DeFi bridge or hot wallet of an exchange or any other crypto platform via exploits, bugs or other methods. The exploiter then transfers these tokens out of the exchange platforms to ultimately sell or swap the assets for other cryptocurrencies or stablecoins. Such events often involve an en masse panic triggering a sell-off in the affected assets.
Macroeconomic events like the US Federal Reserve’s decision on interest rates influence crypto assets mainly through the direct impact they have on the US Dollar. An increase in interest rate typically negatively influences Bitcoin and altcoin prices, and vice versa. If the US Dollar index declines, risk assets and associated leverage for trading gets cheaper, in turn driving crypto prices higher.
Halvings are typically considered bullish events as they slash the block reward in half for miners, constricting the supply of the asset. At consistent demand if the supply reduces, the asset’s price climbs.

FXStreet
100만 명이 넘는 사용자가 FXStreet를 통해 실시간 시장 데이터, 차트 도구, 전문가 인사이트, 포렉스 뉴스를 이용합니다. 포괄적인 경제 캘린더와 교육 웨비나는 트레이더가 정보를 유지하고 신중한 결정을 내리도록 돕습니다. FXStreet는 바르셀로나 본사와 전 세계 지역에 걸쳐 약 60명의 팀으로 구성되어 있습니다.
Read More


