
Top 3 Price Prediction: Recovery of Bitcoin, Ethereum, XRP stalls at key levels
작성자 Vishal Dixit
게시일: 4 Dec 2025 | 수정일: 4 Dec 2025


인기 기사

Bitcoin (BTC), Ethereum (ETH), and Ripple (XRP) stall their two-day recovery on Thursday as the boost from Vanguard Group’s lifting the crypto Exchange Traded Funds (ETFs) ban wanes.
- Bitcoin steadies above $93,000 after a mid-week recovery, as US BTC spot ETFs break a five-day inflow streak on Wednesday.
- Ethereum approaches a key resistance trendline as institutional and network demand increase after the Fusaka upgrade.
- Ripple’s XRP takes a breather while ETFs record their 13th consecutive day of inflows.
Bitcoin (BTC), Ethereum (ETH), and Ripple (XRP) stall their two-day recovery on Thursday as the boost from Vanguard Group’s lifting the crypto Exchange Traded Funds (ETFs) ban wanes. The institutional support for Ethereum and XRP remains steady, while Bitcoin ETFs recorded an outflow on Wednesday after five straight days of inflows. The technical outlook for all major cryptos remains mixed, with key resistance levels looming.
Institutions back Ethereum and XRP, overlooking Bitcoin
Ethereum and Ripple spot ETFs recorded inflows of $140.16 million and $50.72 million on Wednesday, respectively, underpinned by the pro-crypto shift among traditional financial institutions seen this week.

However, Bitcoin ETFs logged a mild outflow of $14.90 million on the same day, ending a five-trading-day streak of consistent inflows. Overall, institutional support for Bitcoin and Ether fluctuates, while confidence in XRP remains strong.
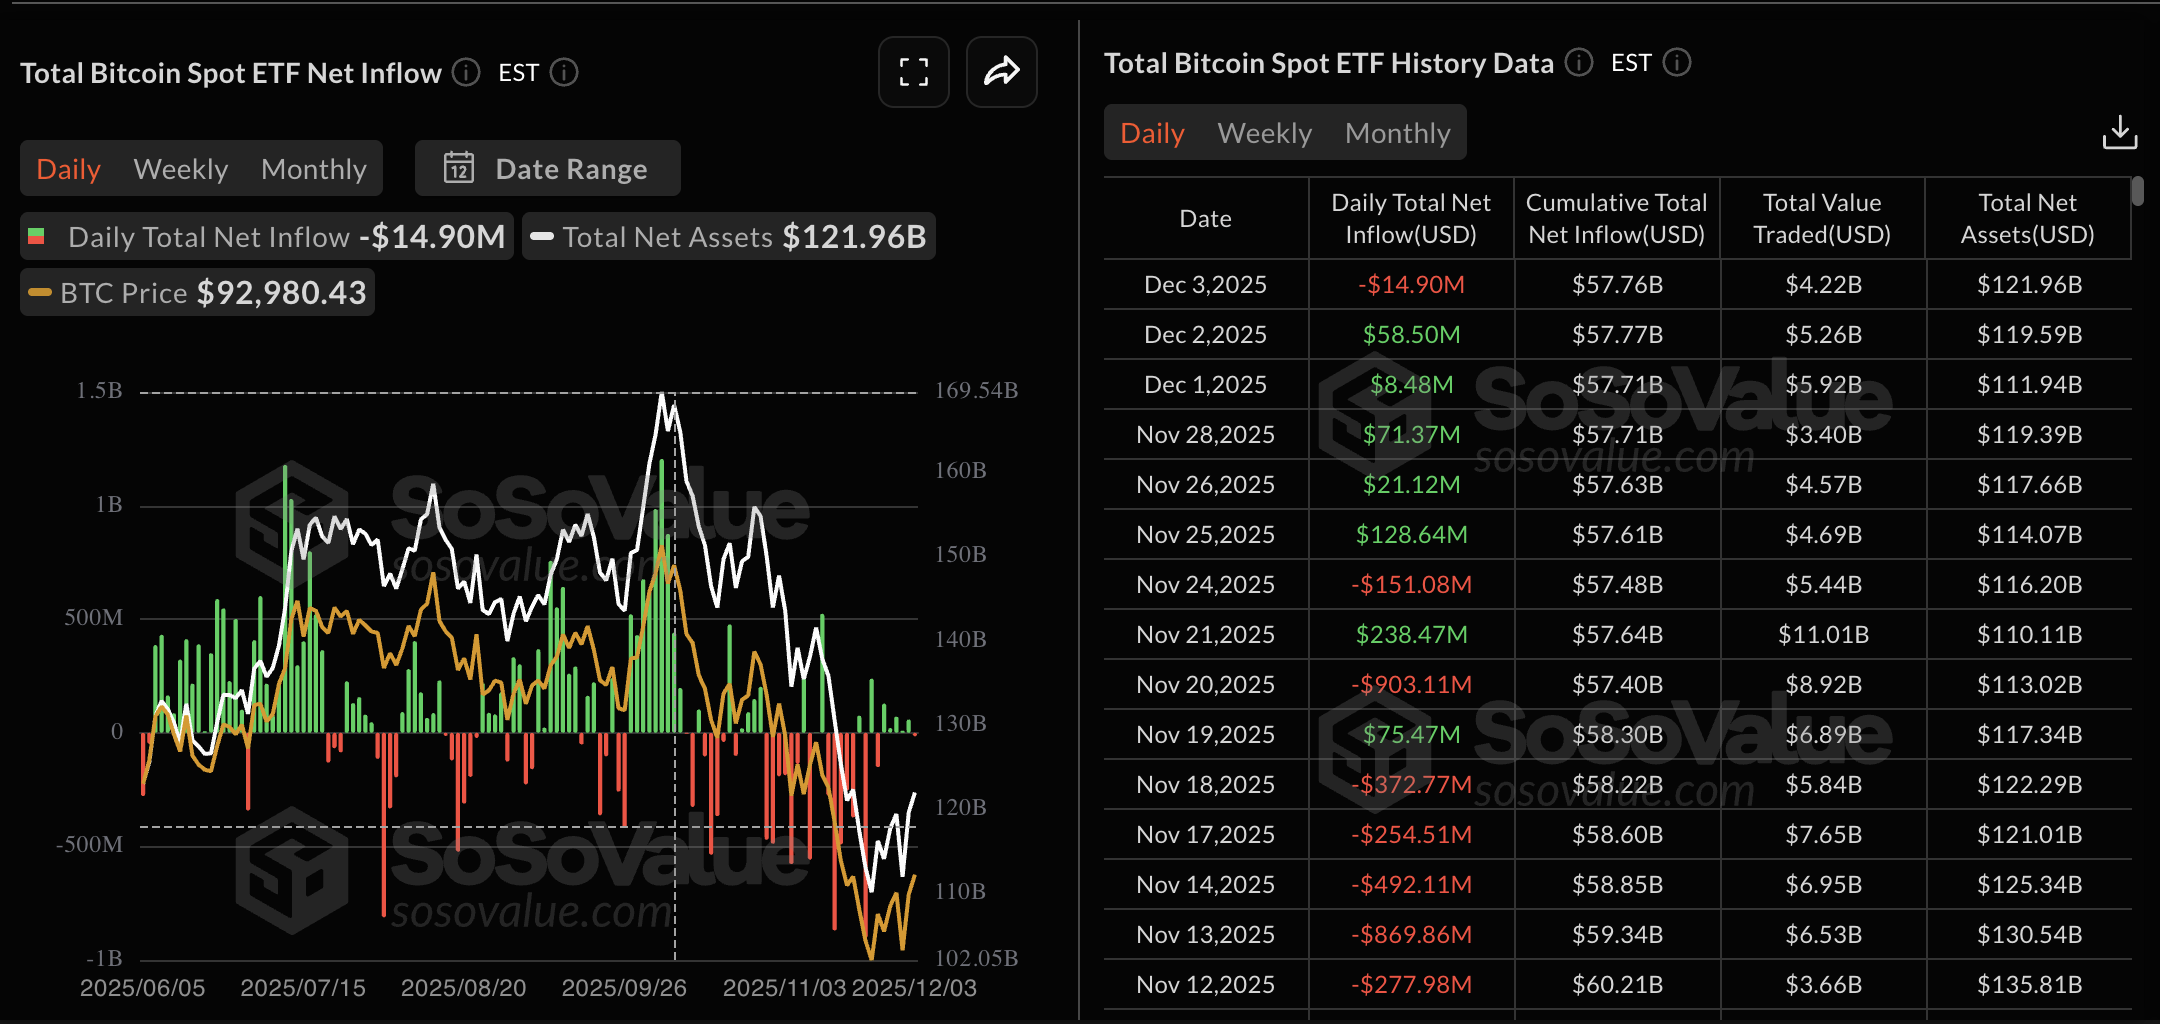
Bitcoin hovers above newfound support
Bitcoin hovers above $93,000 after a two-day recovery, successfully marking a daily close above the $92,800 resistance, which aligns with the April 28 low. This marks a bullish breakout, which could extend the rally to the June 22 low at $98,200.
According to the Supertrend Indicator, if BTC exceeds this threshold, it would confirm a fresh bullish trend and trigger a buy signal.
The momentum indicators on the daily chart show a steady decline in bearish pressure, with the Relative Strength Index (RSI) recovering to 48 after being oversold in late November.
Along the same lines, the Moving Average Convergence Divergence (MACD) maintains a steady uptrend, with rising green histogram bars above the zero line, indicating increasing bullish momentum.

If Bitcoin slips below $92,800, it could extend the decline to the demand zone extending between $84,700 and $80,600.
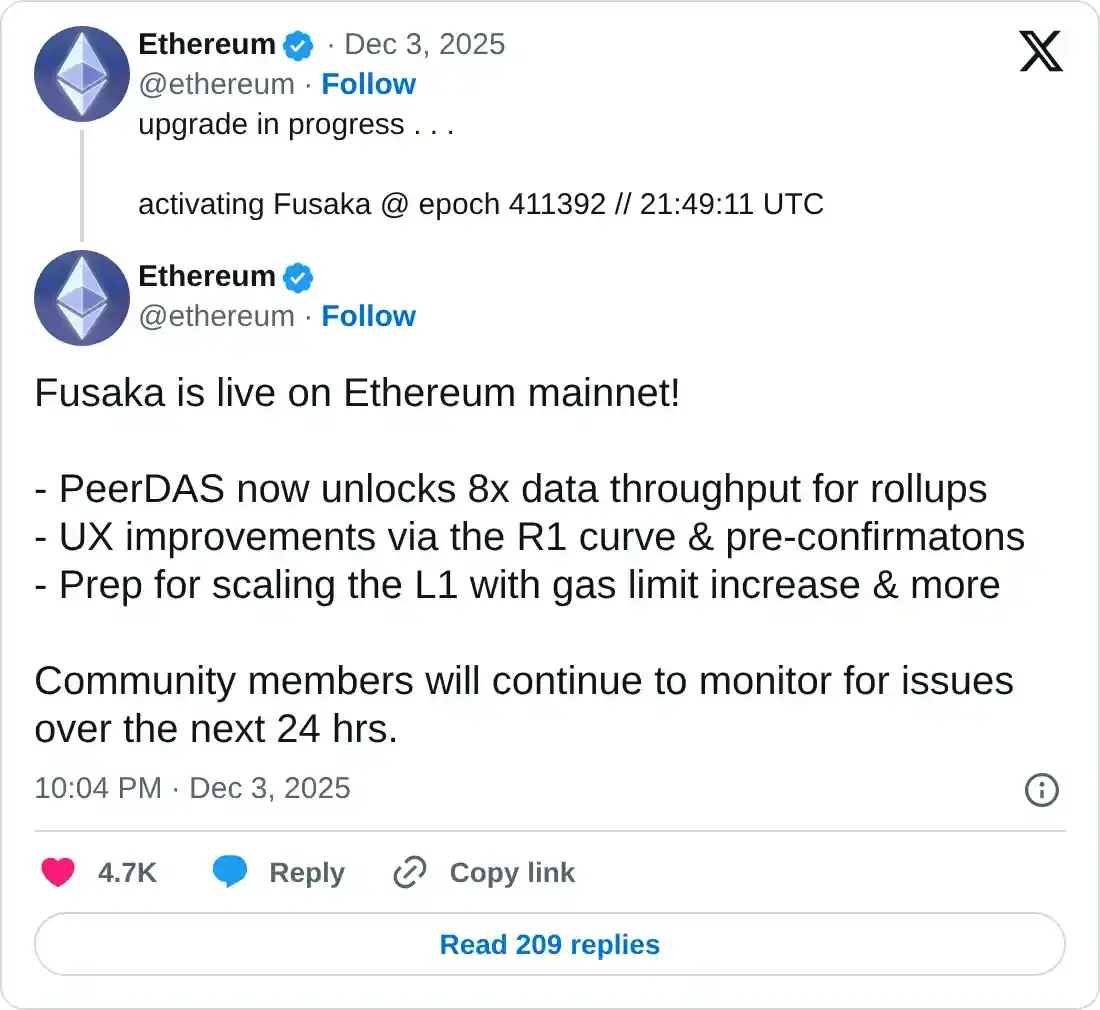
Ethereum remains strong on rising demand
Ethereum’s on-chain demand is heating up this week, with a record high of Transactions per Second (TPS) of over 34,000 on Wednesday as the Fusaka upgrade went live.
Furthermore, Santiment data shows that Network Growth – a metric that tracks the number of new addresses based on their first transaction – is at a five-month high.
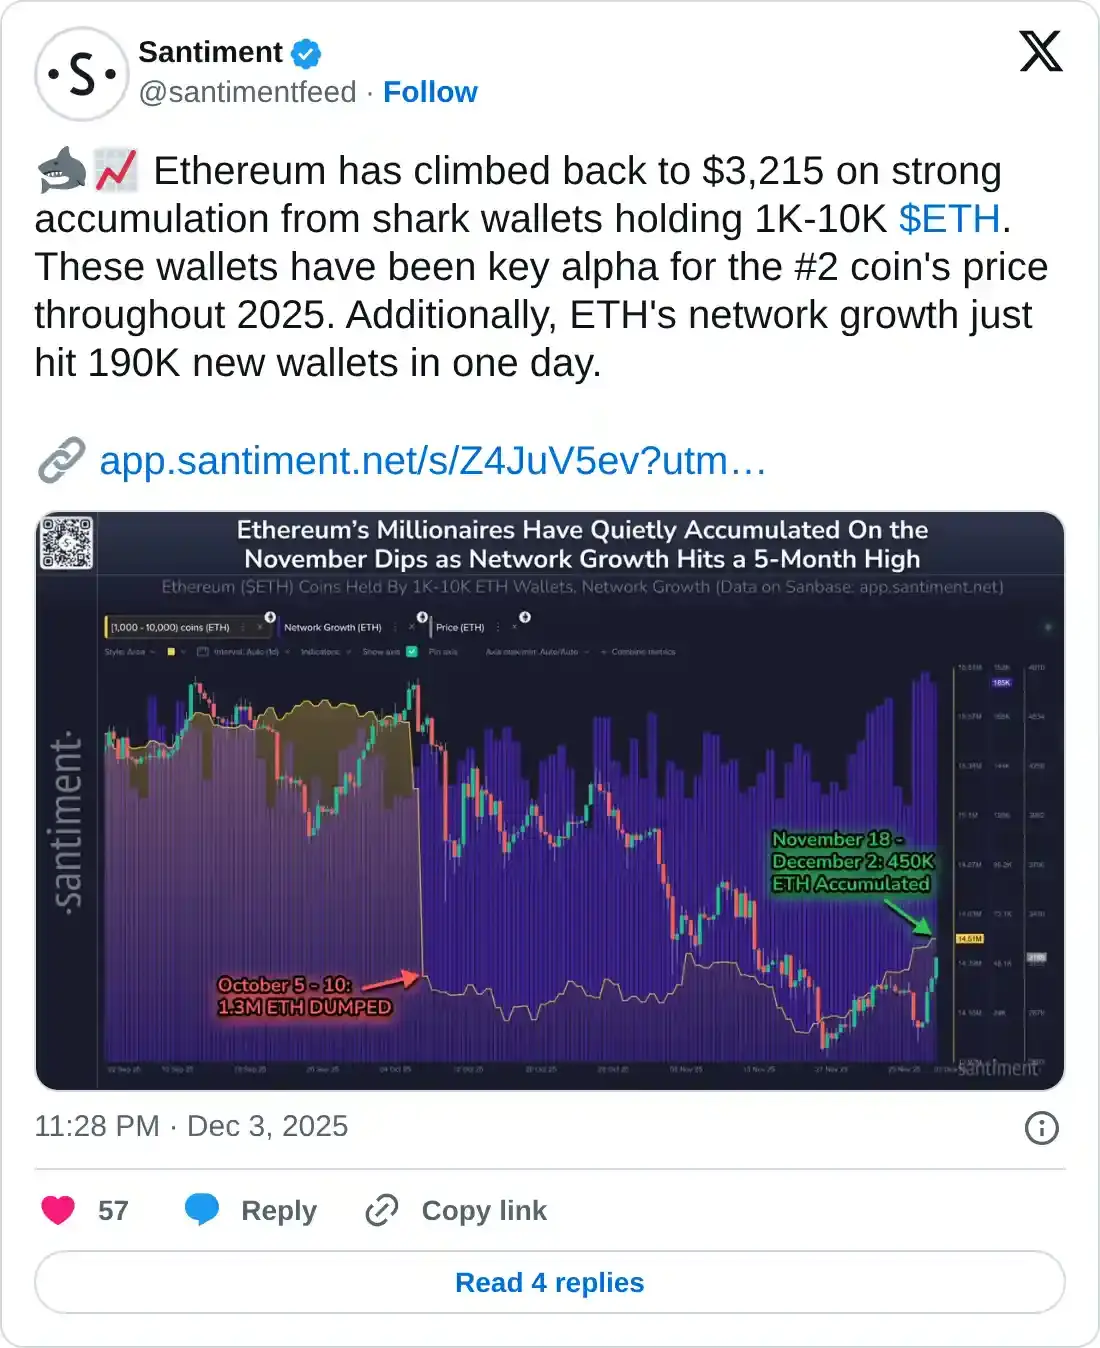
Ethereum trades above $3,200 on Thursday at the time of writing, holding steady after recovering over 14% in the previous two days. Ether approaches a crucial resistance trendline formed by connecting the highs of October 7 and 27 on the daily chart, near $3,250.
If ETH clears this trendline, the 50-day and 200-day Exponential Moving Averages (EMAs) at $3,361 and $3,475, respectively, would serve as dynamic resistance ahead of the supply zone near $3,650.
Similar to Bitcoin, the RSI and MACD show a steady increase in buying pressure.
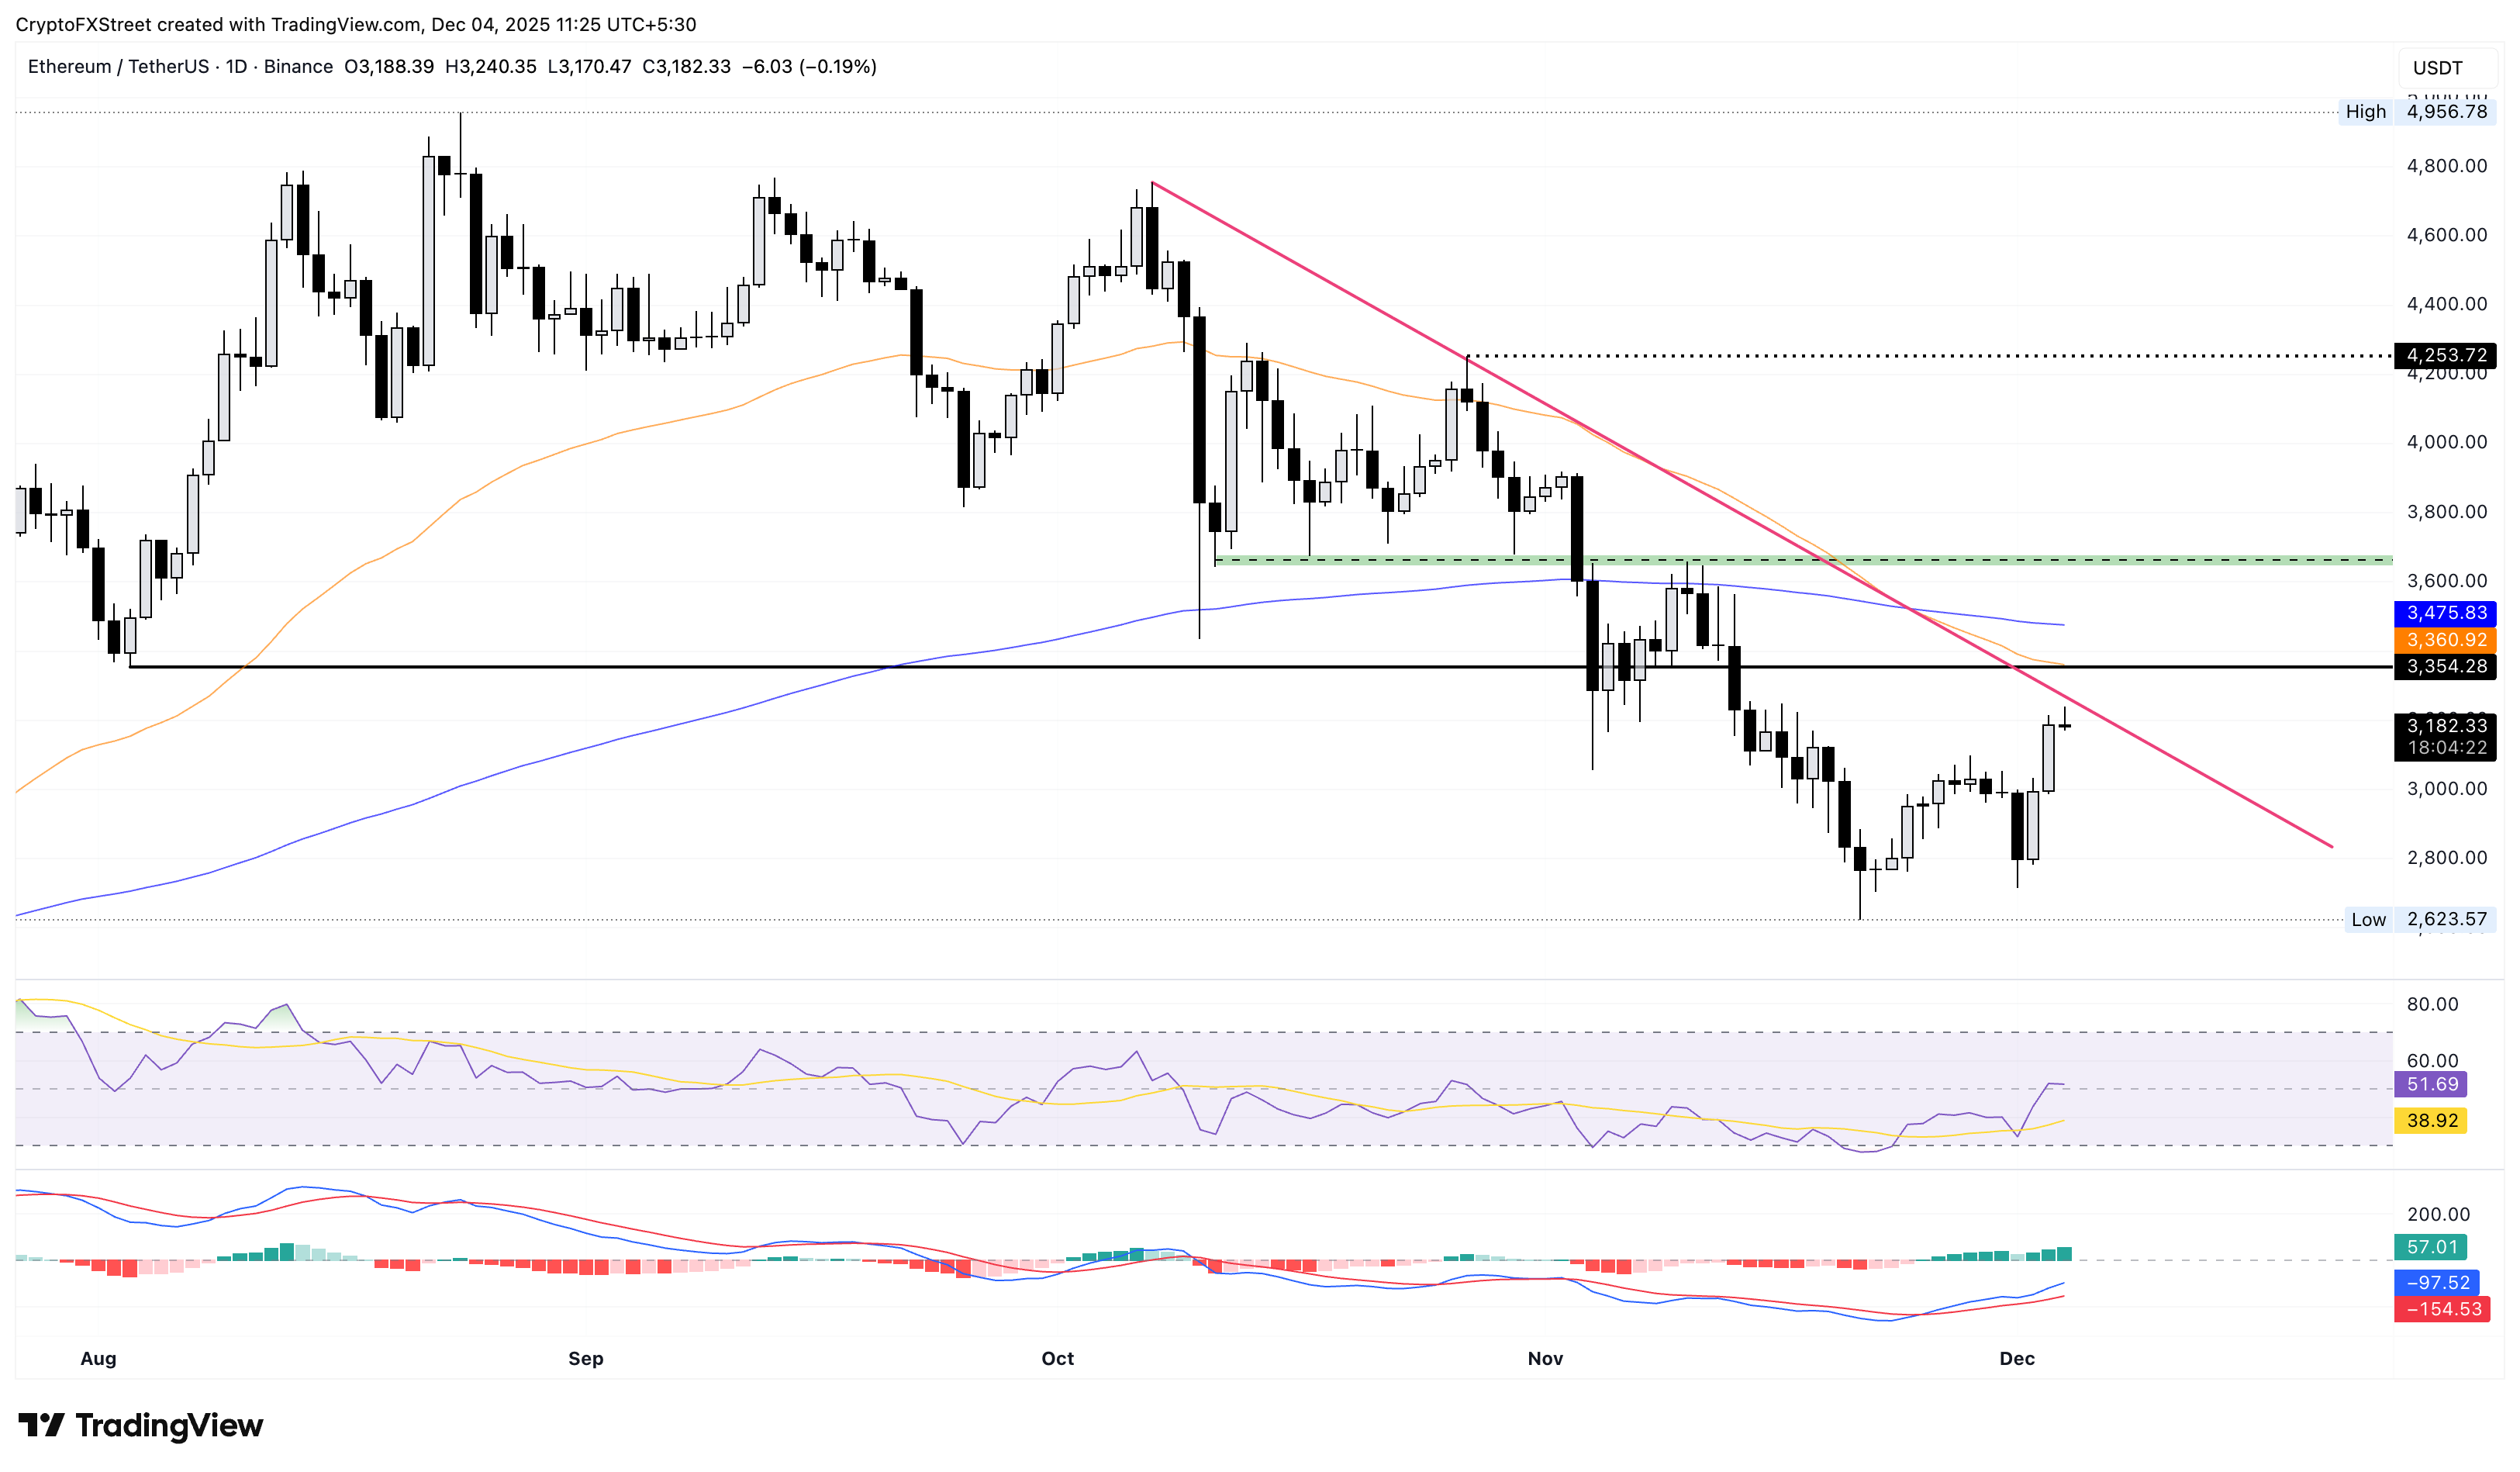
Looking down, the $3,000 round figure and the November 21 low at $2,623 could act as support levels.
Ripple risks losing gains from this week
Ripple ticks lower by 1% at press time on Thursday after two consecutive bullish candles on the daily chart. The overhead pressure near the $2.20 caps the XRP recovery, risking a potential reversal below the $2.00 round figure if bears achieve a negative daily close.
Additionally, the RSI at 47 falls from the halfway line, suggesting renewed headwinds. Still, the MACD and signal lines continue to move higher.
If XRP drops below $2.00, it could test the $1.90 support floor, marked by the June 22 low.
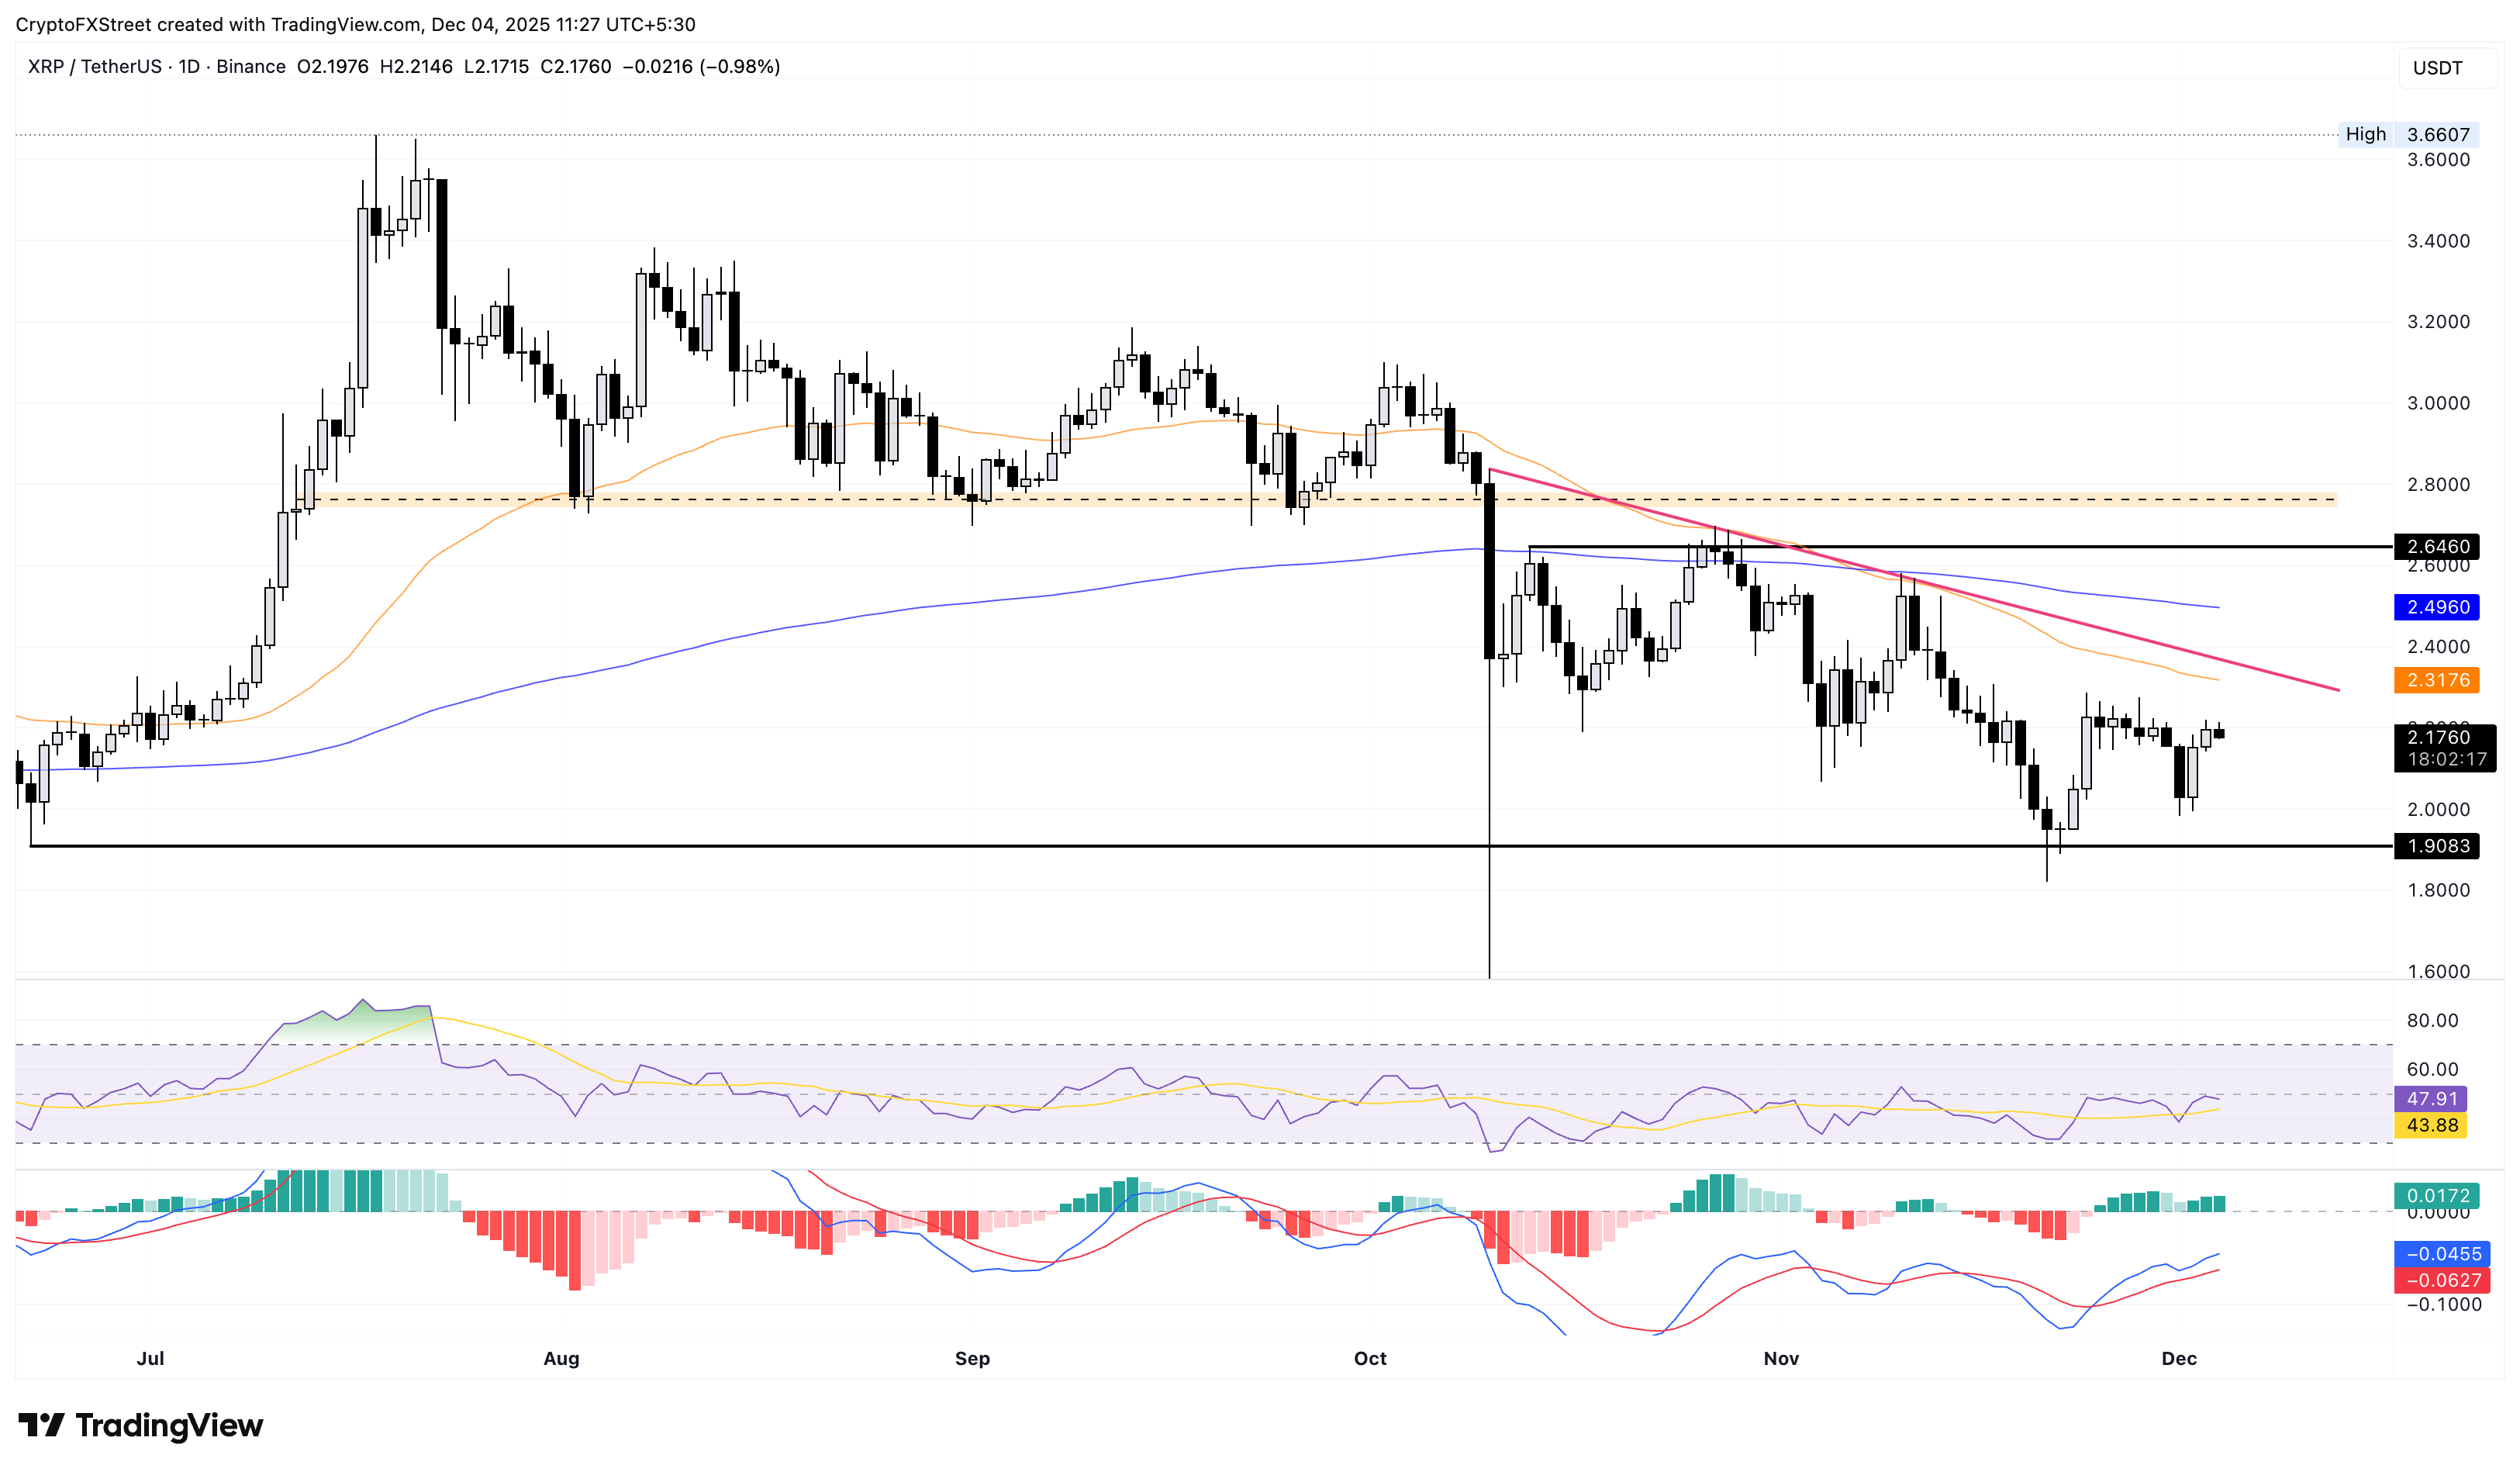
Looking up, if XRP extends recovery, it could face immediate resistance at the 50-day EMA at $2.31.

100만 명이 넘는 사용자가 FXStreet를 통해 실시간 시장 데이터, 차트 도구, 전문가 인사이트, 포렉스 뉴스를 이용합니다. 포괄적인 경제 캘린더와 교육 웨비나는 트레이더가 정보를 유지하고 신중한 결정을 내리도록 돕습니다. FXStreet는 바르셀로나 본사와 전 세계 지역에 걸쳐 약 60명의 팀으로 구성되어 있습니다.
더 읽기


