
Trade The World
Top Crypto Gainers: Aster, World Liberty Financial, SPX6900 rebound as Bitcoin crosses $110,000
작성자 Vishal Dixit
게시일: 24 Oct 2025 | 수정일: 24 Oct 2025


POPULAR ARTICLES

Aster (ASTER), World Liberty Financial (WLFI), and SPX6900 (SPX) record double-digit gains in the last 24 hours as Bitcoin reclaims the $110,000 level. Technically, ASTER is positioned for potential further gains, while headwinds for WLFI and SPX remain significant.
- Aster’s falling wedge breakout records double-digit gains, eyeing further recovery.
- World Liberty Financial token rebounds in a sideways range, with bulls eyeing a potential upside breakout.
- SPX6900 holds at a key support level of $0.9018 amid an impending Death Cross pattern.
Aster (ASTER), World Liberty Financial (WLFI), and SPX6900 (SPX) record double-digit gains in the last 24 hours as Bitcoin reclaims the $110,000 level. Technically, ASTER is positioned for potential further gains, while headwinds for WLFI and SPX remain significant.
Bitcoin prepares for a rebound amid short squeeze chances
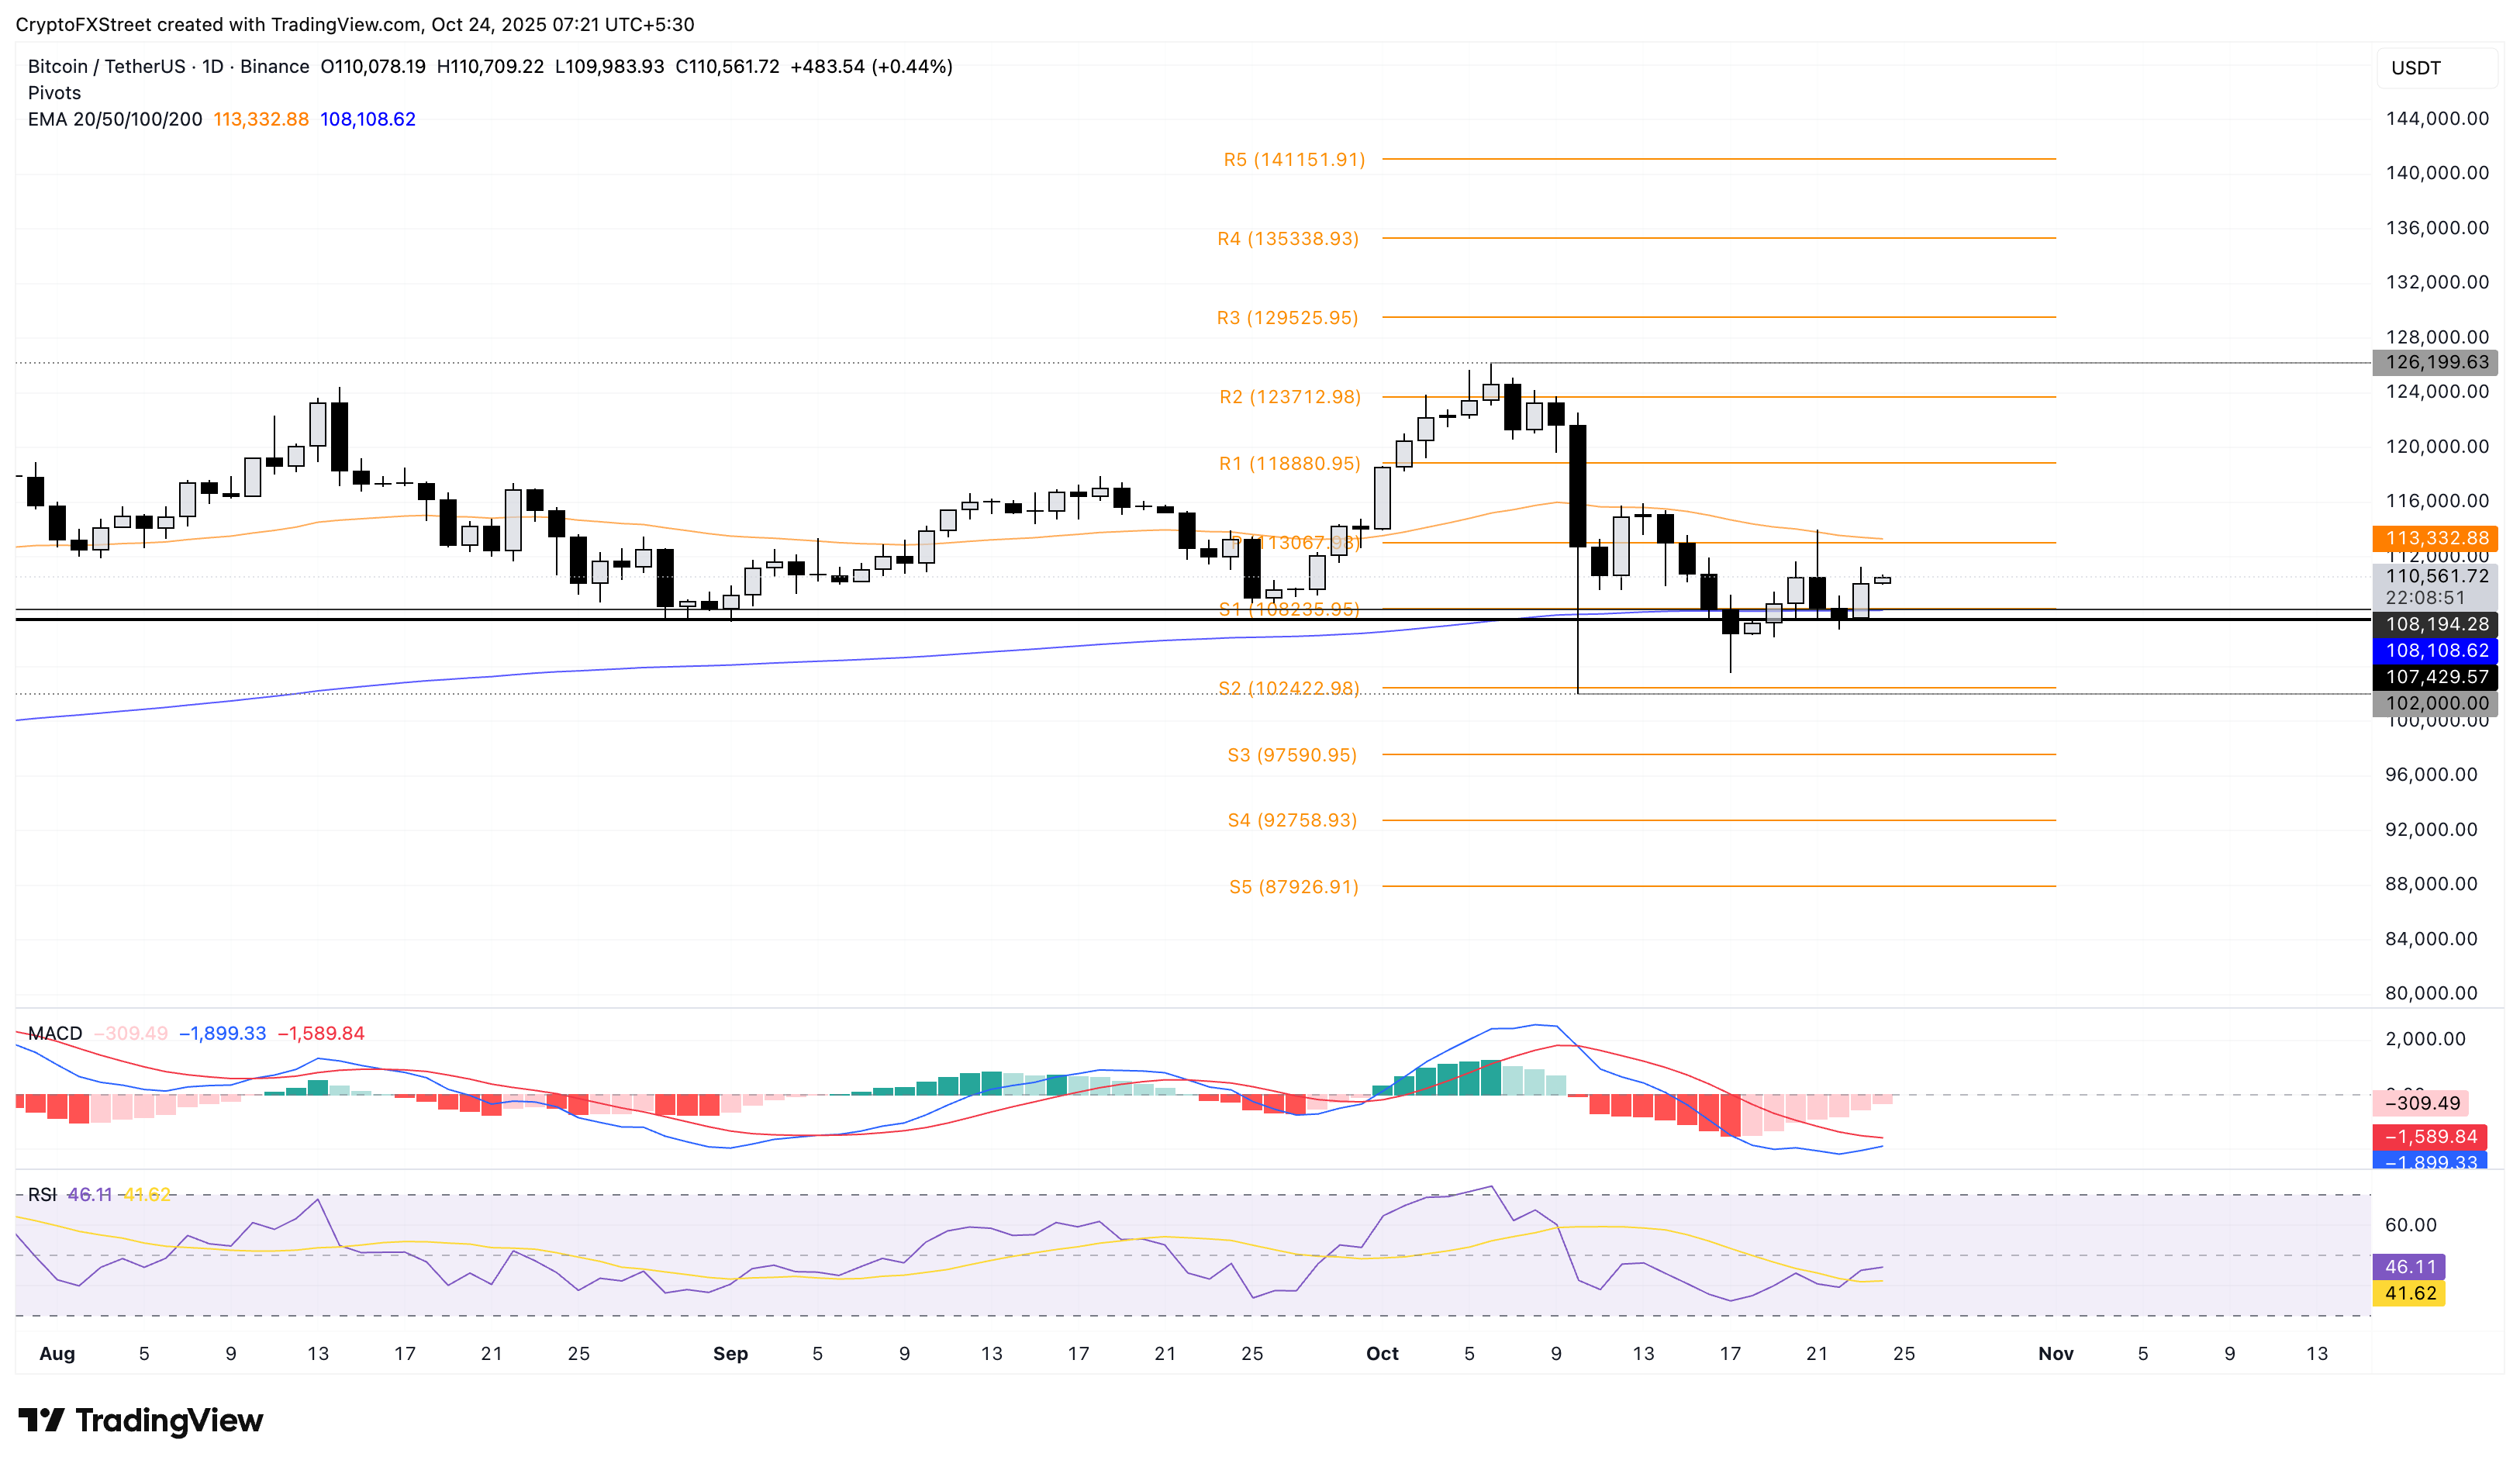
Bitcoin trades above $110,000 at press time on Friday, after a 2% rise on the previous day. The bounce back in Bitcoin could face resistance at the 50-day Exponential Moving Average at $113,334, aligning with the centre Pivot Point.
If Bitcoin crosses above the 50-day EMA, it could target the R1 Pivot Point at $118,880.
Joao Wedson, CEO of Alphractal, an on-chain analytics platform, anticipates a potential rebound in Bitcoin if bulls reclaim the $113,600 level, triggering a short squeeze run. This means that the built-up of unliquidated short positions above $113,600 is at risk of toppling like dominoes.
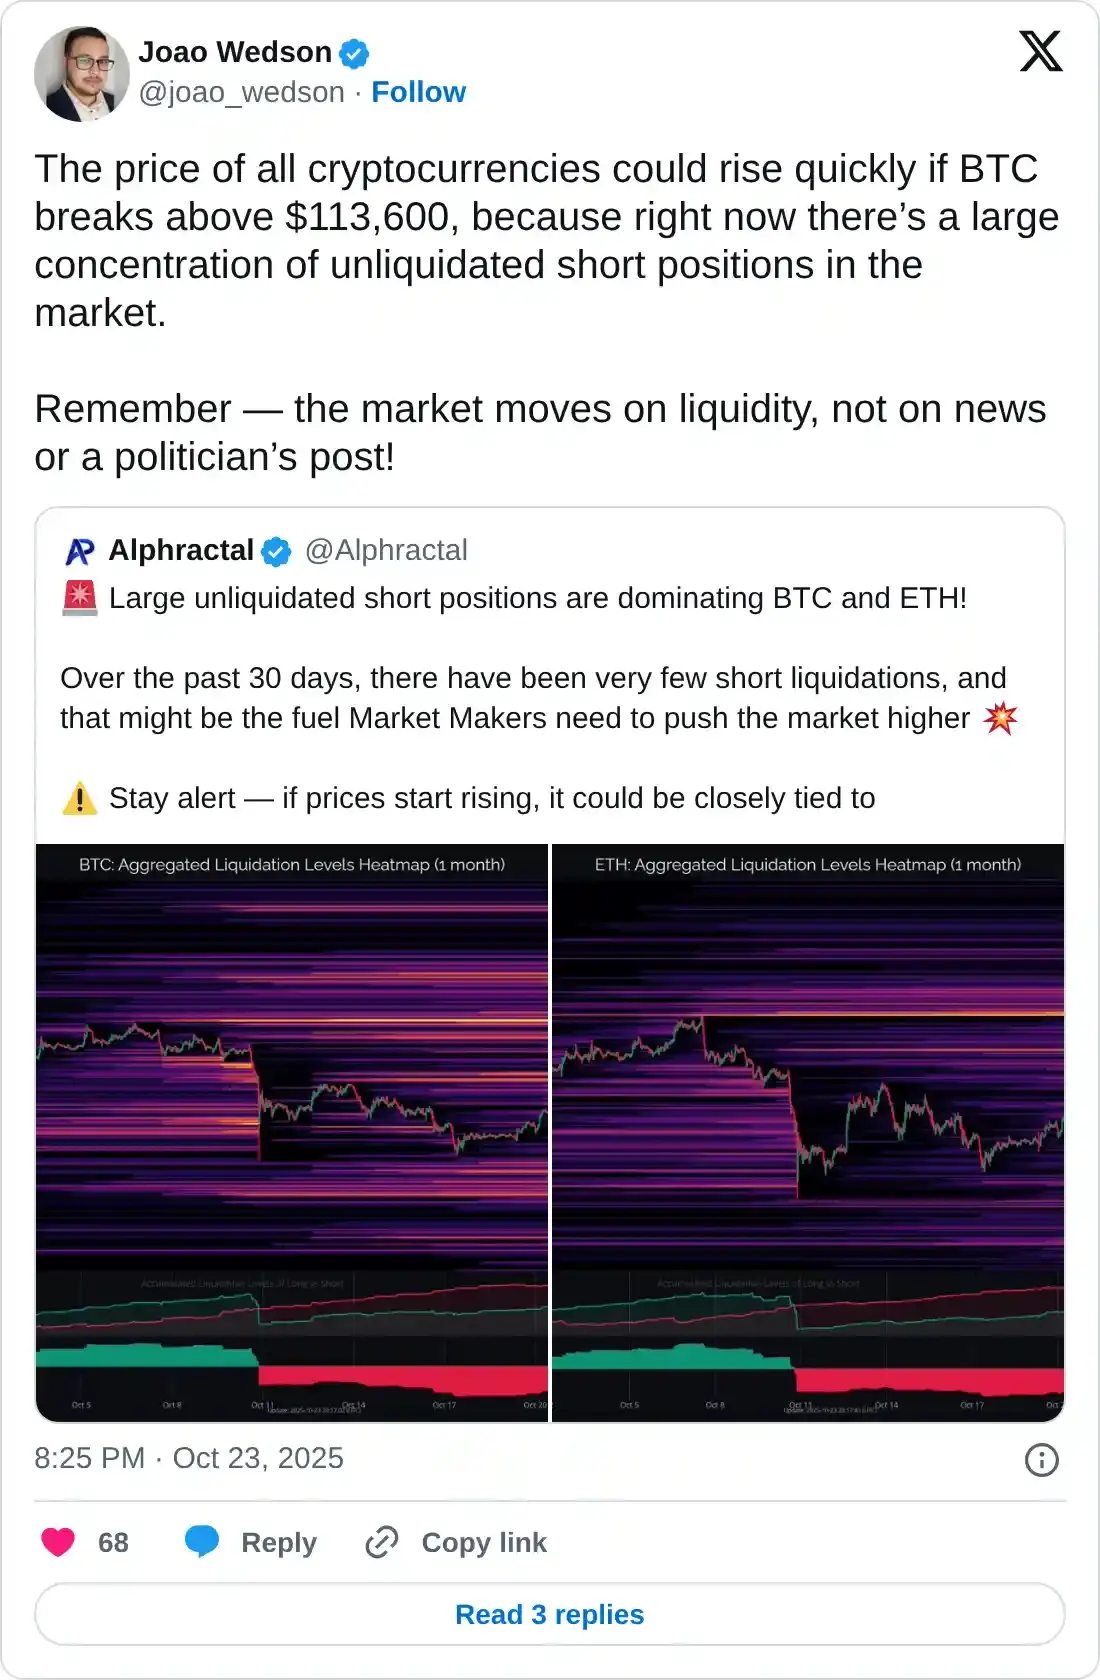
A positive shift in trend momentum increases Bitcoin's upside potential as the Moving Average Convergence Divergence (MACD) converges with the signal line, potentially signaling a bullish crossover. At the same time, the Relative Strength Index (RSI) rises to 46, approaching the halfway line, indicating a decline in selling pressure.
BTC/USDT daily price chart.
On the flip side, a slip below Wednesday’s close at $107,567 could extend the decline to the S2 Pivot Point at $102,422.
ASTER’s recovery turns into a wedge breakout rally
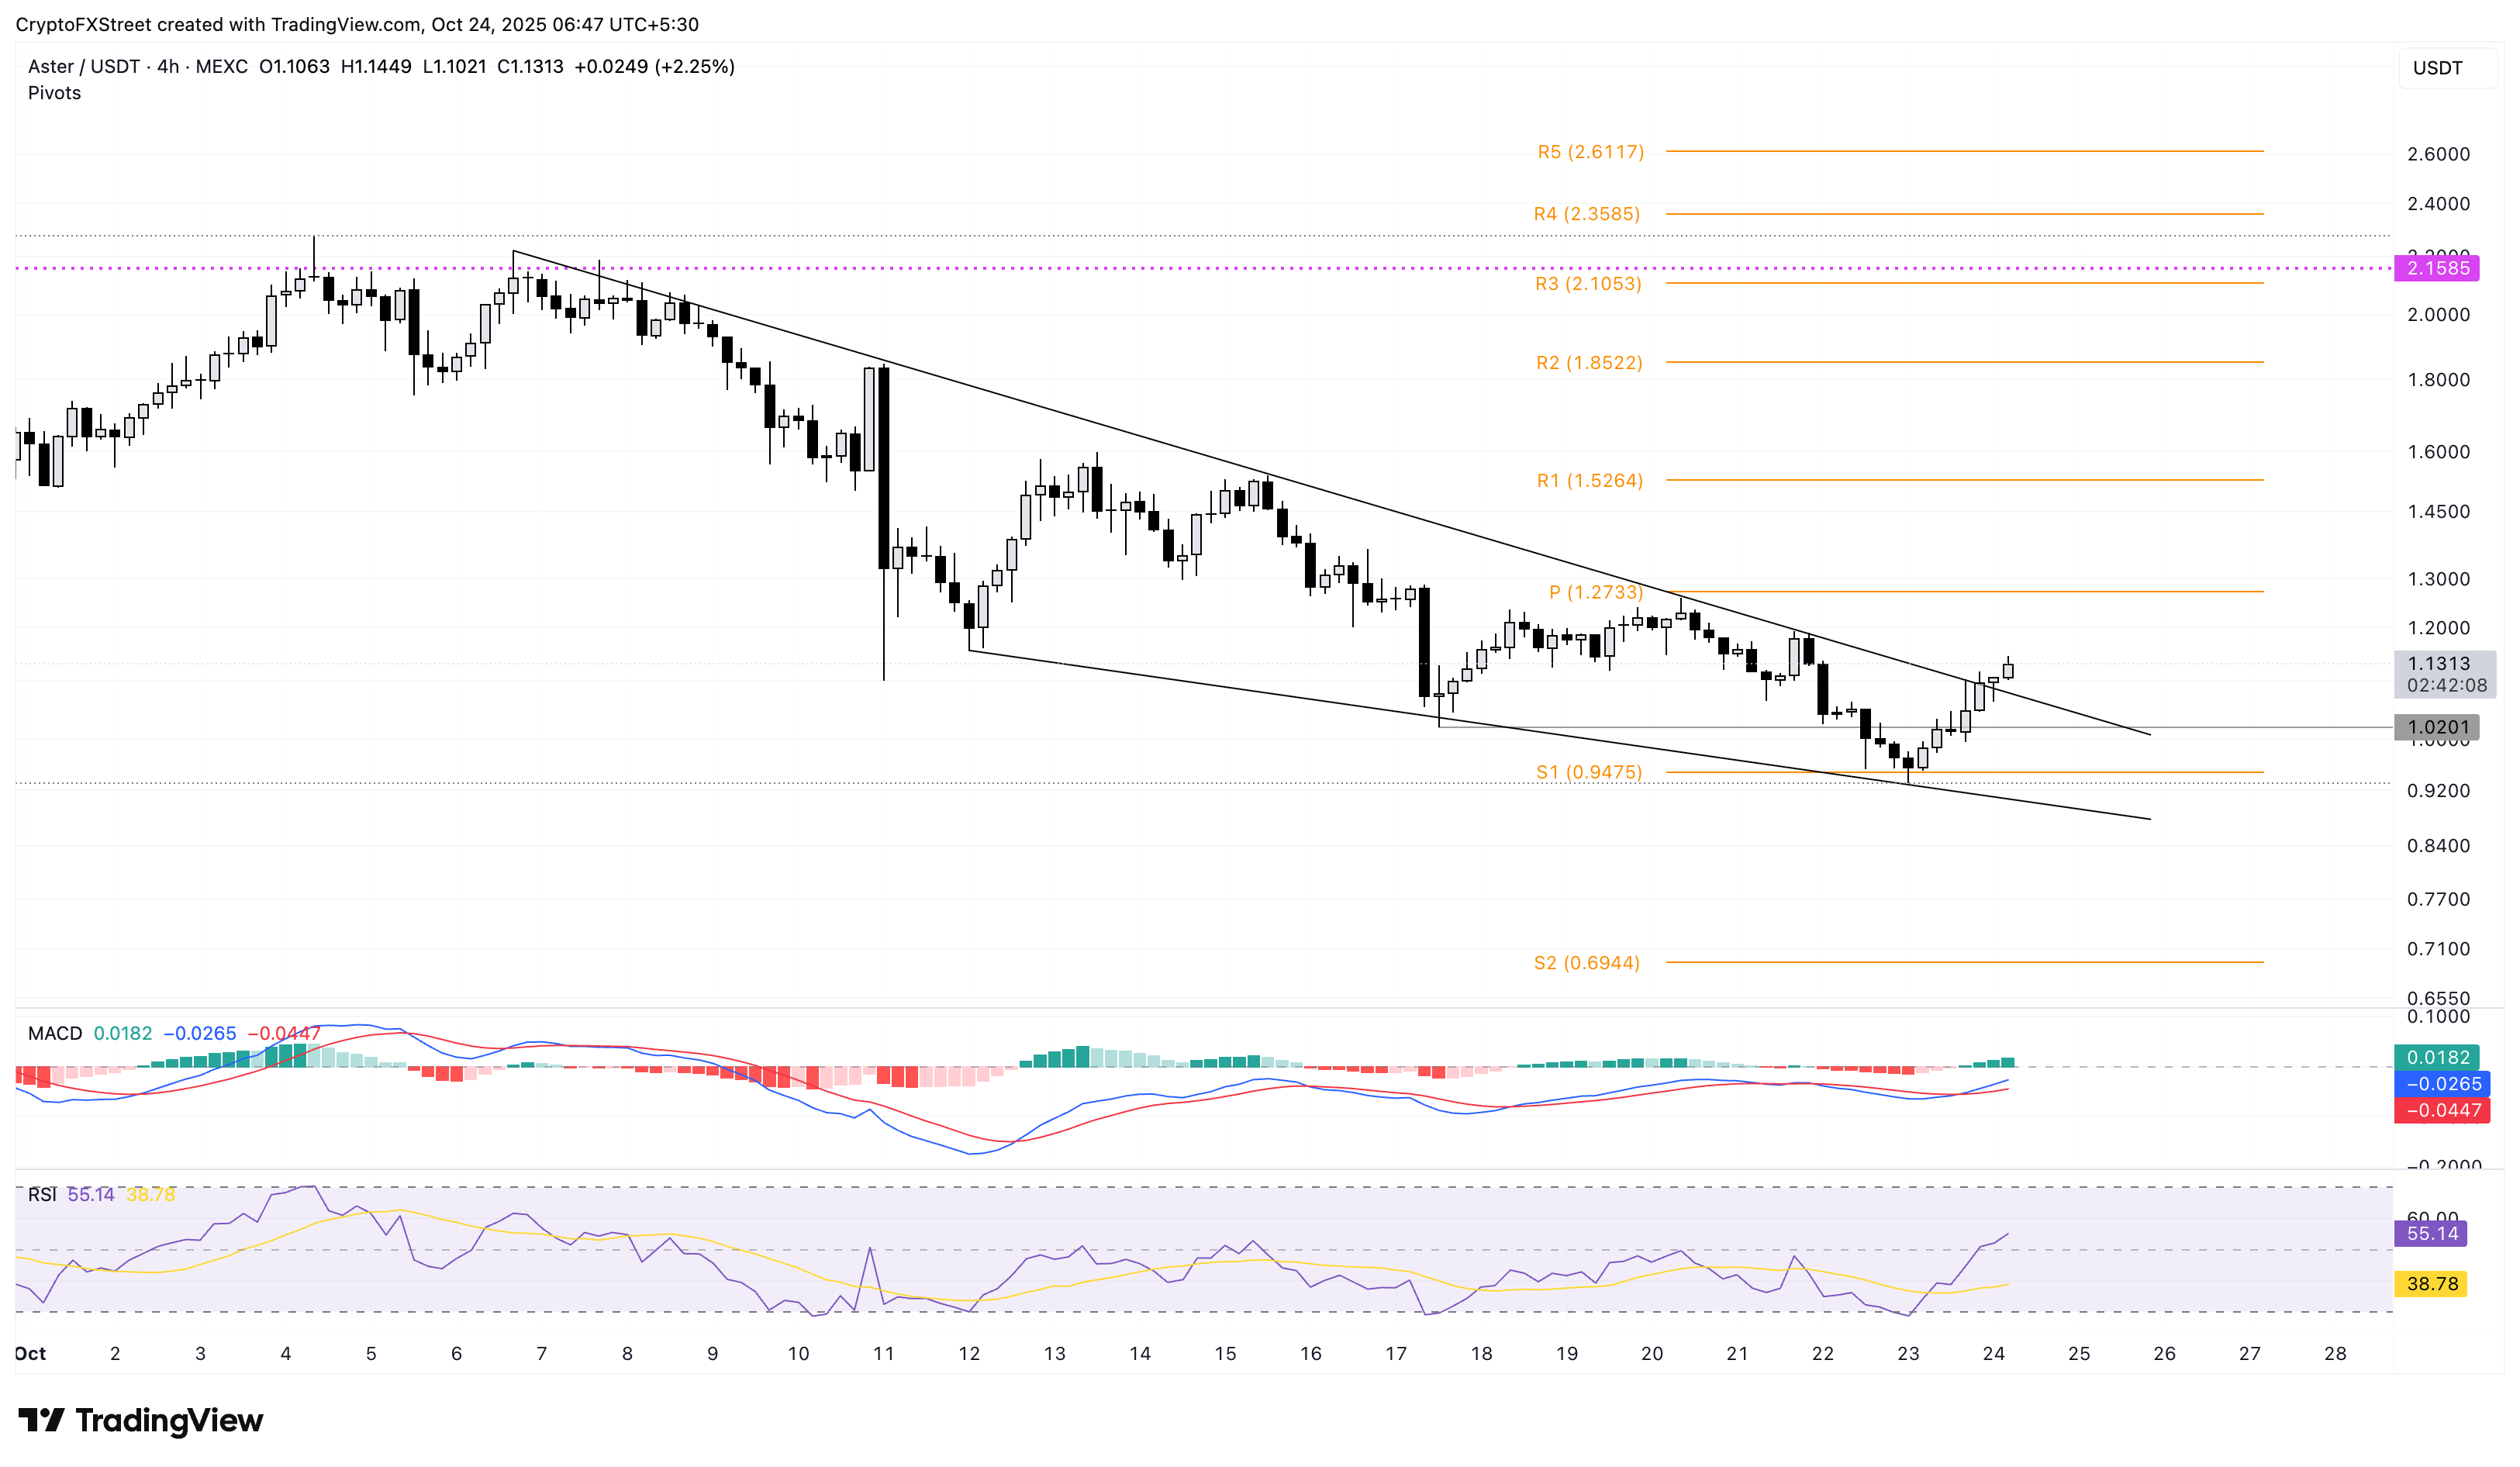
Aster edges higher by 1% at the time of writing, extending the 15% gains from Thursday. The Decentralized Exchange (DEX) token prepares to expand the breakout rally of a falling wedge pattern on the 4-hour chart.
The centre Pivot Point at $1.2733 could act as the immediate resistance for the ASTER breakout rally.
The MACD and signal line extend the uptrend towards the zero line after a crossover on Thursday, indicating a rise in bullish momentum. Additionally, the RSI at 55 surfaces above the halfway mark as buying pressure is restored.
ASTER/USDT 4-hour price chart.
However, if ASTER takes a sudden bearish turn, it could test the $ 1.00 psychological support, nullifying the breakout rally.
WLFI bounces back in a consolidation range
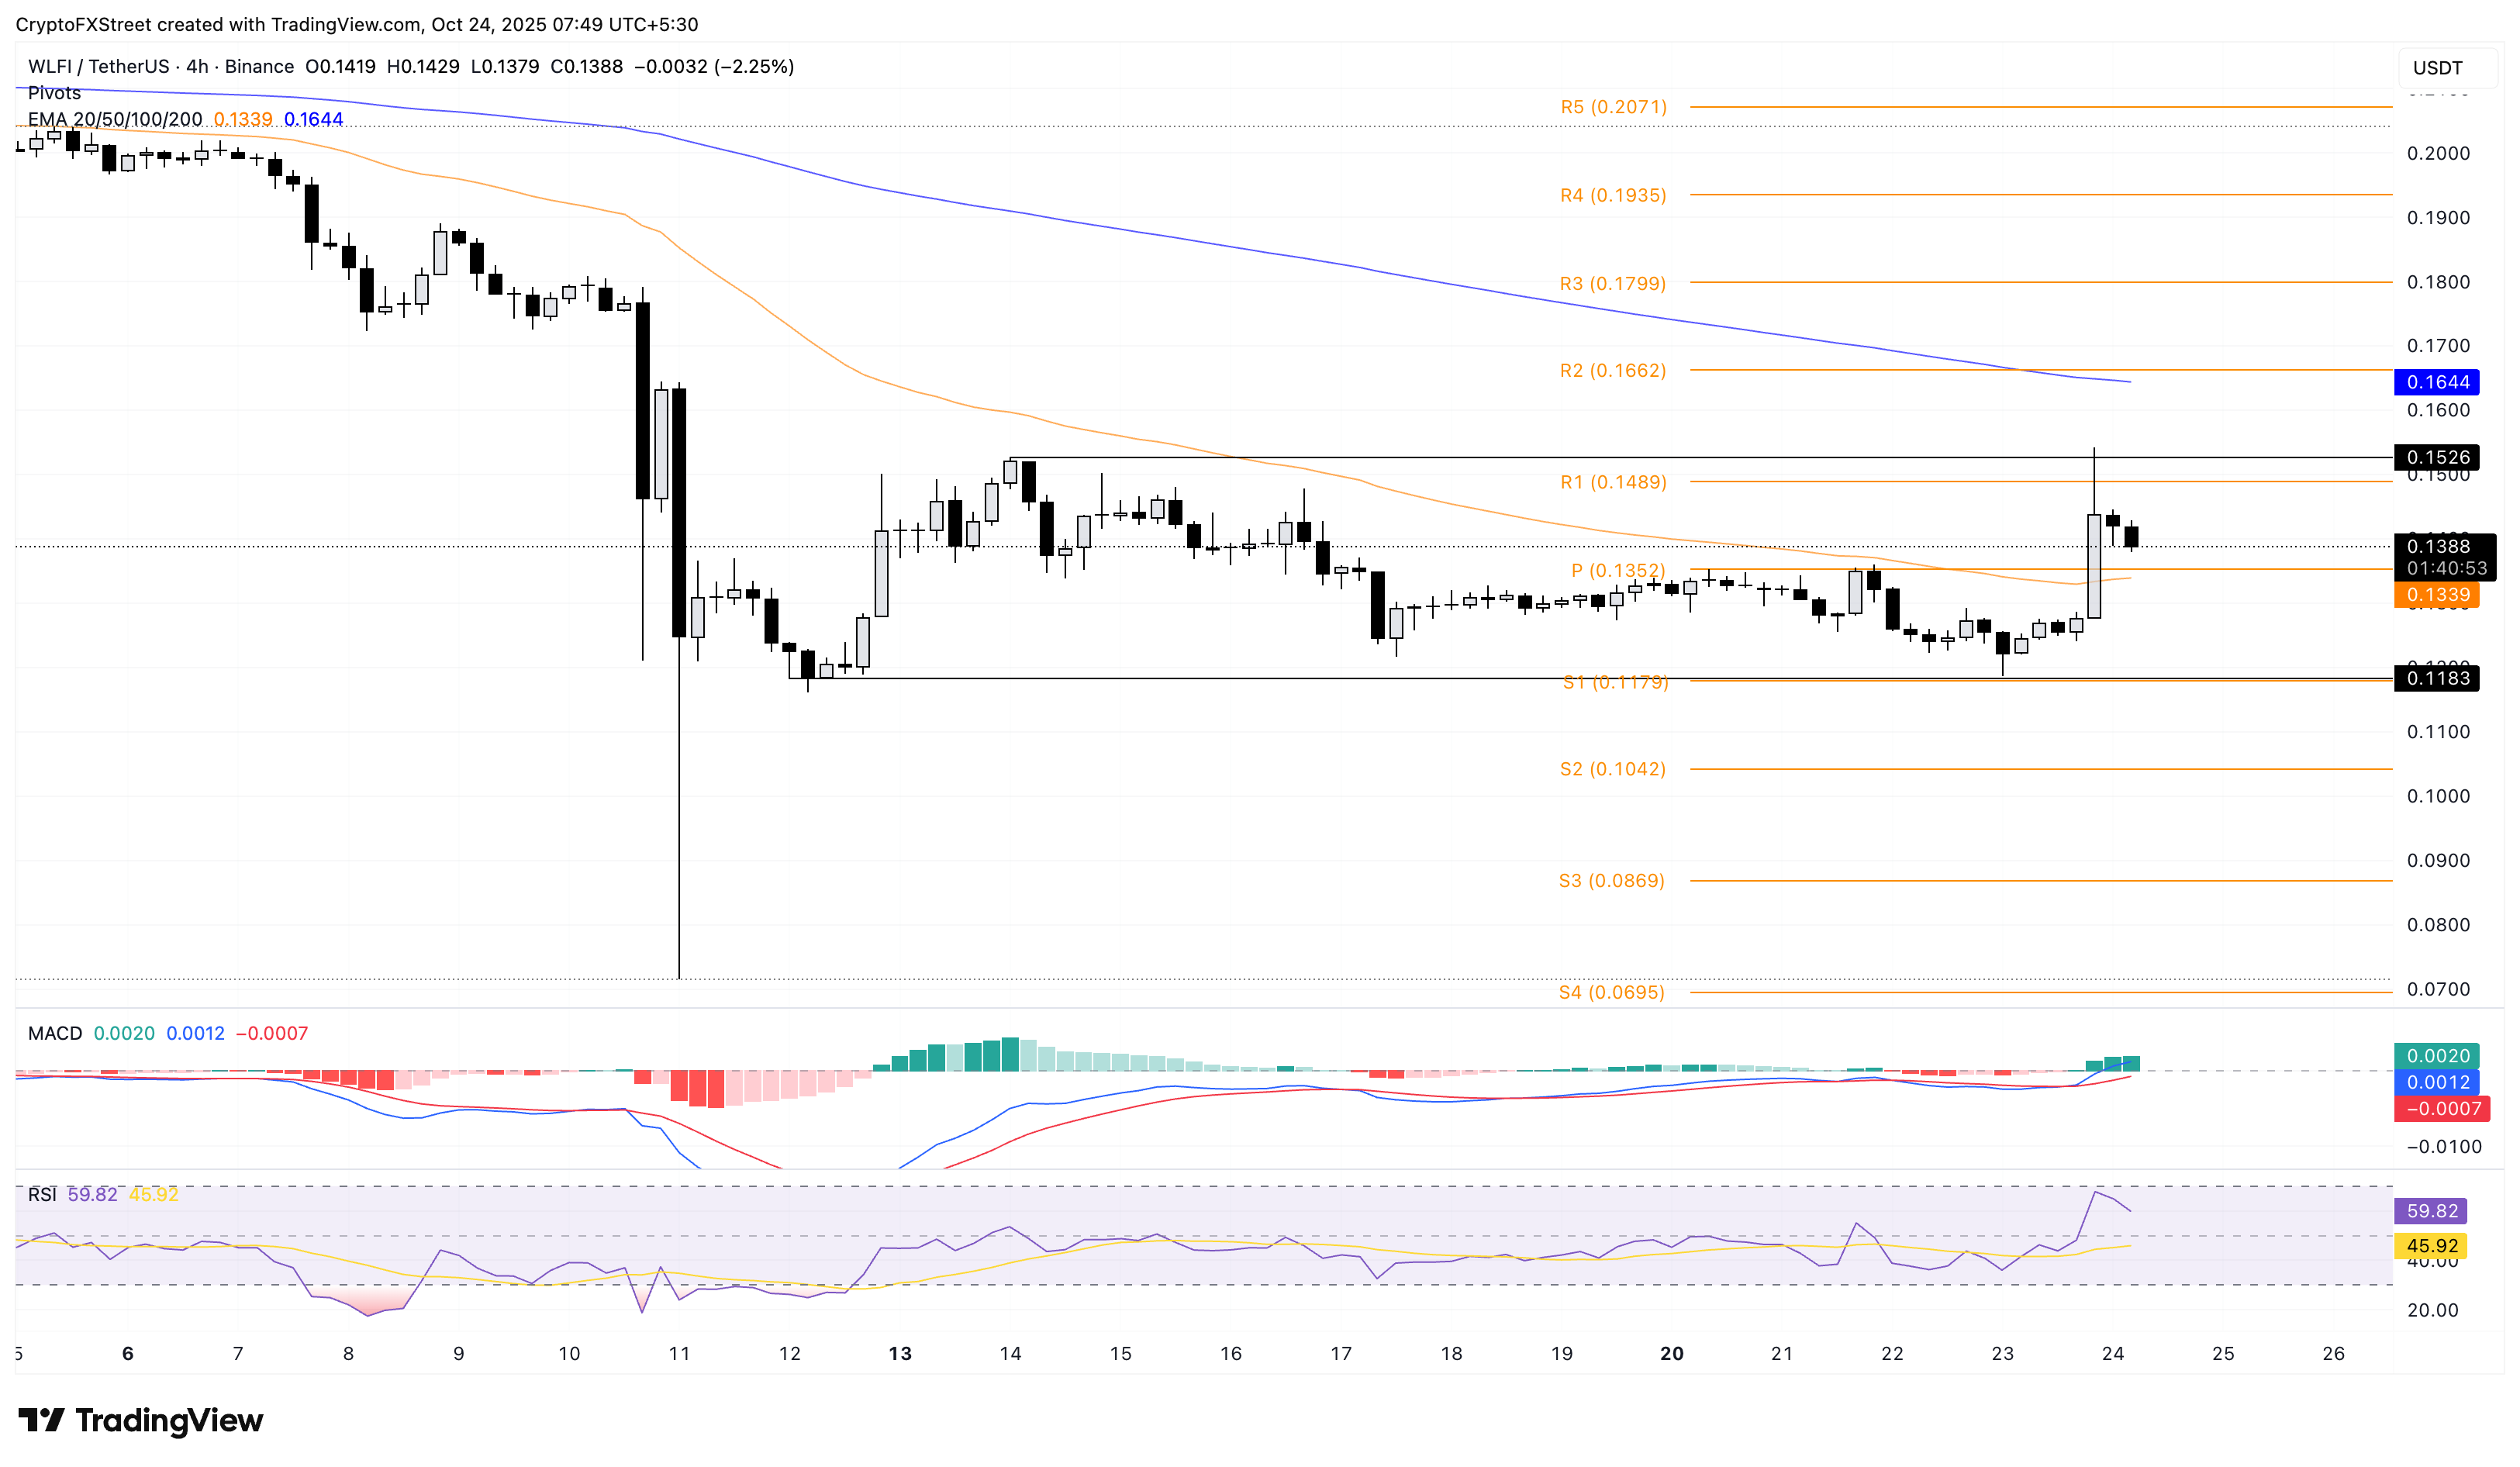
World Liberty Financial holds steady above $0.1350 at press time on Friday, following a 16% rise on the previous day. The WLFI token is trading in a sideways range between the $0.1183 baseline and the $0.1526 ceiling on the 4-hour chart.
The pullback from the upper ceiling risks a potential decline to the $0.1183 baseline.
The MACD and signal line rise with successive positive green candles, suggesting a surge in bullish momentum. However, RSI dips to 59, reversing from the overbought zone, leaving momentum indicators overall mixed.
WLFI/USDT 4-hour price chart.
On the upside, a decisive breakout of the $0.1526 level could extend the WLFI rally to the 200-period EMA at $0.1644.
SPX rebounds from key support, overhead pressure persists
SPX6900 struggles to reclaim the $1 psychological level despite the 9% bounce back on Thursday from the $0.9018 demand zone. At the time of writing, SPX trades above $0.9700, holding to the Thursday gains.
If the meme coin extends recovery, it could test the centre Pivot Point at $1.1260.
The 50-day EMA is declining and converging with the 200-day EMA, risking a Death Cross. This crossover would confirm the short-term pullback outpacing the longer-term trend.
On the other hand, momentum indicators on the daily chart remain divided as the MACD approaches the signal line for a bullish crossover. Meanwhile, the RSI at 42 extends the sideways trend below the halfway line, suggesting overhead pressure.
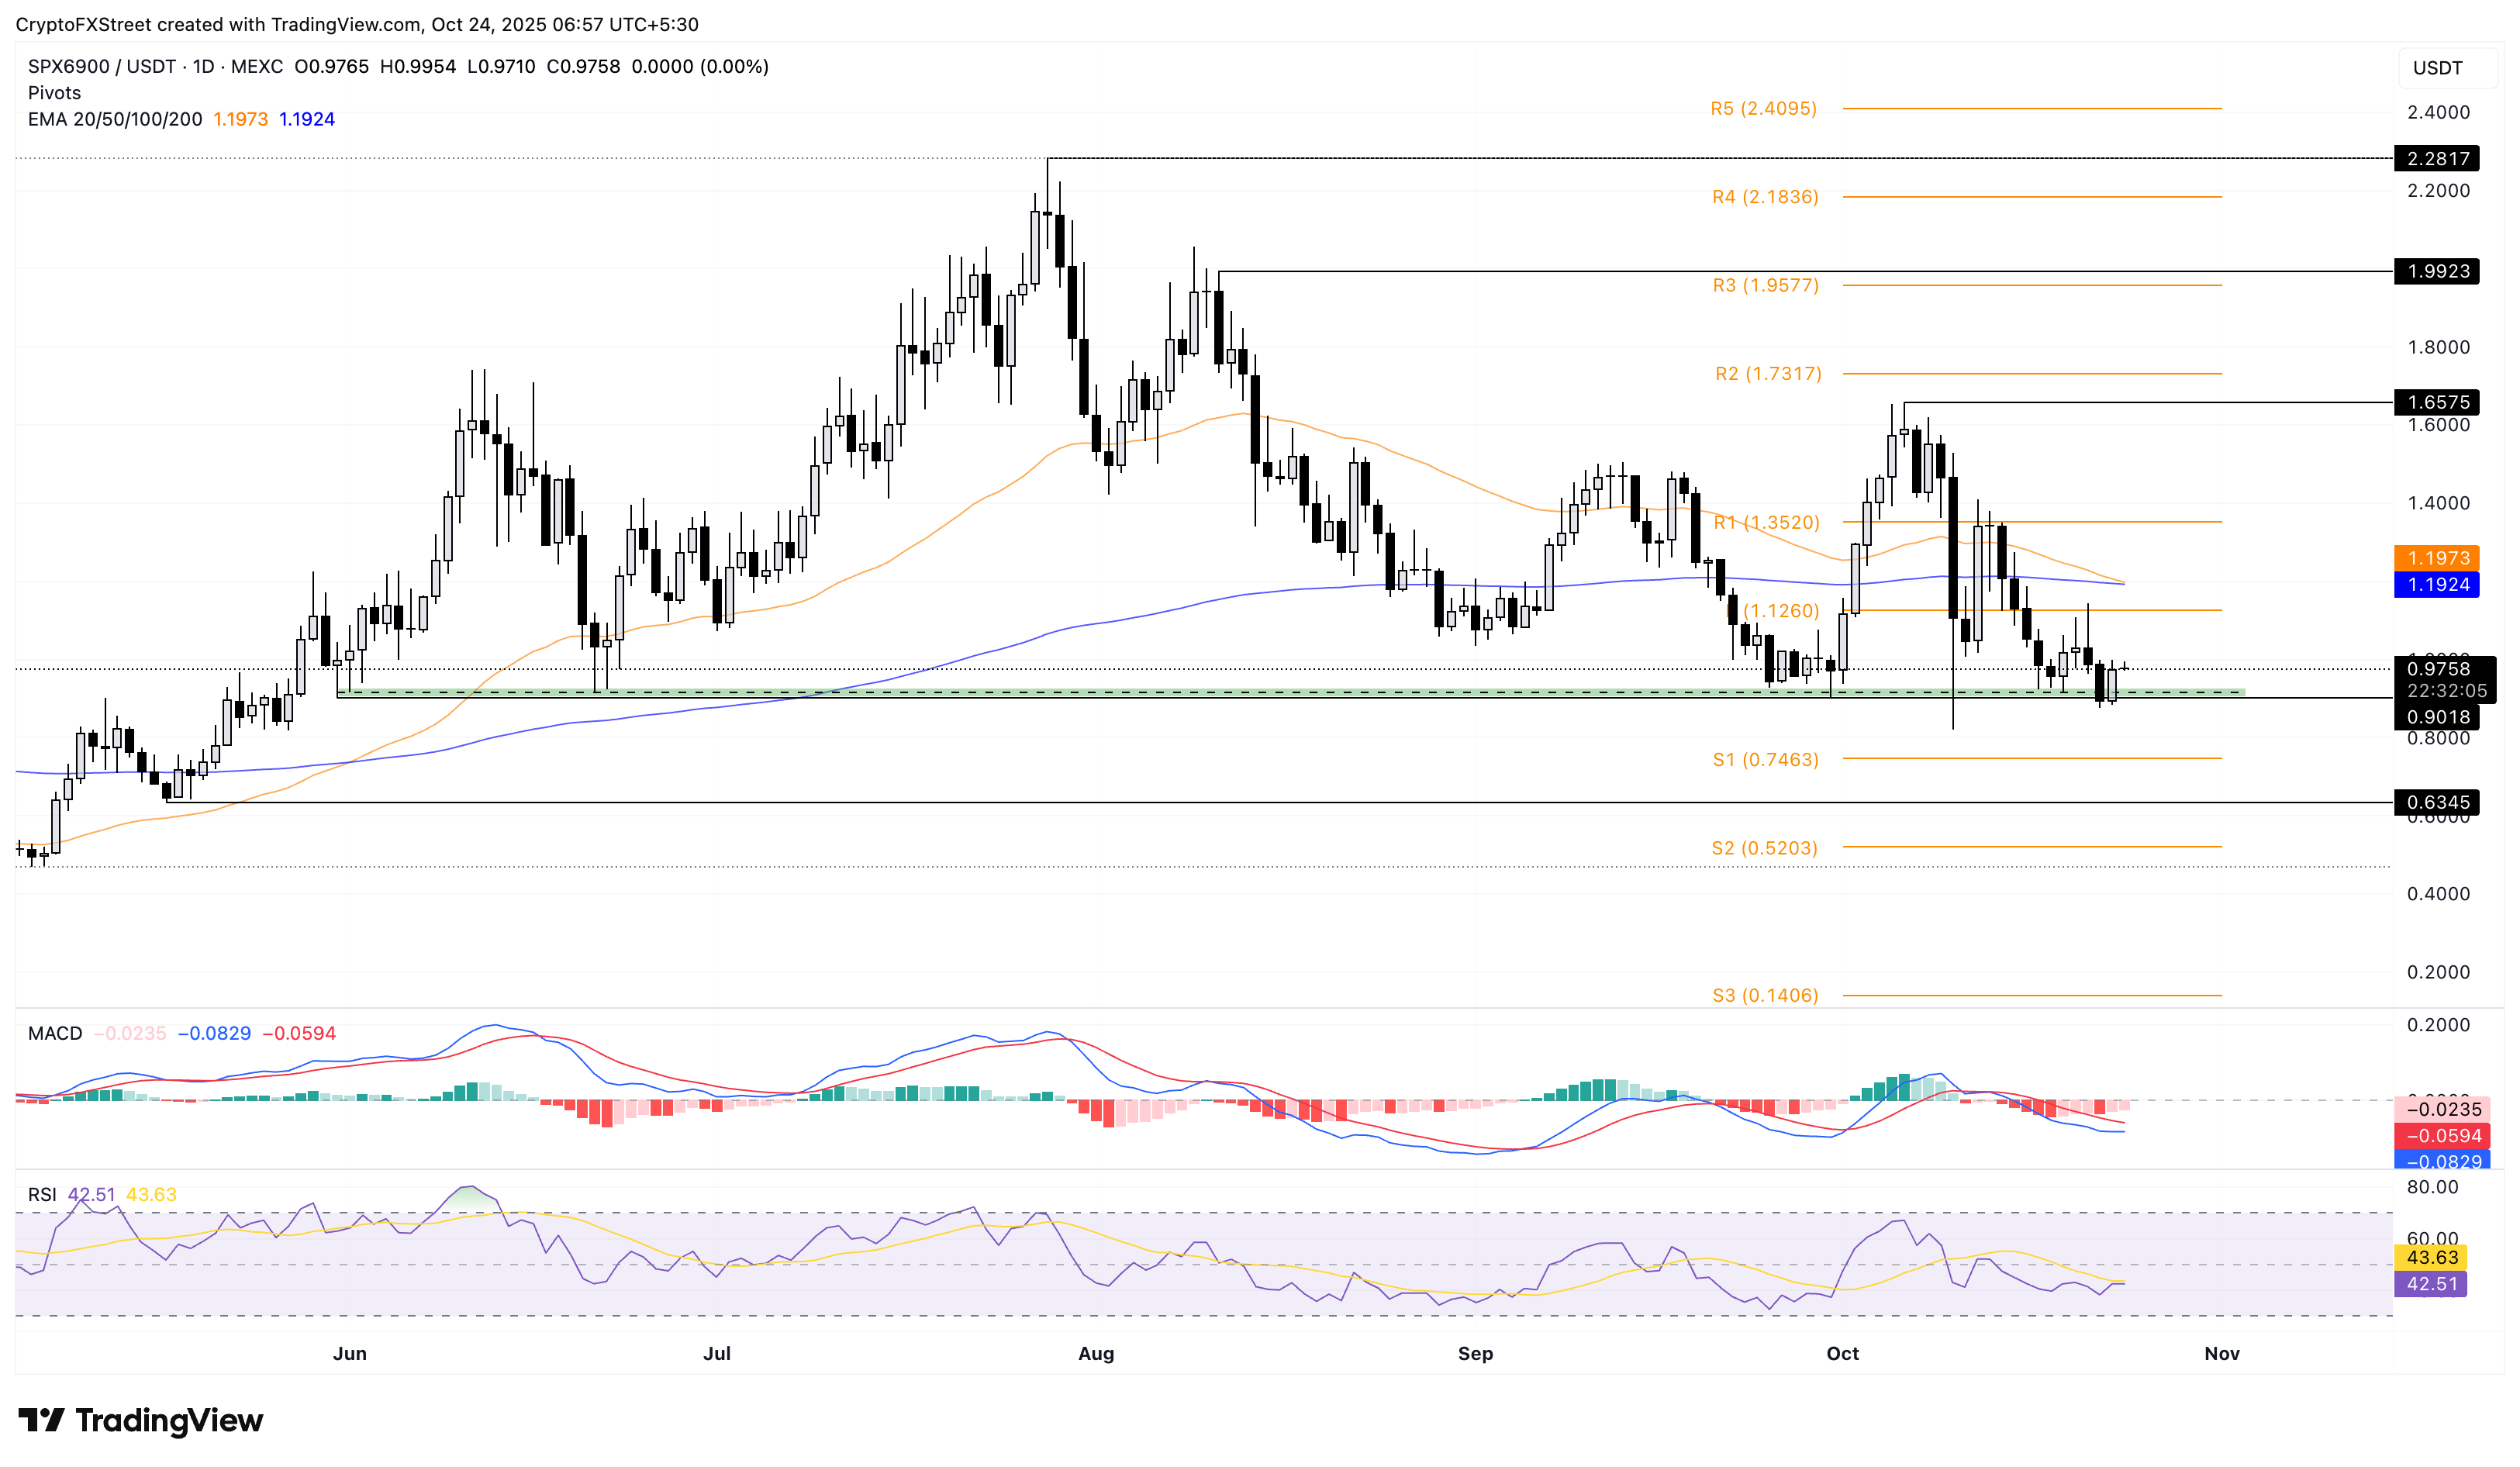
SPX/USDT daily price chart.
On the downside, if SPX slips below the $0.9018 zone, the S1 Pivot Point at $0.7463 would act as the immediate support level.

FXStreet
100만 명이 넘는 사용자가 FXStreet를 통해 실시간 시장 데이터, 차트 도구, 전문가 인사이트, 포렉스 뉴스를 이용합니다. 포괄적인 경제 캘린더와 교육 웨비나는 트레이더가 정보를 유지하고 신중한 결정을 내리도록 돕습니다. FXStreet는 바르셀로나 본사와 전 세계 지역에 걸쳐 약 60명의 팀으로 구성되어 있습니다.
Read More


