
Trade The World
Top Crypto Gainers: Zcash nears 52-week high as Aster, Mantle extend gains
작성자 Vishal Dixit
게시일: 30 Sep 2025 | 수정일: 30 Sep 2025


POPULAR ARTICLES

Zcash (ZEC), Aster (ASTER), and Mantle (MNT) spearhead the broader cryptocurrency market recovery over the last 24 hours. Zcash rally nears a crucial resistance near $76, aligning with a Fibonacci retracement level, while Aster eyes a pattern breakout rally and Mantle trades within a rising wedge.
- The Zcash rally nears a crucial resistance level that has remained intact for the last three years.
- Aster breaks out of a symmetrical triangle pattern that could push recovery above $2.
- Mantle extends into price discovery mode while forming a rising wedge pattern, underscoring the downside risk.
Zcash (ZEC), Aster (ASTER), and Mantle (MNT) spearhead the broader cryptocurrency market recovery over the last 24 hours. Zcash rally nears a crucial resistance near $76, aligning with a Fibonacci retracement level, while Aster eyes a pattern breakout rally and Mantle trades within a rising wedge.
Zcash eyes to reclaim the $100 psychological level
Zcash trades positively for the fifth consecutive week, inching closer to the 52-week high of $78.95. At the time of writing, ZEC holds steady above $70.00 on Tuesday following the 18% gains from the previous day.
The privacy coin approaches a crucial resistance zone on the weekly chart, which has remained intact since early August 2022, located slightly above $75.00. This zone aligns with the 50% retracement level at $76.62, which is retraced from the $372.00 peak from 10 May 2021 to the $15.78 low from July 1, 2024.
A decisive weekly close above this level could extend the ZEC rally to the 61.8% Fibonacci retracement level at $111.24.
The momentum indicators on the weekly chart suggest a buy-side dominance, as the Relative Strength Index (RSI) at 70 steps onto the overbought boundary line, indicating increased buying pressure. Additionally, the Moving Average Convergence Divergence (MACD) exhibits a steady rise, with its signal line indicating an increase in bullish momentum.
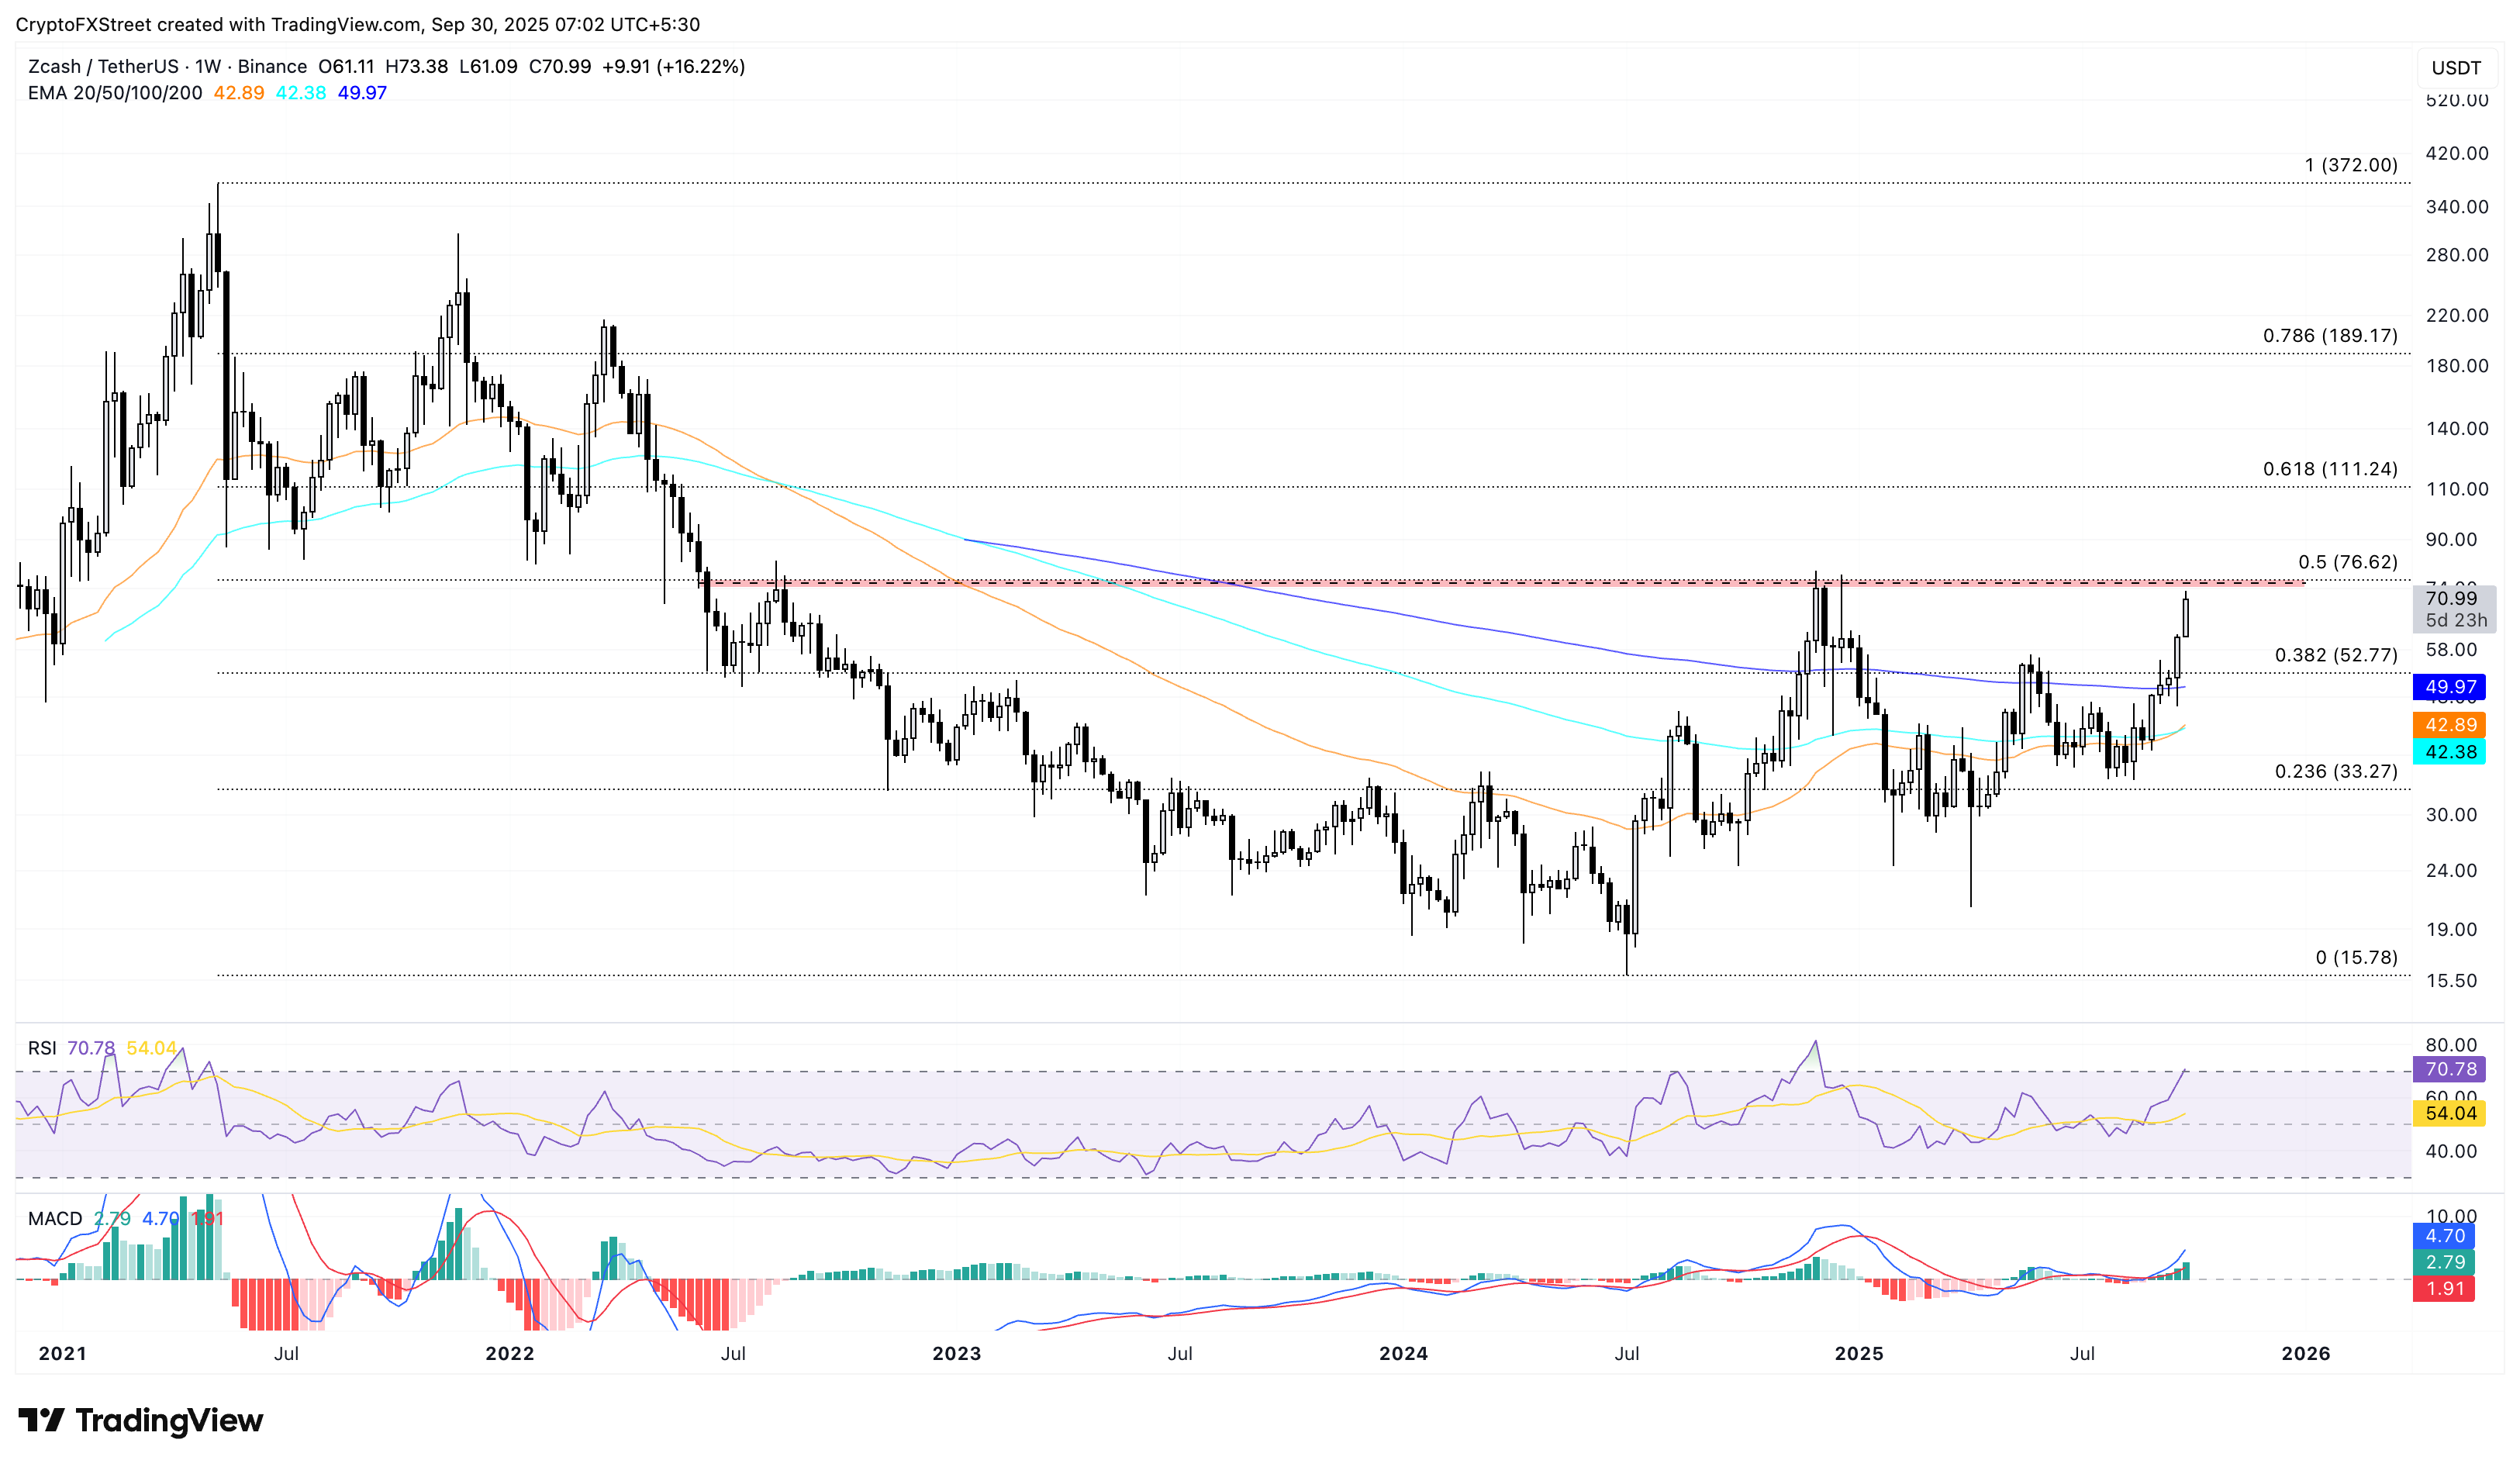
ZEC/USDT daily price chart.
If ZEC reverses from $76.62, the 38.2% Fibonacci retracement level at $52.77 could act as the immediate support.
Aster rally faces final test at the $2.00 mark
Aster edges higher by 2% at press time on Tuesday, advancing the 2.29% rise from Monday. The recovery run exceeds the symmetrical triangle pattern on the 4-hour chart, fueling the anticipation of a bullish rebound.
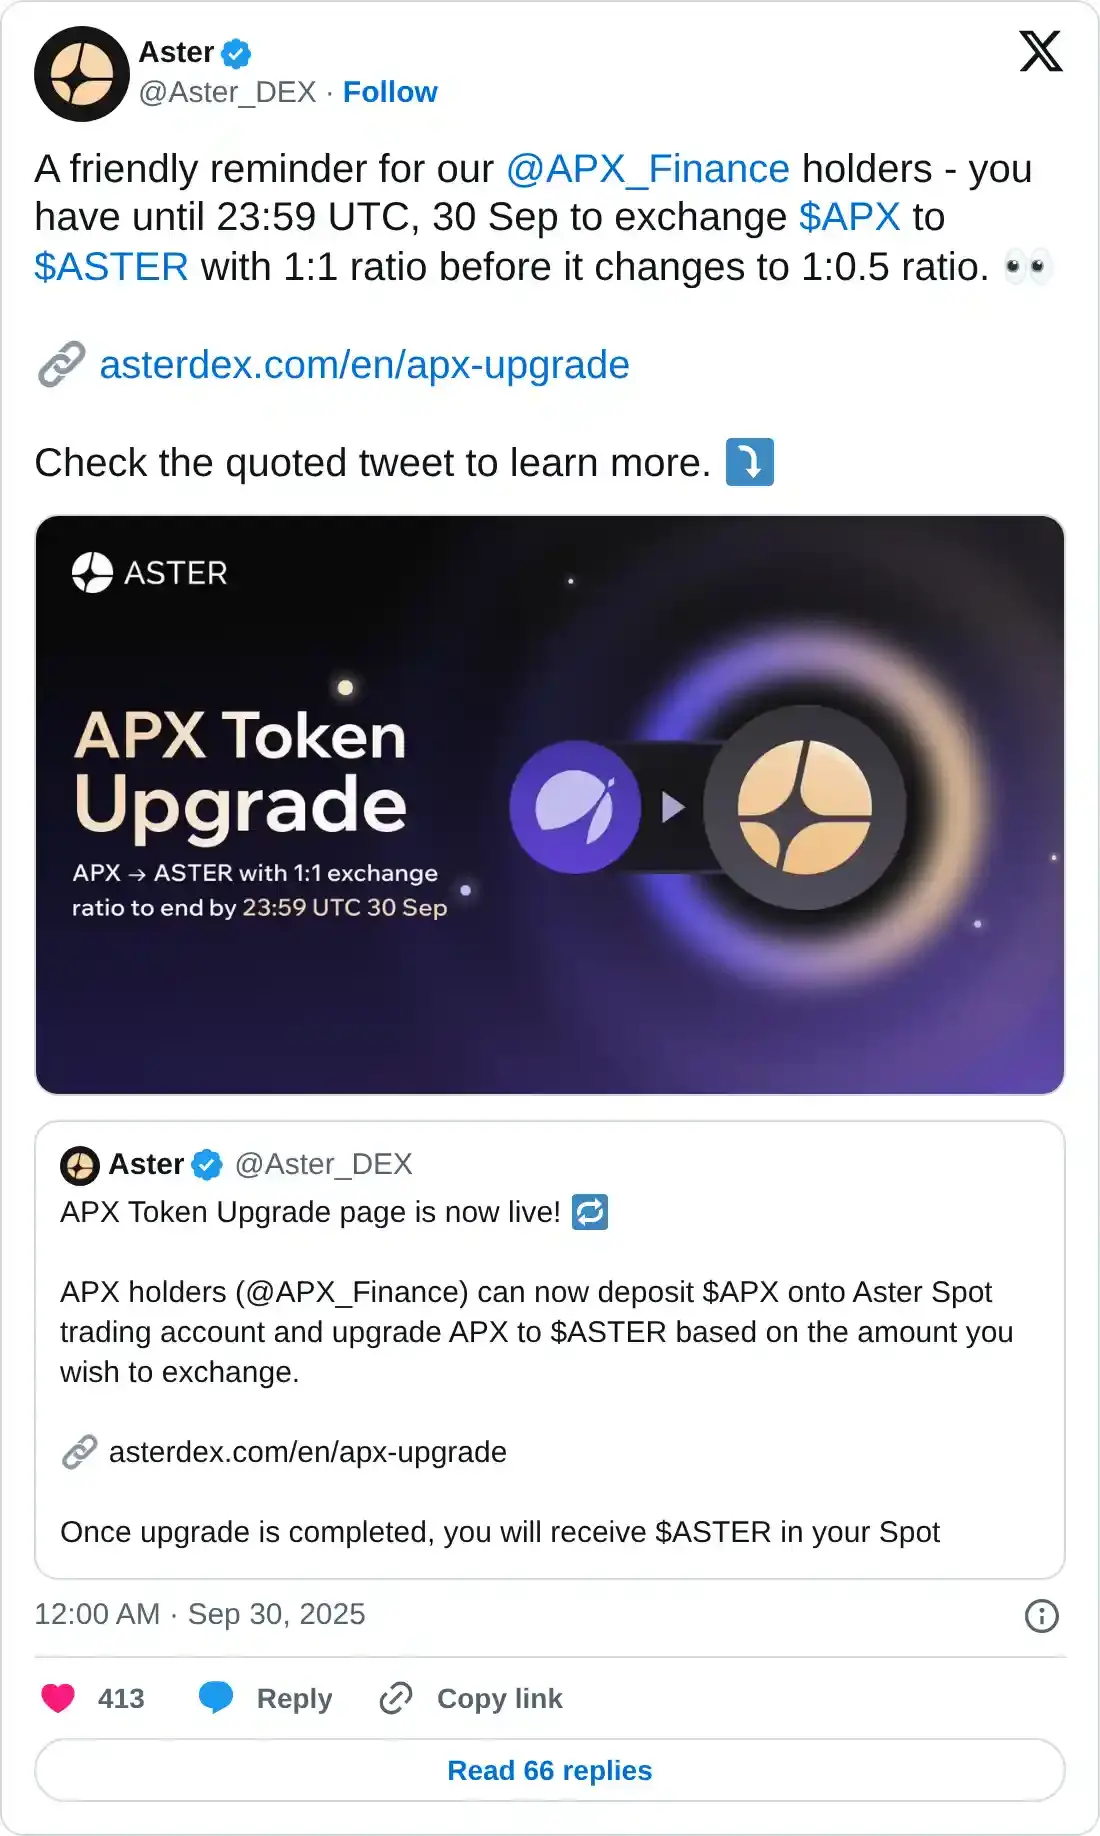
Adding to the demand, the final date to swap APX Finance’s APX token to ASTER at a 1:1 ratio is scheduled for September 30. To boost this token swap, which could increase ASTER’s demand, the swap ratio will be dropped to 1:0.5 after the deadline.
If the triangle breakout rally exceeds the $2.00 psychological mark, it could target the R1 pivot resistance at $2.43.
The RSI on the 4-hour chart slopes upwards from the halfway line with further space for growth before reaching the overbought zone. Additionally, the MACD converges with its signal line, indicating a potential crossover that signals a bullish shift in momentum.
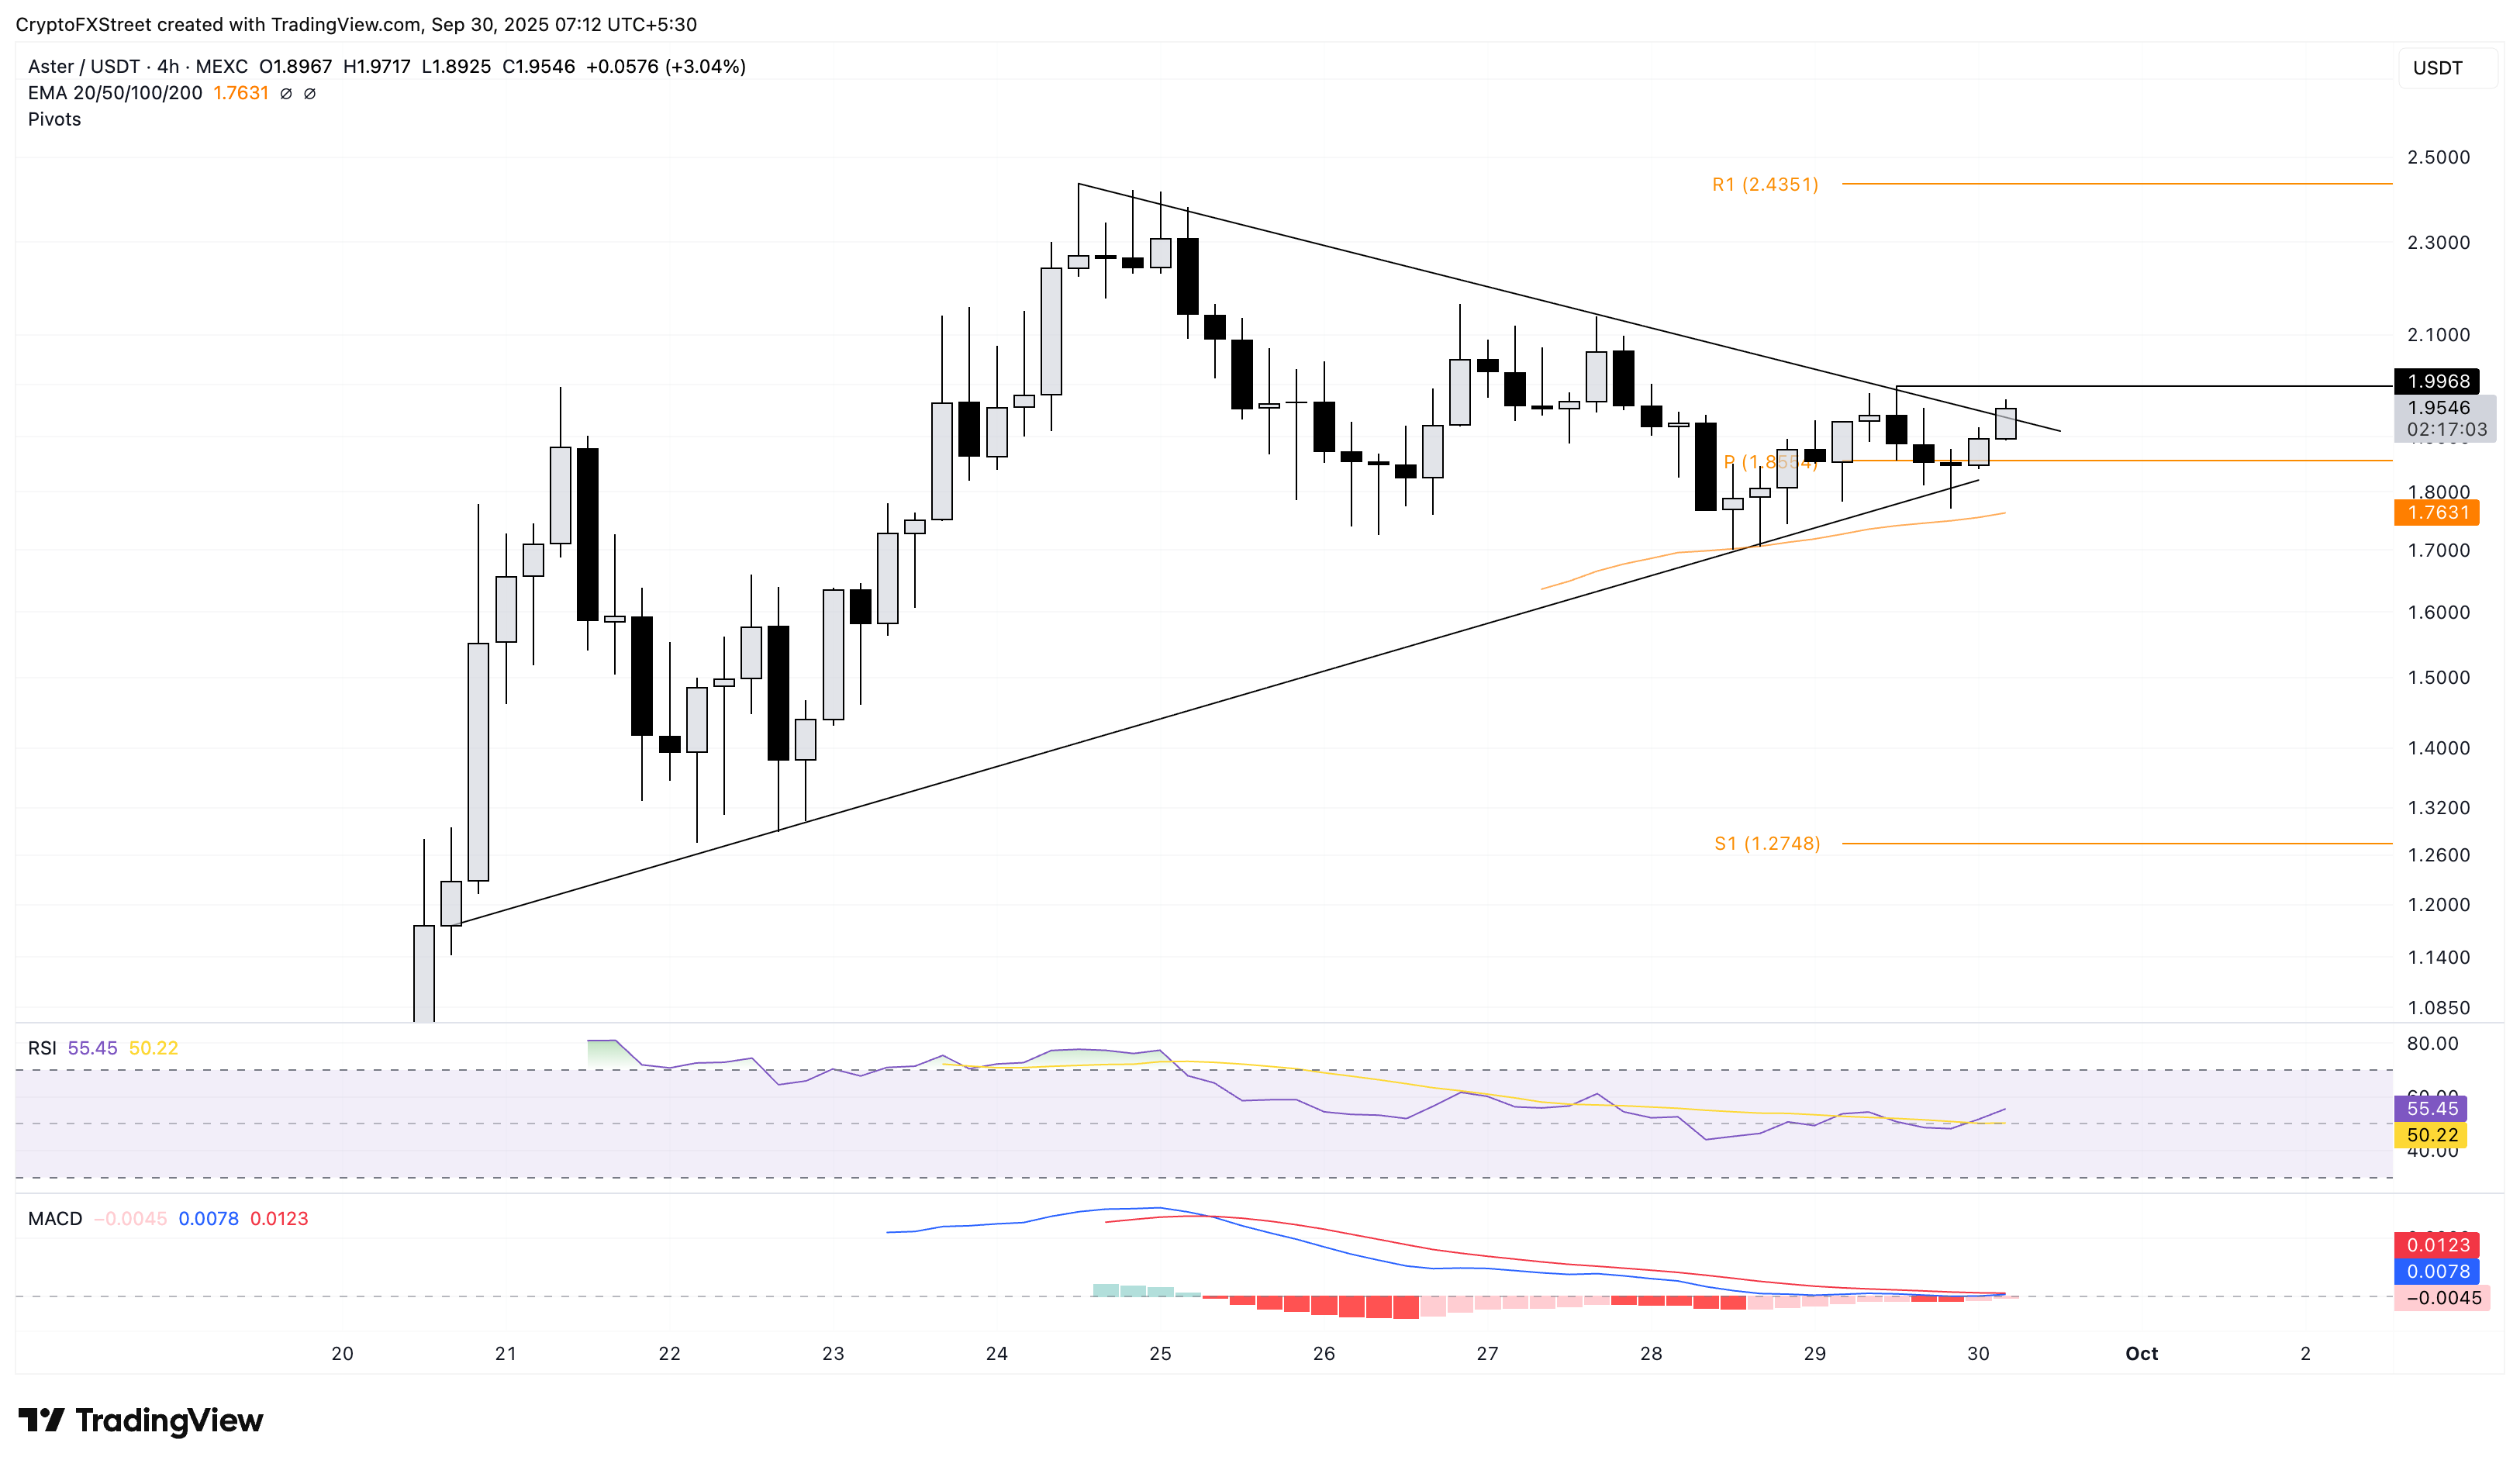
ASTER/USDT 4-hour price chart.
On the flip side, crucial areas of support are the centre pivot level at $1.85, followed by the 50-period Exponential Moving Average (EMA) at $1.76.
Mantle hits a new record-high
Mantle ticks lower by 2% at the time of writing on Tuesday, following a 7.60% rise on Monday, which marked a new record high of $1.95. The intraday pullback highlights the overhead pressure within a rising wedge pattern formed on the daily chart.
If the pullback deepens, crucial support levels for MNT are at the R2 resistance-turned-support pivot level at $1.80, followed by the support trendline at $1.67.
Validating the saturation in bullish momentum, the RSI at 63, pointing downwards, hovers sideways below the overbought zone. Furthermore, the MACD converges with its signal line, indicating indecisiveness in the short term.
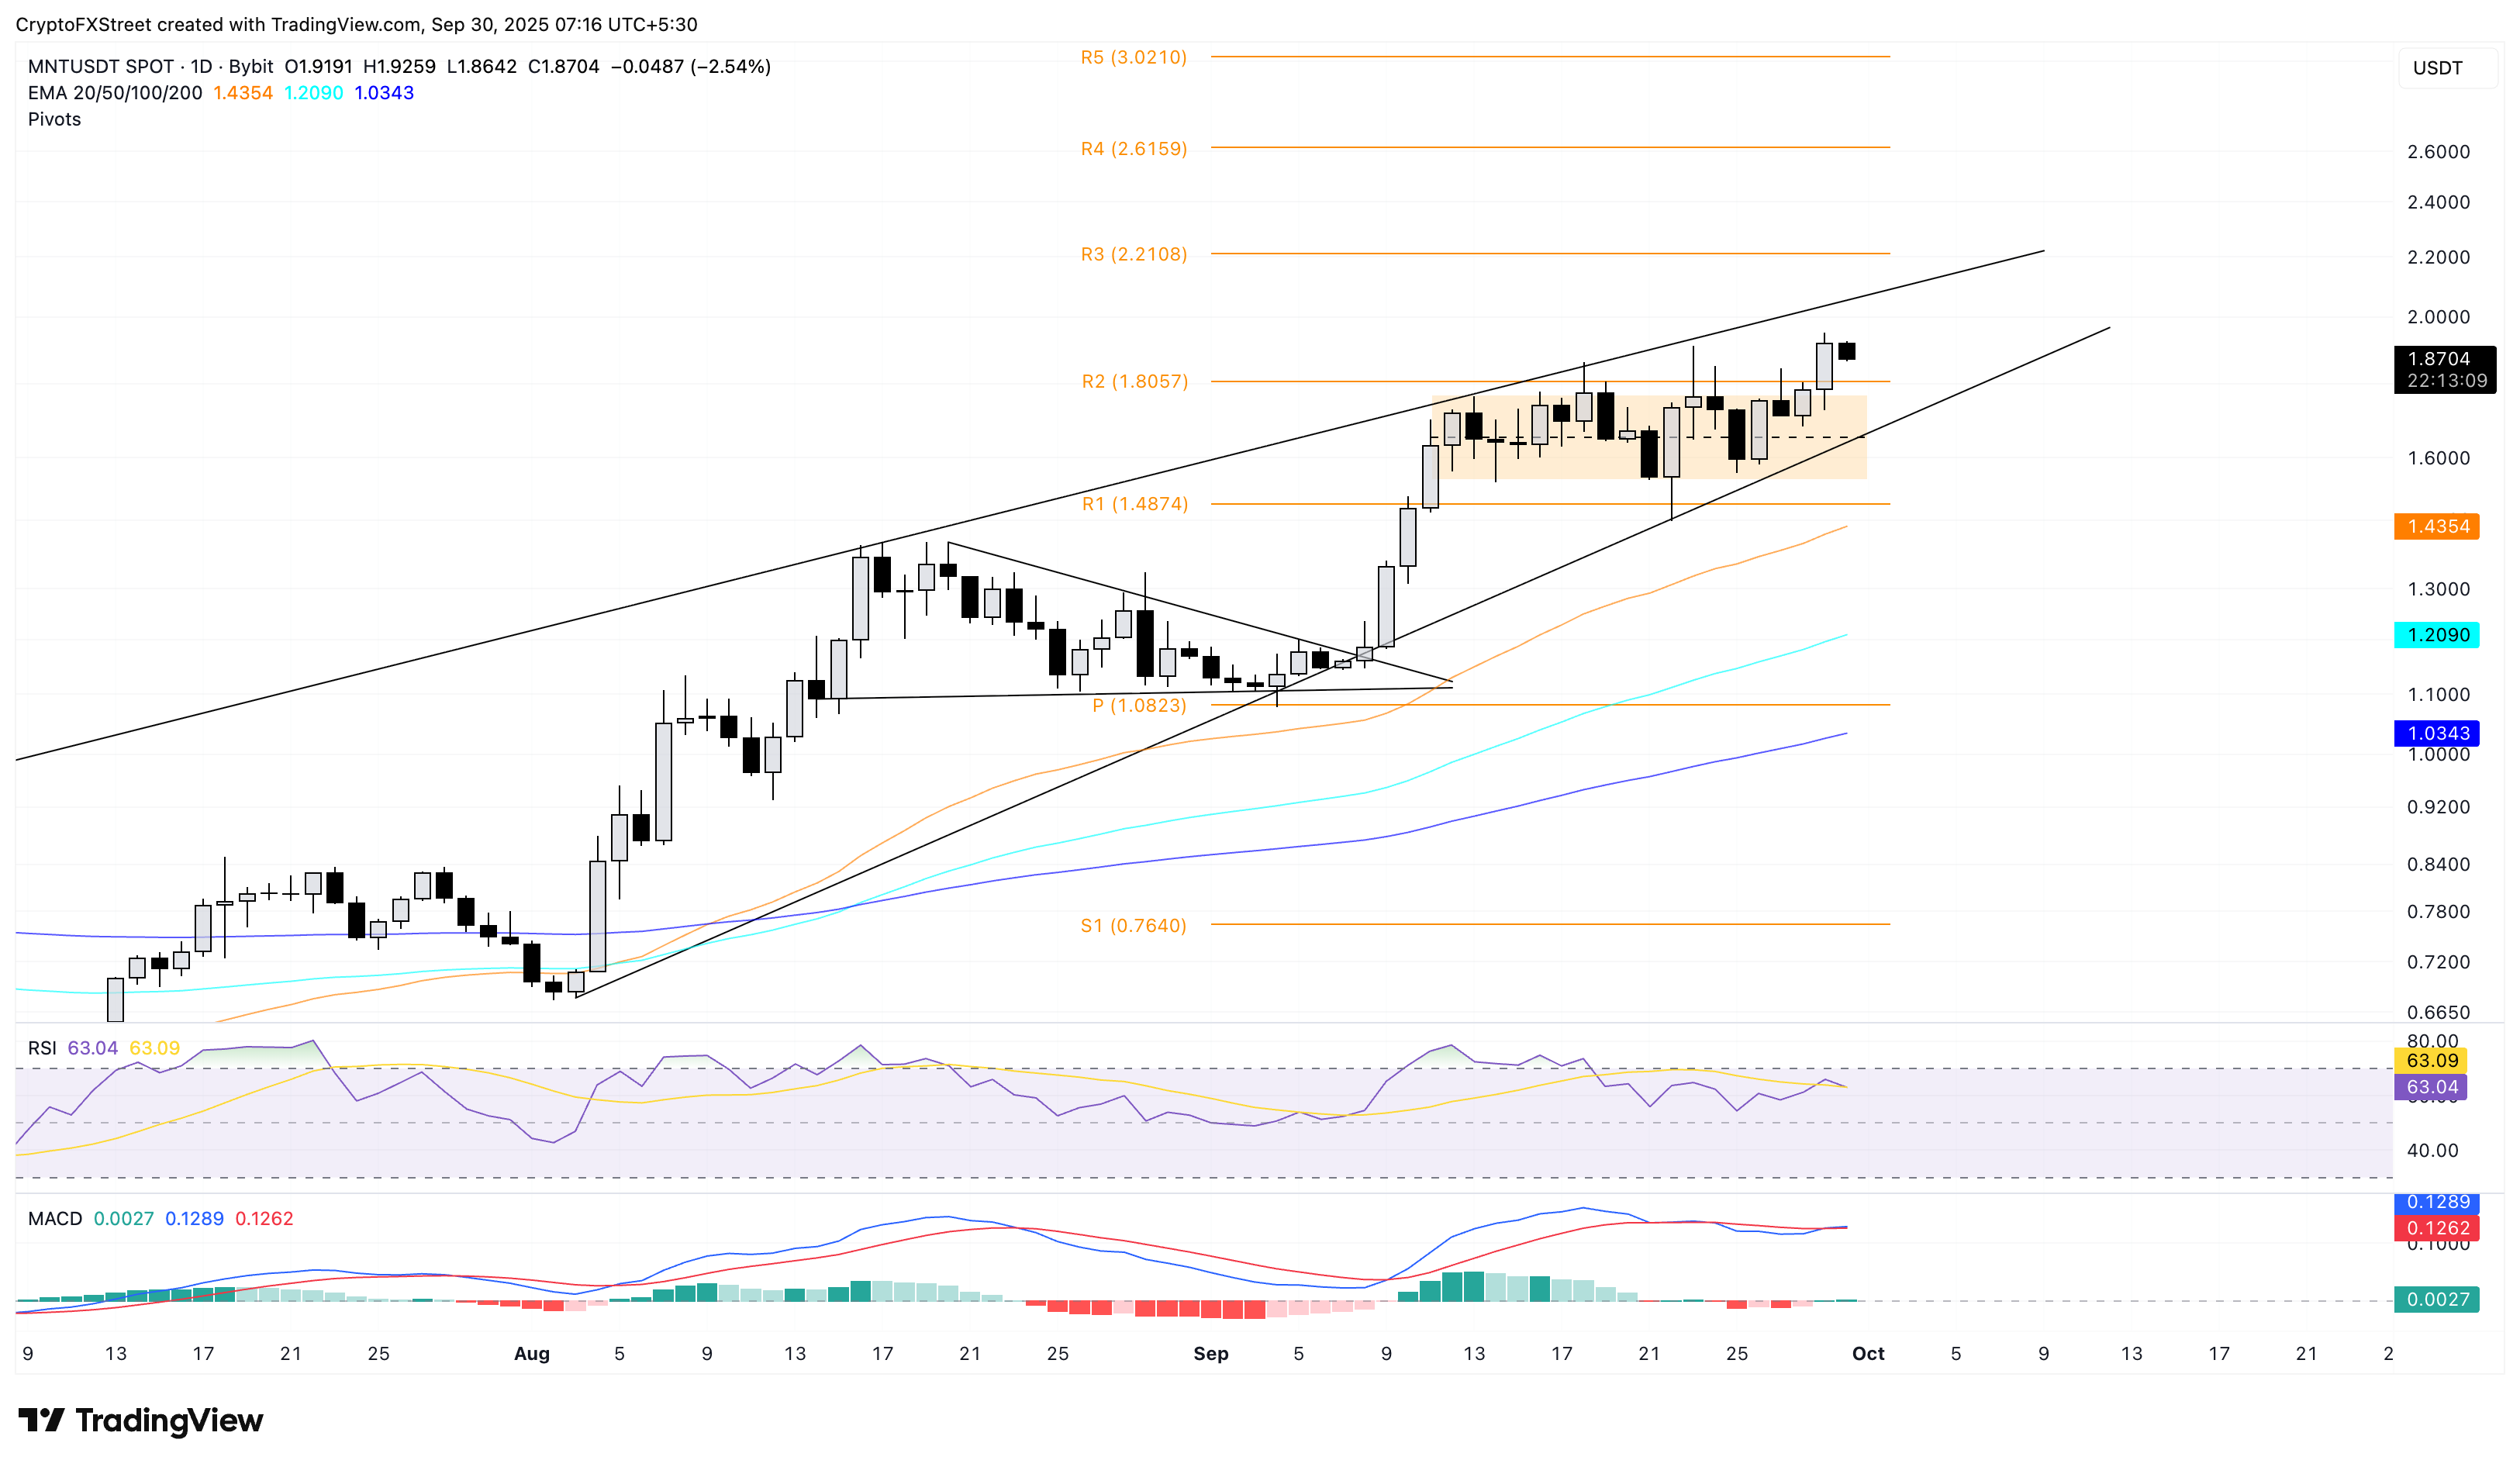
MNT/USDT daily price chart.
If the MNT rally exceeds the resistance trendline to hit the R3 pivot level at $2.21, it could invalidate the rising wedge pattern. This extension into the price discovery mode could target the R4 pivot level at $2.81.

FXStreet
100만 명이 넘는 사용자가 FXStreet를 통해 실시간 시장 데이터, 차트 도구, 전문가 인사이트, 포렉스 뉴스를 이용합니다. 포괄적인 경제 캘린더와 교육 웨비나는 트레이더가 정보를 유지하고 신중한 결정을 내리도록 돕습니다. FXStreet는 바르셀로나 본사와 전 세계 지역에 걸쳐 약 60명의 팀으로 구성되어 있습니다.
Read More


