
Trade The World
Tron recovery extends as retail demand surges despite revenue drop
작성자 Vishal Dixit
게시일: 12 Sep 2025 | 수정일: 12 Sep 2025


POPULAR ARTICLES

Tron (TRX) price extends the uptrend by nearly 1% at press time on Friday, building on the 2.36% rise from the previous day on the back of rising retail demand. Both the technical outlook and derivatives data suggest a bullish incline as traders anticipate further recovery.
- Tron extends the recovery for the fifth day, forming a V-shaped pattern.
- Derivatives market signals increased retail demand for Tron.
- On-chain data show a significant decline in network revenue.
Tron (TRX) price extends the uptrend by nearly 1% at press time on Friday, building on the 2.36% rise from the previous day on the back of rising retail demand. Both the technical outlook and derivatives data suggest a bullish incline as traders anticipate further recovery.
Tron retail demand surges, ignoring revenue slump
The retail demand for Tron is on the rise, resulting in a surge in TRX Open Interest (OI) and short liquidations. CoinGlass data shows that the TRX OI has surged by nearly 2% over the last 24 hours, reaching $476.95 million. This upsurge in capital inflows in TRX highlights the increased demand among traders.
Additionally, the short liquidations over the last 24 hours stand at $245,750, outpacing the long liquidations of $35,310, reflecting a larger wipeout of bearish-aligned positions. This boosts the long-to-short ratio to 1.0255, where values above 1 indicate a greater number of active long positions.
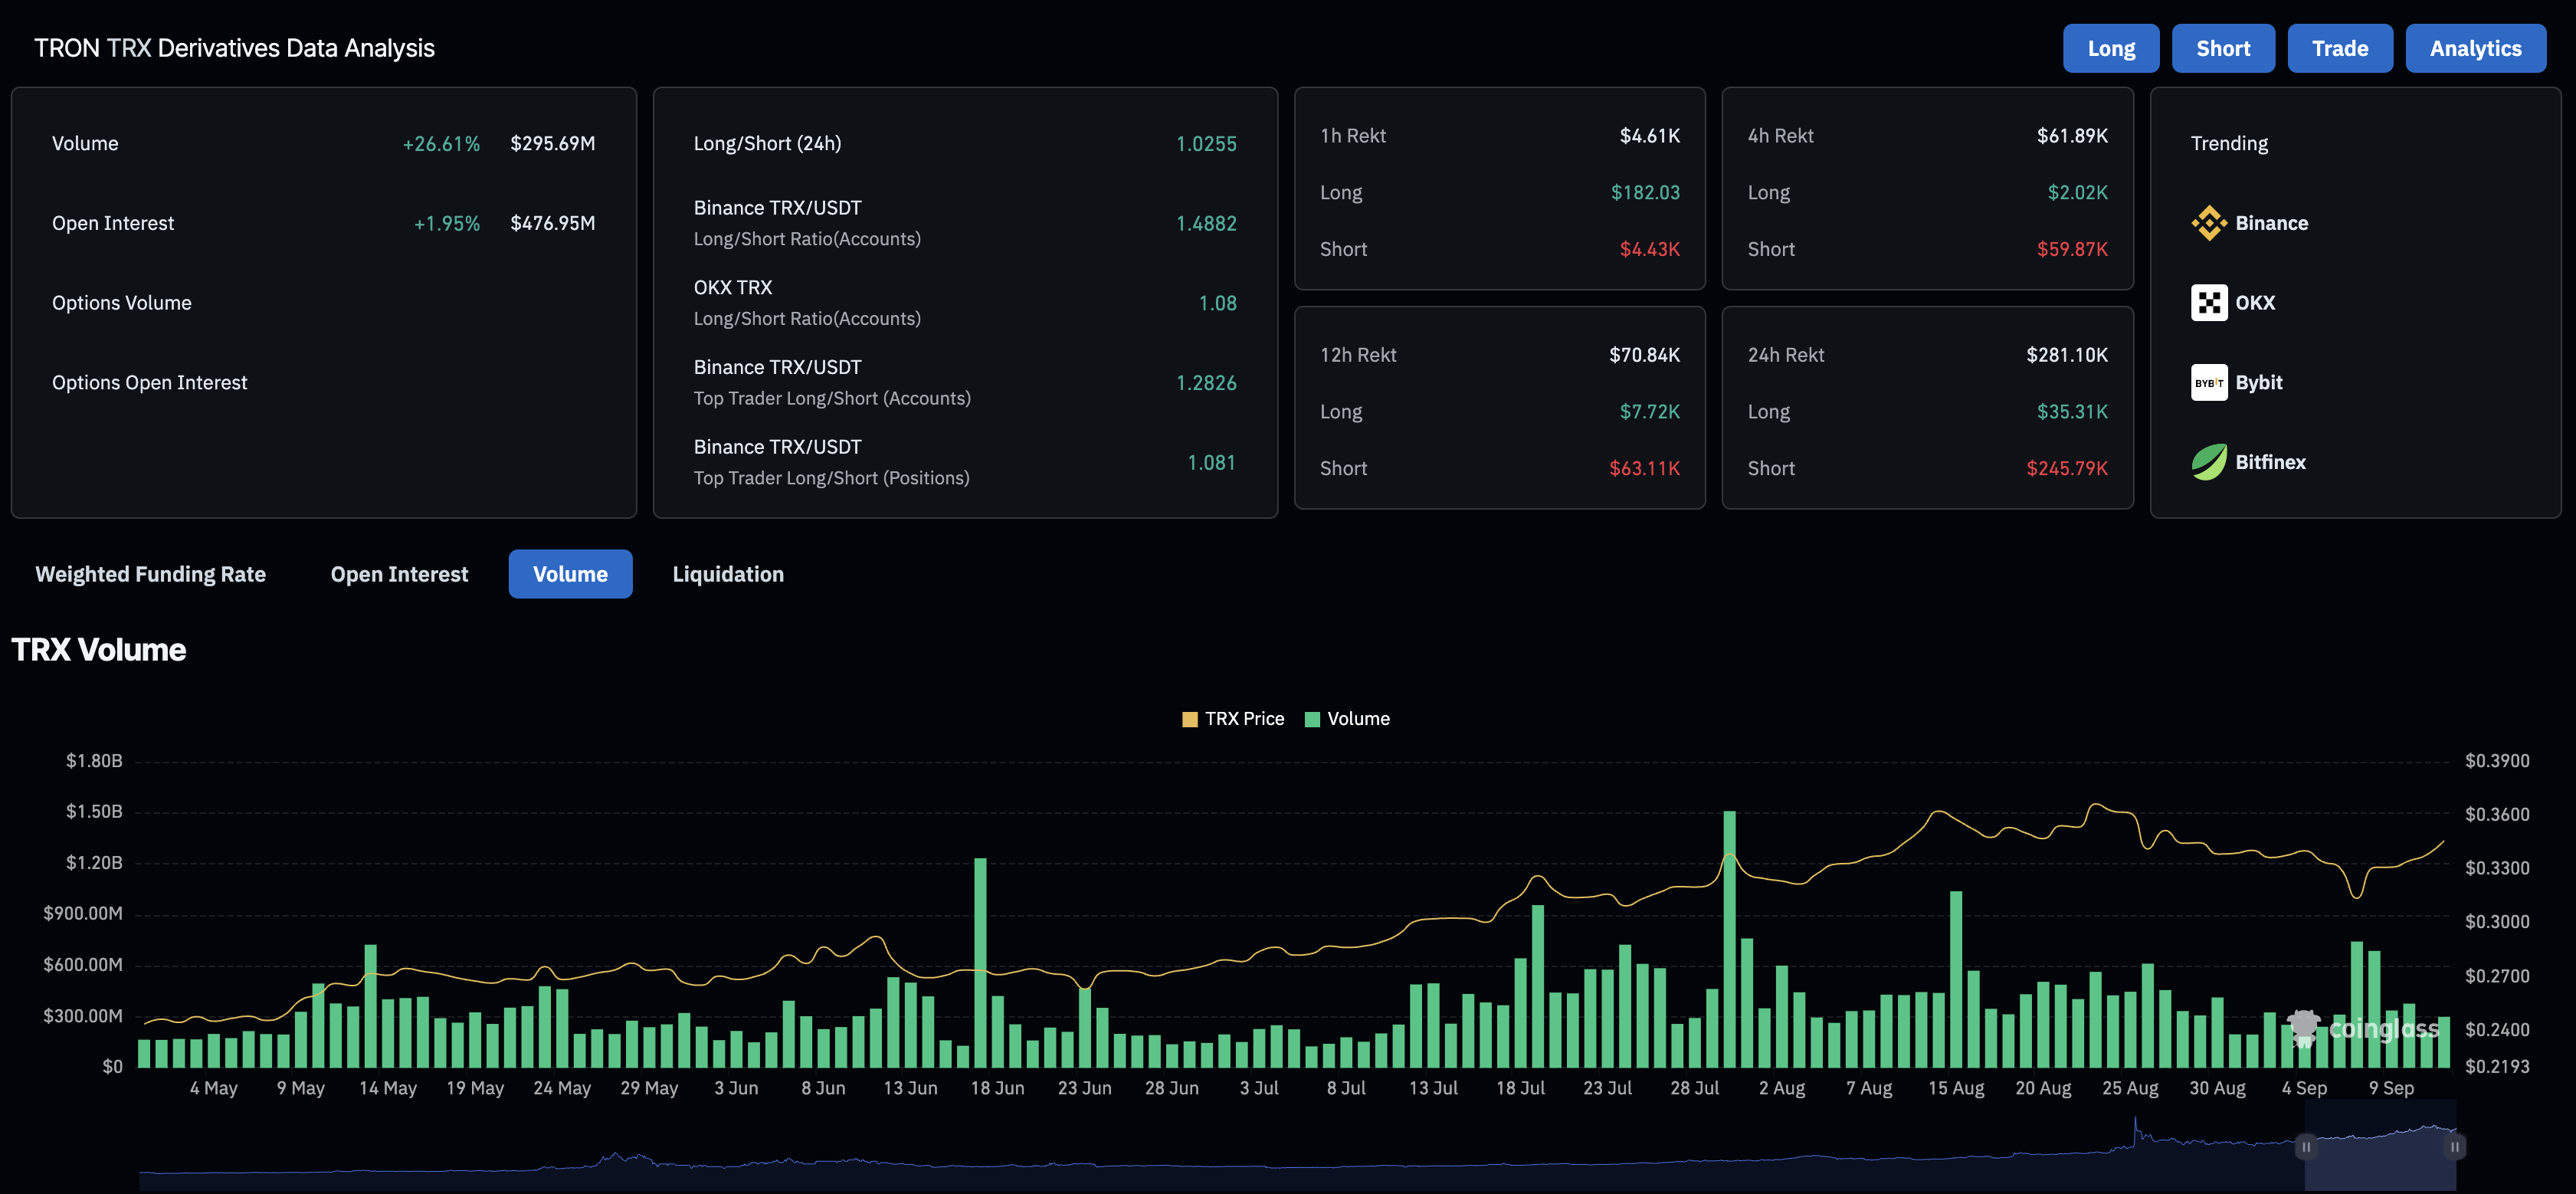
TRX Derivatives. Source: Coinglass
Meanwhile, the on-chain data reveals an underlying weakness, as network revenue has dropped significantly this week. TronScan data shows that the total protocol revenue collected on Thursday amounted to $7.99 million. This represents a significant decrease in revenue compared to the late August collections of over $15 million.
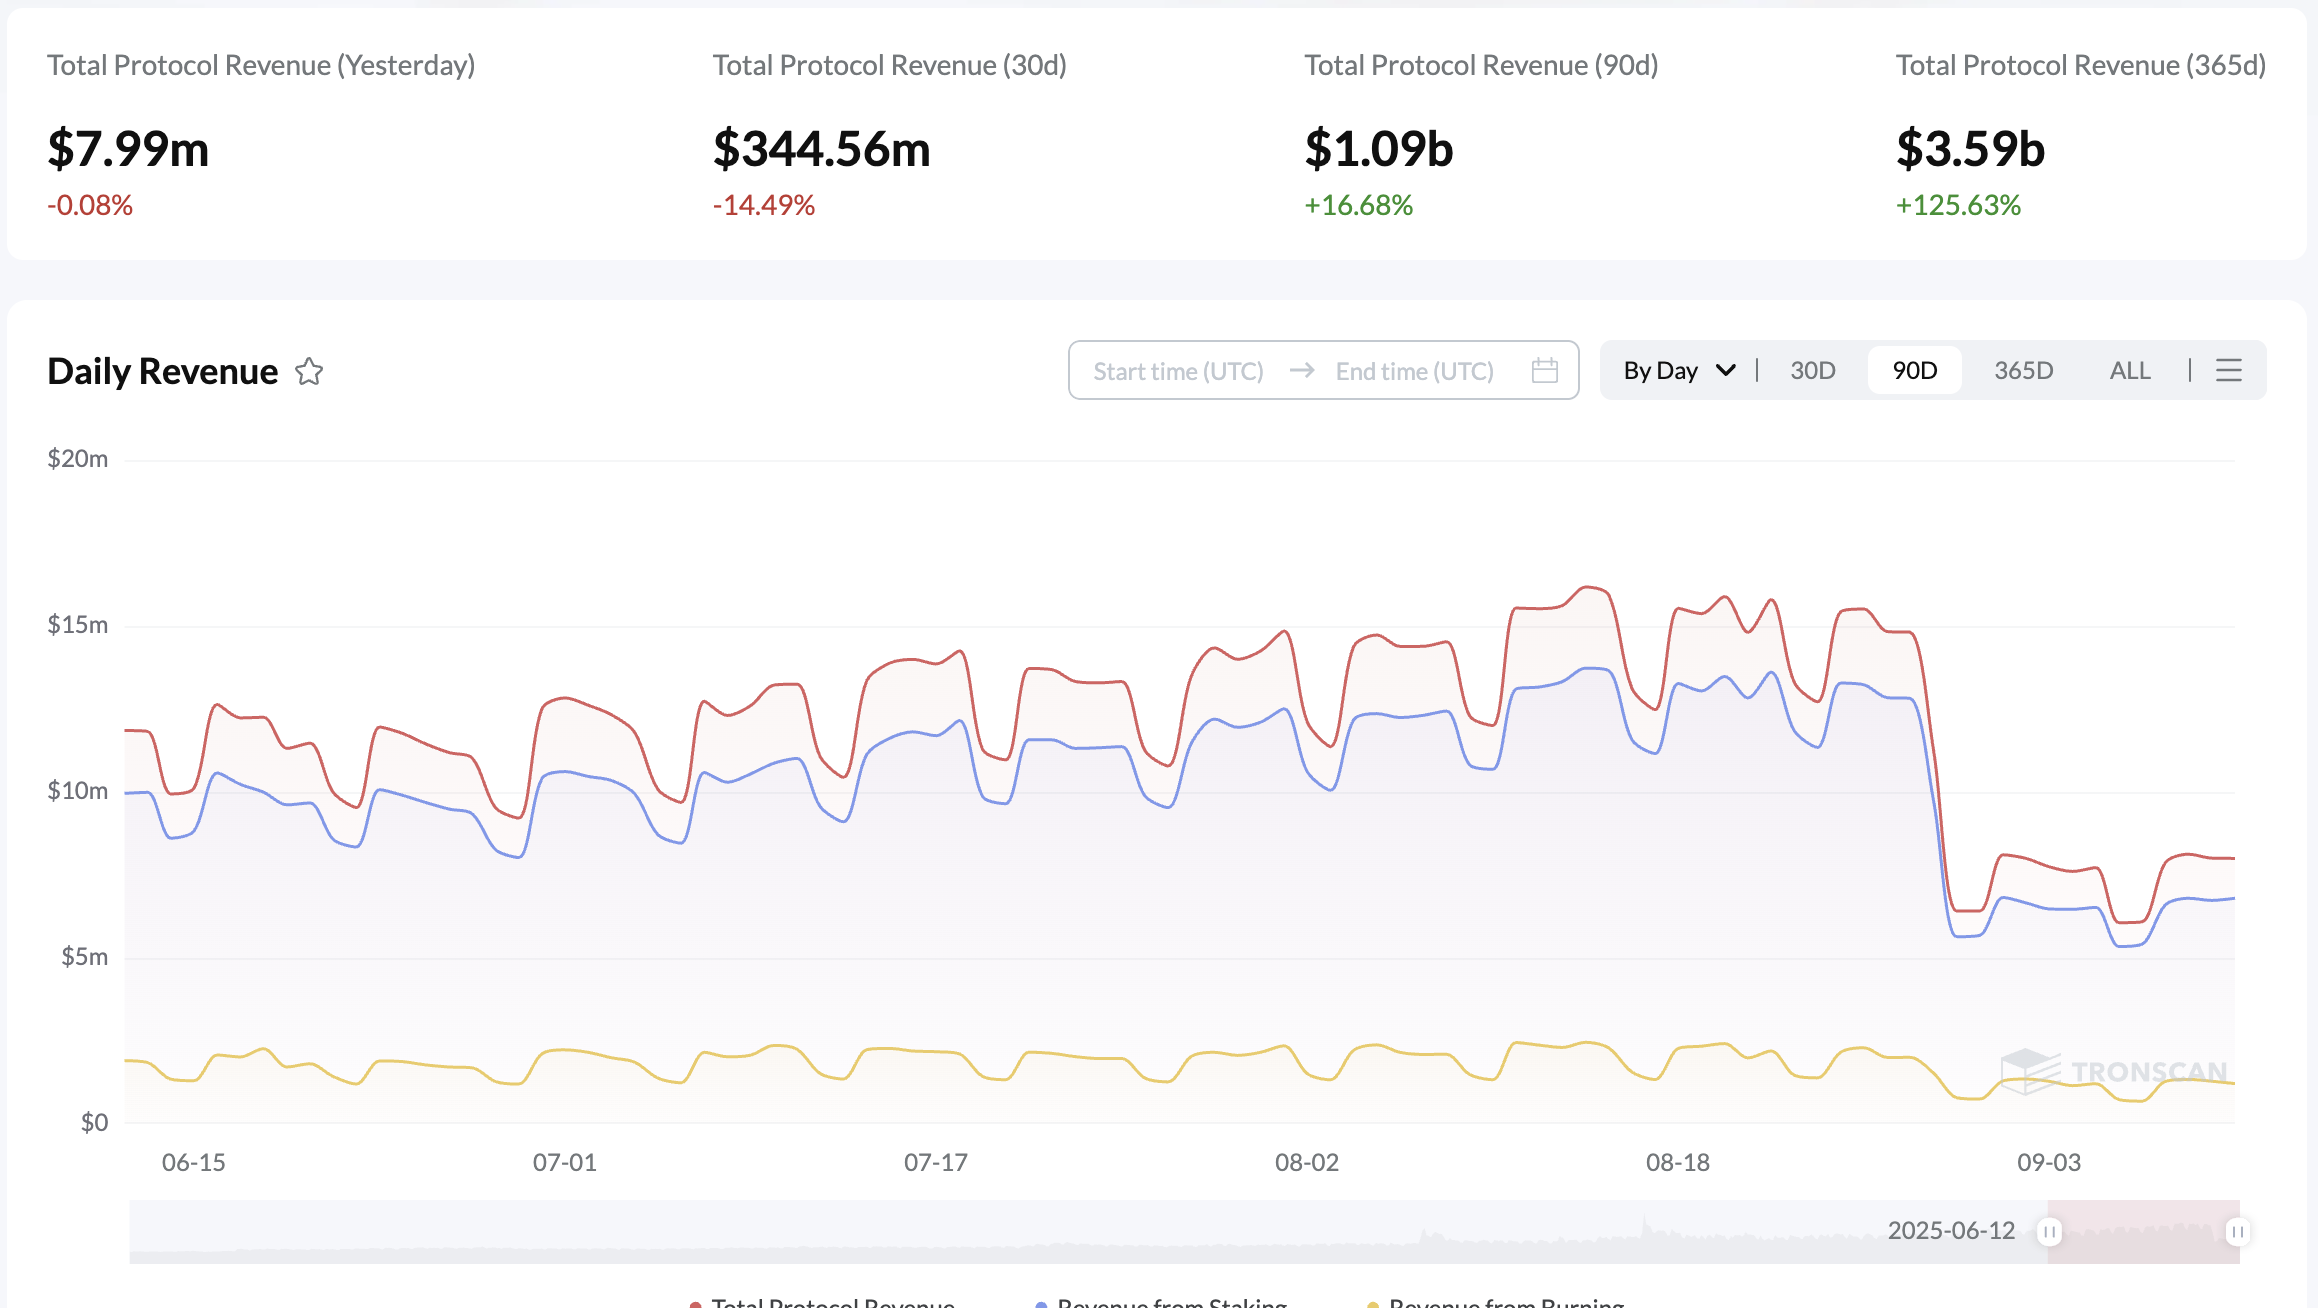
Tron network revenue. Source: TronScan
Tron eyes a V-shaped pattern breakout
Tron forms a V-shaped recovery pattern on the daily chart by bouncing off the 100-day Exponential Moving Average following the rising channel breakdown in late August. At the time of writing, Tron trades above $0.3400 on Friday, inching close to the $0.3510 resistance marked by the July 29 high, which also acts as the neckline of the V-shaped pattern.
A decisive close above this level could prolong the Tron rally to the $0.3700 mark, aligning with the August 14 high.
Adding to the bullish potential, the momentum indicators on the daily chart project a positive shift. The Moving Average Convergence Divergence (MACD) crosses above its signal line, resulting in a fresh green histogram bar above the zero line, which indicates that the bullish momentum is resurfacing.
Additionally, the Relative Strength Index (RSI) at 57 slopes upward toward the overbought zone, suggesting that the buying pressure is increasing.
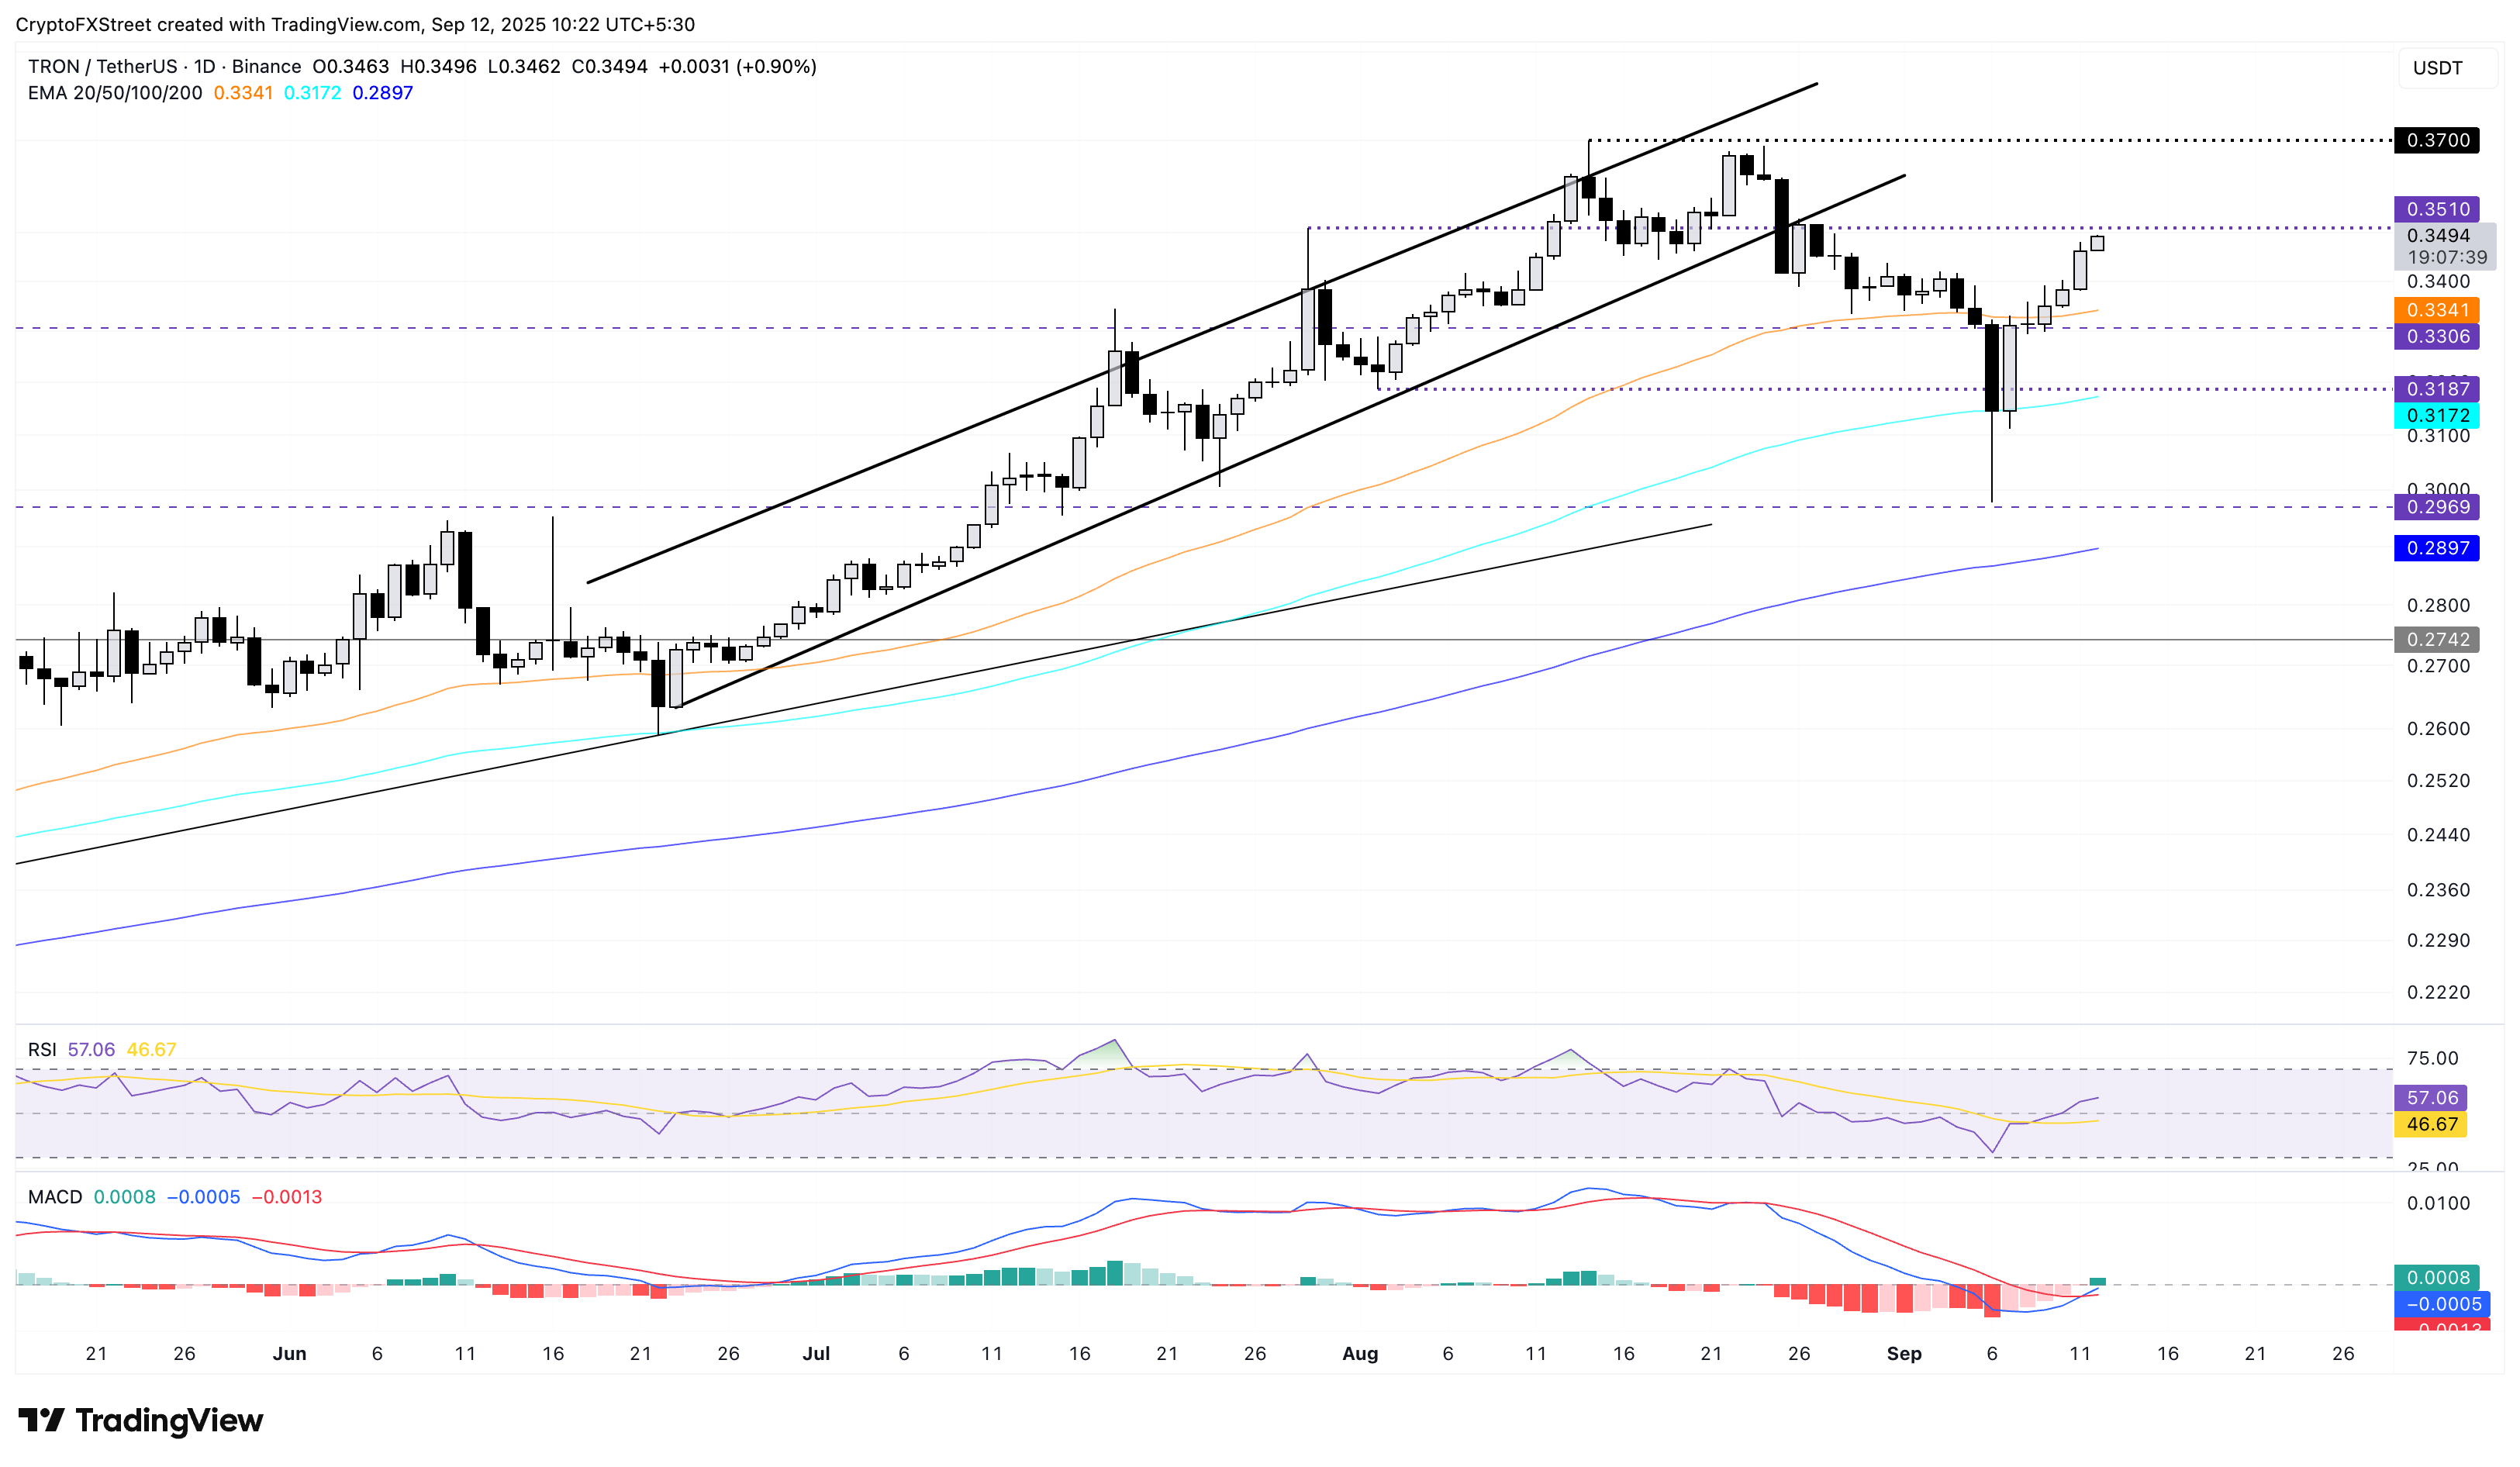
TRX/USDT daily price chart.
Looking down, if TRX flips from the $0.3510 resistance level, it could decline to the 50-day EMA at $0.3341.

FXStreet
100만 명이 넘는 사용자가 FXStreet를 통해 실시간 시장 데이터, 차트 도구, 전문가 인사이트, 포렉스 뉴스를 이용합니다. 포괄적인 경제 캘린더와 교육 웨비나는 트레이더가 정보를 유지하고 신중한 결정을 내리도록 돕습니다. FXStreet는 바르셀로나 본사와 전 세계 지역에 걸쳐 약 60명의 팀으로 구성되어 있습니다.
Read More


