
Trade The World
USD/CAD Price Forecast: Holds losses below 1.3950, lower rectangle boundary
작성자 Akhtar Faruqui
게시일: 29 Oct 2025 | 수정일: 29 Oct 2025


POPULAR ARTICLES

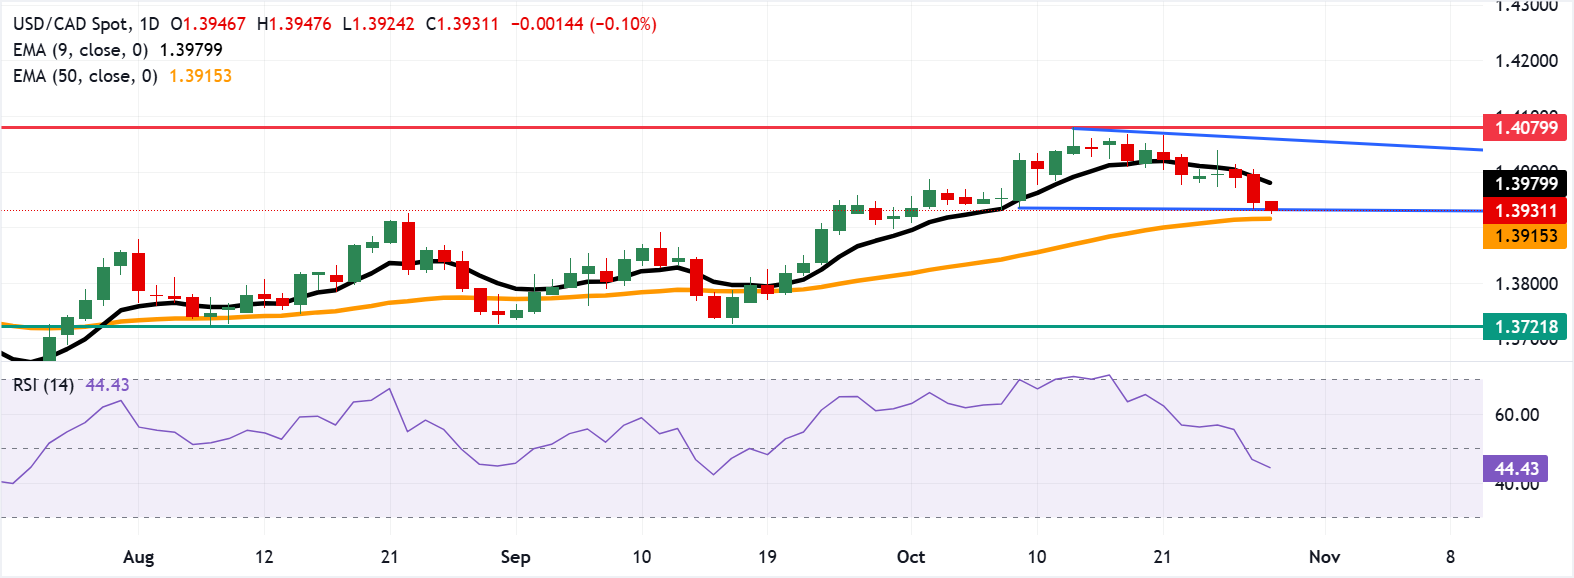
USD/CAD extends its losses for the third successive session, trading around 1.3930 during the early European hours on Wednesday. The short-term price momentum is weaker as the pair is falling below the nine-day Exponential Moving Average (EMA).
- USD/CAD may find immediate support at the 50-day EMA at 1.3915.
- The 14-day Relative Strength Index has slipped below the 50 mark, signaling increasing selling pressure.
- The primary barrier lies at the nine-day EMA of 1.3979.
USD/CAD extends its losses for the third successive session, trading around 1.3930 during the early European hours on Wednesday. The short-term price momentum is weaker as the pair is falling below the nine-day Exponential Moving Average (EMA). Additionally, the 14-day Relative Strength Index (RSI) has moved below the 50 level, suggesting a shift in momentum toward bearish territory.
The technical analysis of the daily chart suggests a potential bearish shift, as the USD/CAD pair is positioned slightly below the lower boundary of the rectangle pattern. Traders will likely follow through for bearish confirmation and avoid any bear trap.
On the downside, the immediate support lies at the 50-day EMA at 1.3915, followed by the psychological level of 1.3900. A break below this crucial support zone would indicate a bearish continuation and put downward pressure on the USD/CAD pair to navigate the region around the “throwback support” near the three-month low of 1.3721, which was recorded on August 7.
A rebound to the rectangle would continue the USD/CAD pair to walk sideways, targeting the initial barrier at the nine-day EMA of 1.3979. A break above this level would strengthen the short-term price momentum and support the pair in exploring the area around the rectangle’s upper boundary, near 1.4060, followed by the six-month high of 1.4079, reached on October 14.
USD/CAD: Daily Chart
Canadian Dollar Price Today
The table below shows the percentage change of Canadian Dollar (CAD) against listed major currencies today. Canadian Dollar was the strongest against the British Pound.
| USD | EUR | GBP | JPY | CAD | AUD | NZD | CHF | |
|---|---|---|---|---|---|---|---|---|
| USD | 0.14% | 0.34% | -0.09% | -0.14% | -0.43% | -0.12% | 0.25% | |
| EUR | -0.14% | 0.20% | -0.14% | -0.28% | -0.57% | -0.26% | 0.11% | |
| GBP | -0.34% | -0.20% | -0.34% | -0.48% | -0.78% | -0.46% | -0.09% | |
| JPY | 0.09% | 0.14% | 0.34% | -0.12% | -0.41% | -0.09% | 0.28% | |
| CAD | 0.14% | 0.28% | 0.48% | 0.12% | -0.31% | 0.02% | 0.39% | |
| AUD | 0.43% | 0.57% | 0.78% | 0.41% | 0.31% | 0.32% | 0.69% | |
| NZD | 0.12% | 0.26% | 0.46% | 0.09% | -0.02% | -0.32% | 0.38% | |
| CHF | -0.25% | -0.11% | 0.09% | -0.28% | -0.39% | -0.69% | -0.38% |
The heat map shows percentage changes of major currencies against each other. The base currency is picked from the left column, while the quote currency is picked from the top row. For example, if you pick the Canadian Dollar from the left column and move along the horizontal line to the US Dollar, the percentage change displayed in the box will represent CAD (base)/USD (quote).

FXStreet
100만 명이 넘는 사용자가 FXStreet를 통해 실시간 시장 데이터, 차트 도구, 전문가 인사이트, 포렉스 뉴스를 이용합니다. 포괄적인 경제 캘린더와 교육 웨비나는 트레이더가 정보를 유지하고 신중한 결정을 내리도록 돕습니다. FXStreet는 바르셀로나 본사와 전 세계 지역에 걸쳐 약 60명의 팀으로 구성되어 있습니다.
Read More


