
USD/CAD Price Forecast: Slips below 1.3900 toward moving averages
작성자 Akhtar Faruqui
게시일: 16 Jan 2026 | 수정일: 16 Jan 2026


인기 기사

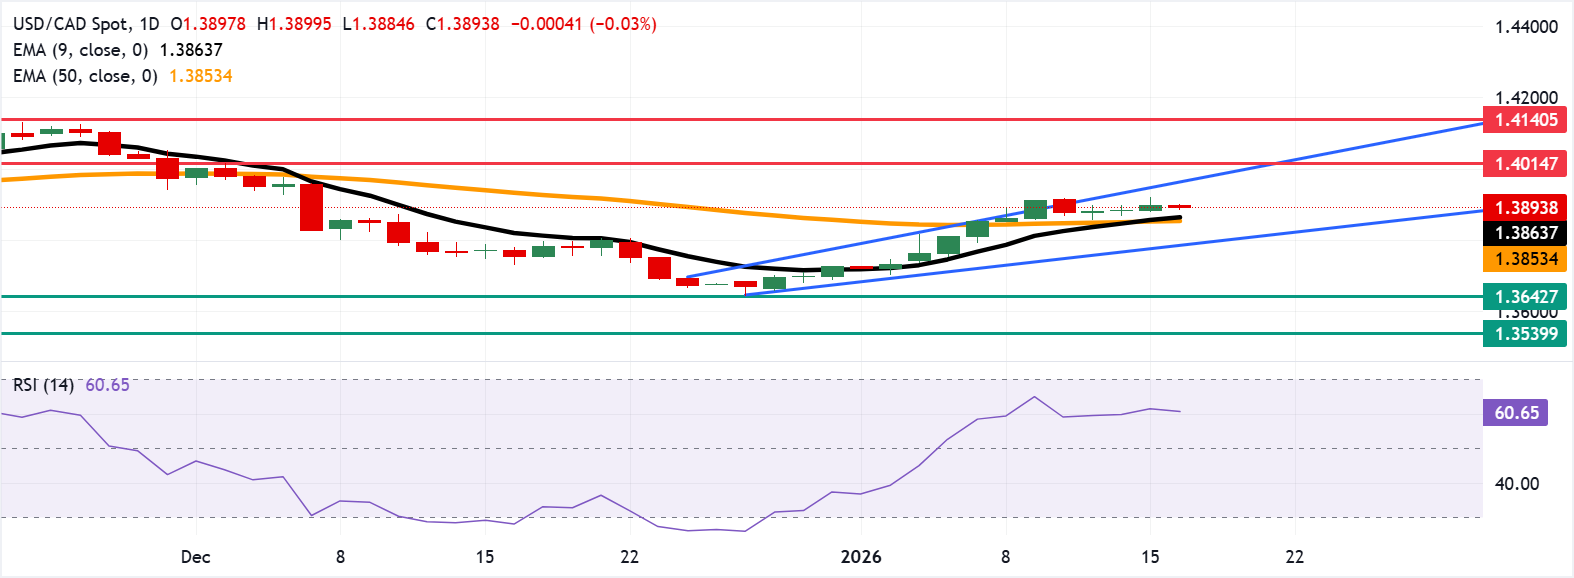
USD/CAD inches lower after three days of gains, trading around 1.3890 during the European hours on Friday. The technical analysis of the daily chart shows the pair remains within an ascending channel pattern, suggesting a persistent bullish bias.
- USD/CAD may target the initial resistance at the upper boundary of the ascending channel around 1.3970.
- The 14-day Relative Strength Index at 60 signals bullish momentum without overbought conditions.
- Initial support is seen at the nine-day EMA near 1.3864, followed by the 50-day EMA at 1.3853.
USD/CAD inches lower after three days of gains, trading around 1.3890 during the European hours on Friday. The technical analysis of the daily chart shows the pair remains within an ascending channel pattern, suggesting a persistent bullish bias. The 14-day Relative Strength Index (RSI) at 60 is bullish and not overbought. RSI above the 50 midline keeps dips shallow.
The nine-day Exponential Moving Average (EMA) has turned higher and now stands above the 50-day EMA, with price holding over both, keeping a topside bias. The 50-day EMA is flattening after a prolonged decline, indicating diminishing downside pressure.
As long as the USD/CAD pair holds above the short-term averages, the bias would remain for tests of overhead resistance at the upper boundary of the ascending channel around 1.3970, followed by the seven-week high of 1.4014, reached on December 2.
Pullbacks would find initial support at the rising nine-day EMA of 1.3864 and at the 50-day EMA at 1.3853. A drop below moving averages would slow the advance and shift risk toward the lower ascending channel boundary around 1.3790. A break below the channel would weaken the bullish bias and put downward pressure on the USD/CAD pair to test the five-month low of 1.3642, recorded on December 26.
(The technical analysis of this story was written with the help of an AI tool.)
Canadian Dollar Price Today
The table below shows the percentage change of Canadian Dollar (CAD) against listed major currencies today. Canadian Dollar was the strongest against the US Dollar.
| USD | EUR | GBP | JPY | CAD | AUD | NZD | CHF | |
|---|---|---|---|---|---|---|---|---|
| USD | -0.06% | -0.07% | -0.25% | -0.03% | -0.05% | -0.34% | -0.14% | |
| EUR | 0.06% | -0.01% | -0.20% | 0.03% | 0.00% | -0.27% | -0.08% | |
| GBP | 0.07% | 0.01% | -0.19% | 0.04% | 0.02% | -0.26% | -0.07% | |
| JPY | 0.25% | 0.20% | 0.19% | 0.25% | 0.21% | -0.08% | 0.12% | |
| CAD | 0.03% | -0.03% | -0.04% | -0.25% | -0.04% | -0.32% | -0.12% | |
| AUD | 0.05% | -0.01% | -0.02% | -0.21% | 0.04% | -0.29% | -0.09% | |
| NZD | 0.34% | 0.27% | 0.26% | 0.08% | 0.32% | 0.29% | 0.20% | |
| CHF | 0.14% | 0.08% | 0.07% | -0.12% | 0.12% | 0.09% | -0.20% |
The heat map shows percentage changes of major currencies against each other. The base currency is picked from the left column, while the quote currency is picked from the top row. For example, if you pick the Canadian Dollar from the left column and move along the horizontal line to the US Dollar, the percentage change displayed in the box will represent CAD (base)/USD (quote).

100만 명이 넘는 사용자가 FXStreet를 통해 실시간 시장 데이터, 차트 도구, 전문가 인사이트, 포렉스 뉴스를 이용합니다. 포괄적인 경제 캘린더와 교육 웨비나는 트레이더가 정보를 유지하고 신중한 결정을 내리도록 돕습니다. FXStreet는 바르셀로나 본사와 전 세계 지역에 걸쳐 약 60명의 팀으로 구성되어 있습니다.
더 읽기


