
Trade The World
WTI Price Forecast: 50-EMA acts as major barrier
작성자 Sagar Dua
게시일: 27 Aug 2025 | 수정일: 27 Aug 2025


POPULAR ARTICLES

West Texas Intermediate (WTI), futures on NYMEX, trade cautiously near Tuesday’s low of $63.00 during the European trading session on Wednesday. The Oil price struggles to gain ground ahead of the United States (US) Oil inventories data for the week ending August 22.
- The Oil price trades with caution around $63.00 ahead of US oil inventory data.
- Trade tensions between the US and India could dampen the Oil demand outlook.
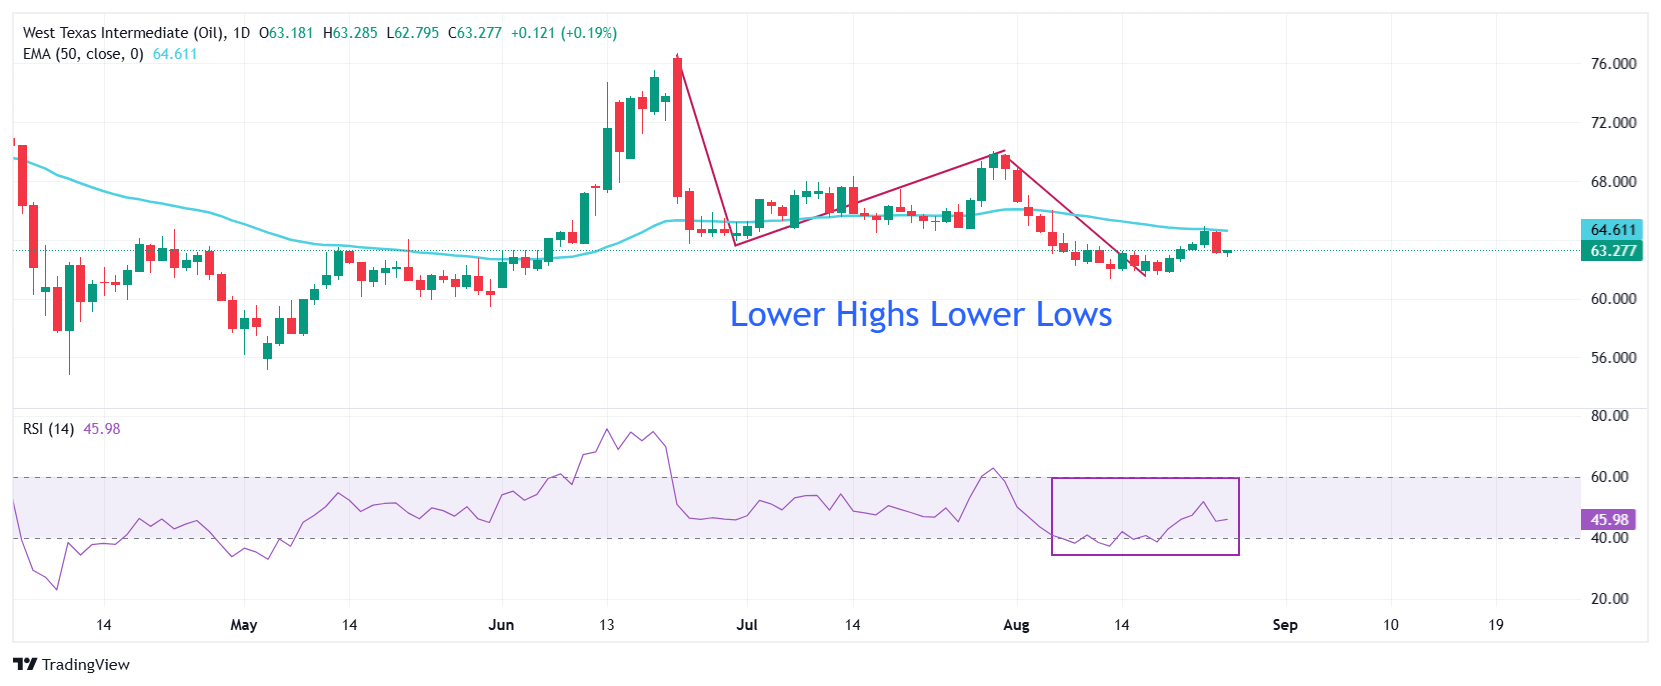
- WTI turns bearish on the formation of a Lower High Lower Low structure.
West Texas Intermediate (WTI), futures on NYMEX, trade cautiously near Tuesday’s low of $63.00 during the European trading session on Wednesday. The Oil price struggles to gain ground ahead of the United States (US) Oil inventories data for the week ending August 22.
The US Energy Information Administration (EIA) is expected to show that Oil inventories declined again. Oil stockpiles are seen contracting by 2 million barrels, lower than the 6.01 million barrels decline recorded last week.
Meanwhile, the imposition of tariffs by the United States (US) on imports from India has raised concerns over the Oil demand outlook. US President Donald Trump has raised tariffs on India to 50% for buying Russian Oil, which will come into effect at 12:01 AM EDT or 09:31 PM IST on Wednesday, according to a letter from US Homeland Security.
Given that India is one of the largest Oil importers in the world, soft demand for energy by the Indian economy would weigh on the Oil demand.
The formation of a fresh swing low by the Oil price near $61.35 on August 13 has confirmed a lower high lower low structure, which indicates a bearish trend. The downward-sloping 50-day Exponential Moving Average (EMA) near $64.60 also suggests that the near-term trend is bearish.
The 14-day Relative Strength Index (RSI) oscillates inside the 40.00-60.00 range, indicating a sideways trend.
The Oil price could extend its downside to near the psychological level of $60.00 and the May 30 low of $59.40 if it breaks below the August 13 low of $61.35.
On the flip side, a recovery move by the Oil price above the August 6 high of $66.00 would open the door towards the July 9 high of $68.00, followed by the July 30 high of $70.00.
WTI daily chart
WTI Oil FAQs
WTI Oil is a type of Crude Oil sold on international markets. The WTI stands for West Texas Intermediate, one of three major types including Brent and Dubai Crude. WTI is also referred to as “light” and “sweet” because of its relatively low gravity and sulfur content respectively. It is considered a high quality Oil that is easily refined. It is sourced in the United States and distributed via the Cushing hub, which is considered “The Pipeline Crossroads of the World”. It is a benchmark for the Oil market and WTI price is frequently quoted in the media.
Like all assets, supply and demand are the key drivers of WTI Oil price. As such, global growth can be a driver of increased demand and vice versa for weak global growth. Political instability, wars, and sanctions can disrupt supply and impact prices. The decisions of OPEC, a group of major Oil-producing countries, is another key driver of price. The value of the US Dollar influences the price of WTI Crude Oil, since Oil is predominantly traded in US Dollars, thus a weaker US Dollar can make Oil more affordable and vice versa.
The weekly Oil inventory reports published by the American Petroleum Institute (API) and the Energy Information Agency (EIA) impact the price of WTI Oil. Changes in inventories reflect fluctuating supply and demand. If the data shows a drop in inventories it can indicate increased demand, pushing up Oil price. Higher inventories can reflect increased supply, pushing down prices. API’s report is published every Tuesday and EIA’s the day after. Their results are usually similar, falling within 1% of each other 75% of the time. The EIA data is considered more reliable, since it is a government agency.
OPEC (Organization of the Petroleum Exporting Countries) is a group of 12 Oil-producing nations who collectively decide production quotas for member countries at twice-yearly meetings. Their decisions often impact WTI Oil prices. When OPEC decides to lower quotas, it can tighten supply, pushing up Oil prices. When OPEC increases production, it has the opposite effect. OPEC+ refers to an expanded group that includes ten extra non-OPEC members, the most notable of which is Russia.

FXStreet
100만 명이 넘는 사용자가 FXStreet를 통해 실시간 시장 데이터, 차트 도구, 전문가 인사이트, 포렉스 뉴스를 이용합니다. 포괄적인 경제 캘린더와 교육 웨비나는 트레이더가 정보를 유지하고 신중한 결정을 내리도록 돕습니다. FXStreet는 바르셀로나 본사와 전 세계 지역에 걸쳐 약 60명의 팀으로 구성되어 있습니다.
Read More


