


What Are Bullish and Bearish Engulfing Patterns?
Bullish and bearish engulfing patterns are reversal candlestick patterns signals used in technical analysis that reflect a sharp change in short term market control.
A bullish engulfing candle appears when a bearish candle is followed by a larger bullish candle that fully engulfs the prior real body. It usually forms after a decline, a pullback, or a test of support.
A bearish engulfing candle appears when a bullish candle is followed by a larger bearish candle that fully engulfs the prior real body. It usually forms after a rise, a bounce, or a test of resistance.
These patterns show a failed continuation attempt. One side controls the first candle, then loses control completely on the second candle.
What Are the Components and Price Action Mechanism of Bullish and Bearish Engulfing?
The core structure is the same in both patterns, but the direction of control shifts is reversed.
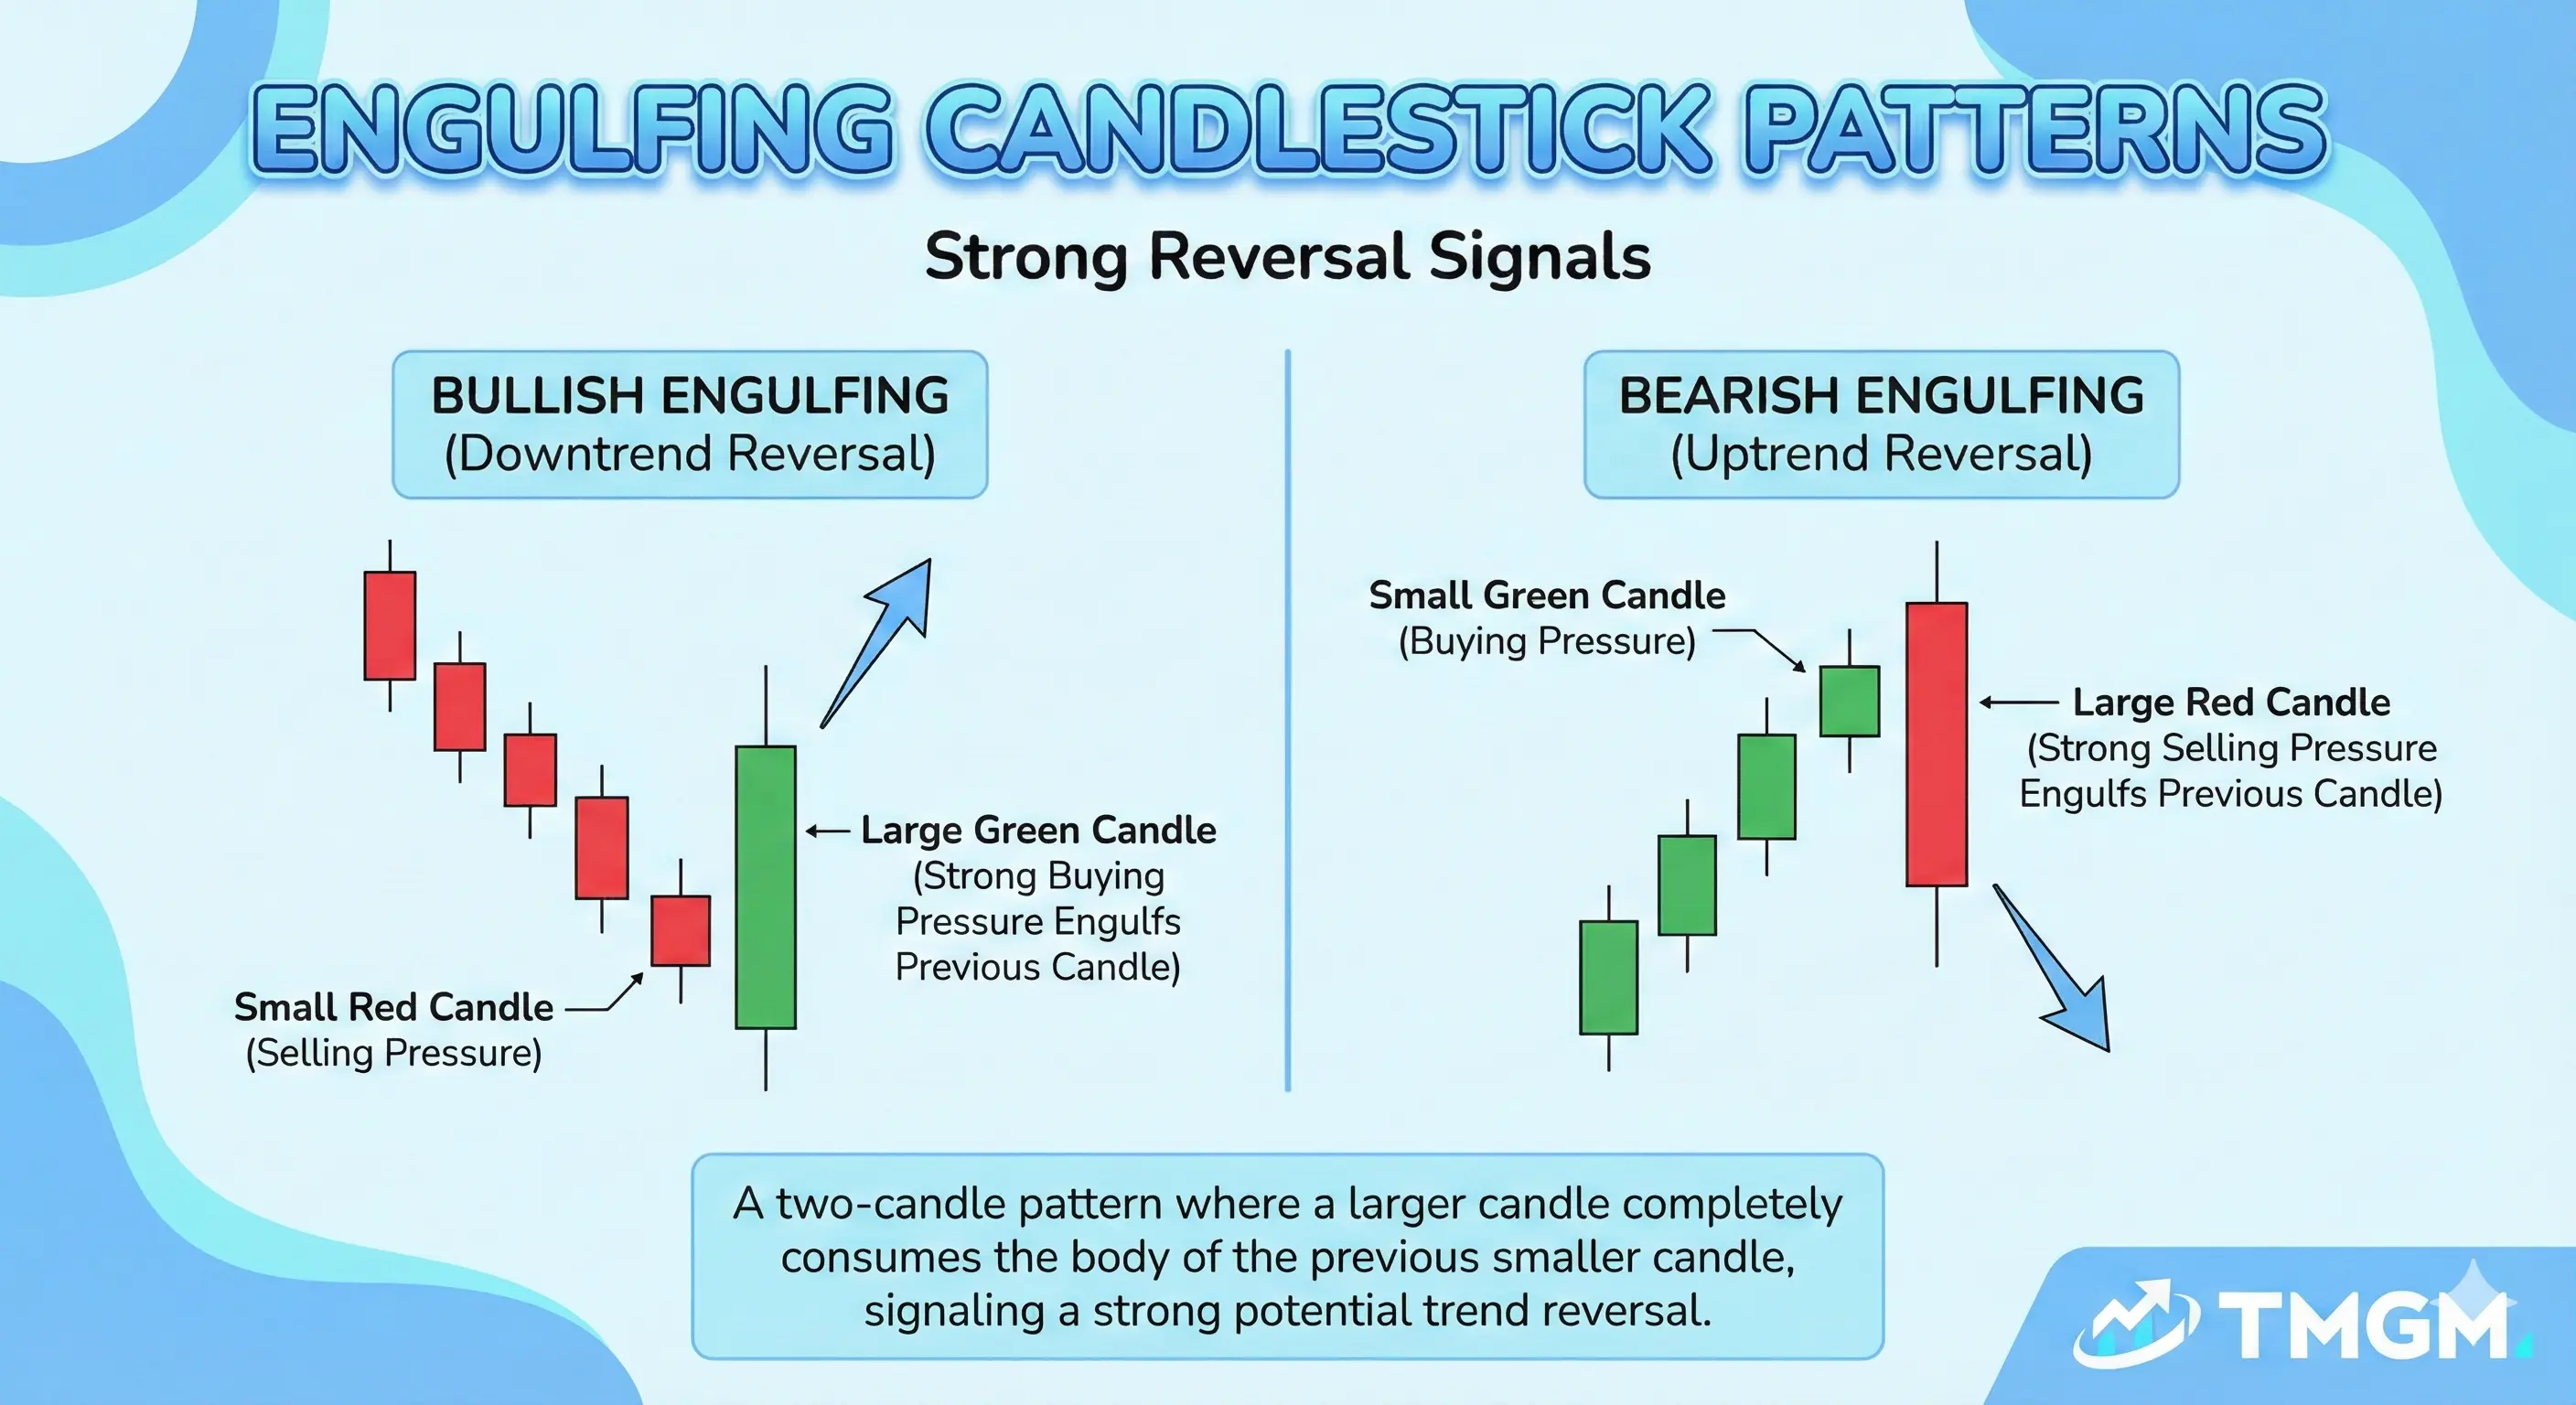
A bullish engulfing candle has two components. The first candle is bearish and the second candle is bullish and large enough to engulf the first candle’s real body, showing that buyers have taken control.
A bearish engulfing candle also has two components. The first candle is bullish and the second candle is bearish and large enough to engulf the first candle’s real body, showing that sellers have taken control.
The price action mechanism is what gives the pattern value. In a bullish engulfing, sellers push price lower first, but buyers then absorb that pressure and close strongly to reverse the move. In a bearish engulfing, buyers push price higher first, but sellers then overwhelm that demand and force price lower into the close.
A strong engulfing pattern always has a decisive second candle close. In a bullish engulfing, a close near the high shows stronger buyer control. In a bearish engulfing, a close near the low shows stronger seller control.
Important
Engulfing usually refers to the real body, not necessarily the full high to low range of the prior candle.
How to Trade a Bullish Engulfing Candle With Real World Example
Traders use the pattern by identifying it in the right context, confirming quality, and then defining entry, stop loss, and profit targets.
This is EURUSD’s historical price data on the 4 hour timeframe, showing a bullish engulfing forming on 01 Aug 2025 after a clear selloff into a local low.
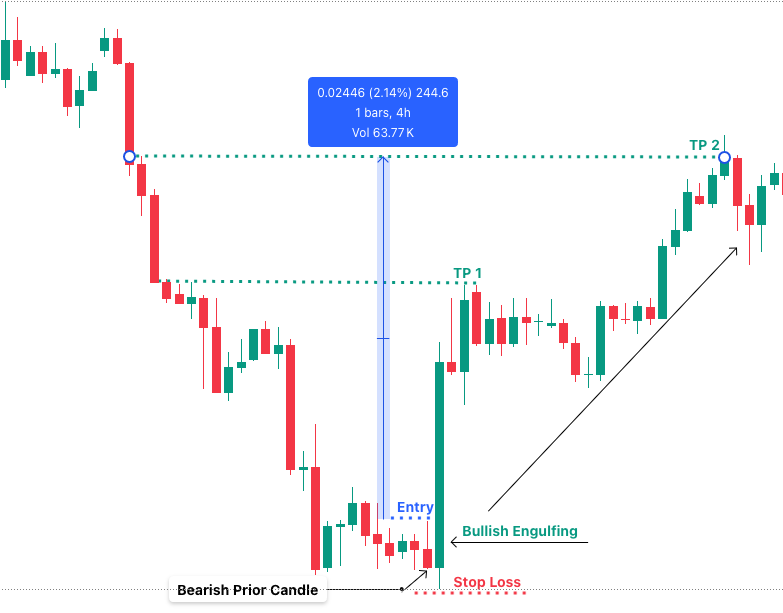
Example: EUR/USD printed an engulfing candlestick pattern, marking a sharp shift from seller control to buyer control, then price broke higher and eventually reached TP2 on 07 Aug 2025. From the reversal area to TP2, the move covered about 0.02446, or 2.14 percent, over 23 candles excluding the engulfing candle itself.
Identify
The setup begins with a clear bearish move, which gives the pattern proper reversal context. Near the low, a small bearish candle prints first, followed by a larger bullish candle that fully engulfs its real body and closes strongly.
That second candle is the bullish engulfing and signals that buyers have absorbed the selling pressure and taken short term control.
What Confirmation Signals Improved Reliability in this Trade?
This pattern became more reliable because it formed after a visible decline and at a local low, not in random sideways price action. The engulfing candle was large and decisive, which shows strong rejection of lower prices and a genuine shift in momentum.
The next confirmation comes from follow through. After the engulfing candle forms, price pushes above the nearby base instead of stalling inside it. That price acceptance is important because it shows buyers are still active after the initial reversal signal. Breakout volume can add confidence when participation expands as price leaves the pattern, but the main confirmation in this example is the clean move out of the base and the continuation that follows.
Entry
The entry is placed above the immediate base rather than at the exact low of the pattern. This makes the trade more selective because price has to break above nearby structure before the setup is confirmed.
In other words, the engulfing candle creates the signal, but the entry waits for proof that the reversal is actually starting to develop.
Stop Loss
The stop loss is placed below the wick low of the engulfing candle. That level makes structural sense because a move back below that low would weaken the reversal idea and suggest that sellers are regaining control.
It also keeps the invalidation point tied to the actual pattern instead of using an arbitrary distance.
Pro Tip
If the stop below the pattern makes the trade too large for the account risk limit, the better decision is to skip the setup.
Take Profit 1, Take Profit 2
TP1 is set at the first reaction high after the breakout. This is the first logical area to reduce risk or secure partial profit because price reaches an initial resistance zone and starts to pause there.
TP2 is set at the higher resistance level reached after price consolidates and then continues upward. In this example, price reaches TP2 on 07 Aug 2025, 23 candles after the engulfing candle formed on 01 Aug 2025.
That move, which measured about 0.02446 or 2.14 percent, shows how a bullish engulfing can lead to a larger upside continuation when the pattern forms in the right context and receives confirmation after the reversal.
Bullish Engulfing vs Bearish Engulfing Candlestick Patterns
The two patterns use the same logic, but one signals possible upside reversal and the other signals possible downside reversal.
Bullish engulfing forms after a decline and suggests buyers may be taking control. Bearish engulfing forms after a rise and suggests sellers may be taking control.
The structures are mirror images. In a bullish engulfing, the first candle is bearish and the second candle is bullish. In a bearish engulfing, the first candle is bullish and the second candle is bearish.
The best location is also reversed. Bullish engulfing is stronger near support, after weakness, or within a broader uptrend pullback. Bearish engulfing is stronger near resistance, after strength, or within a broader downtrend pullback.
The execution logic is similar in both cases. Traders still need clear structure, strong context, confirmation, and enough room for price to move before the next barrier.
What Are the Limitations of Bullish and Bearish Engulfing Candles?
These patterns can signal a reversal, but they do not guarantee one.
A bullish engulfing candle can fail in a strong downtrend when the pattern produces only a short bounce before sellers return. A bearish engulfing candle can fail in a strong uptrend when the pattern produces only a shallow pullback before buyers regain control.
Both patterns are weaker in choppy markets. If they form in the middle of a range, away from meaningful support or resistance, they can become unreliable.
These patterns work best as part of a structured trade plan. They are signals of possible reversal, not standalone reasons to enter a trade.


