
Trade The World
AAVE Price Forecast: AAVE’s Total Value Locked reaches a new all-time high of $44.8 billion
Oleh Manish Chhetri
Tarikh Diterbitkan: 3 Oct 2025 | Tarikh Diubah: 3 Oct 2025


POPULAR ARTICLES

Aave (AAVE) price trades in green, above $290 at the time of writing on Friday, after gaining nearly 6% so far this week. The bullish outlook is further strengthened as the Total Value Locked (TVL) reaches a record high of over $44 billion, indicating growing investor interest.
- Aave price trades in the green on Friday, having gained nearly 6% so far this week.
- DefiLlama data show that AAVE’s TVL reaches a record high of $44.89 billion, highlighting growing interest among investors.
- The technical outlook suggests a continuation of the rally, as momentum indicators display a bullish bias.
Aave (AAVE) price trades in green, above $290 at the time of writing on Friday, after gaining nearly 6% so far this week. The bullish outlook is further strengthened as the Total Value Locked (TVL) reaches a record high of over $44 billion, indicating growing investor interest. From a technical view, momentum indicators suggest a bullish bias, indicating the continuation of the ongoing rally.
AAVE TVL hits record highs
Crypto intelligence tracker DefiLlama’s data shows that Aave’s TVL has increased to a new all-time high of $44.89 billion on Friday. Rising TVL indicates growing activity and interest within AAVE’s ecosystem, suggesting that more users are depositing or utilizing assets within AAVE-based protocols.
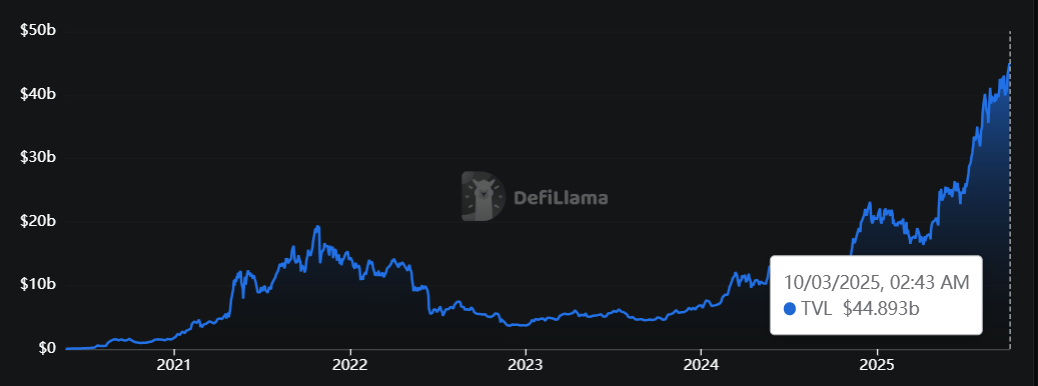
AAVE TVL chart. Source: DefiLlama
On the derivatised front, CryptoQuant’s Futures Volume Bubble Map indicator, which measures the average order size of executed trades for AAVE, is showing larger average order sizes, suggesting increased participation from whale investors, further supporting the bullish view.
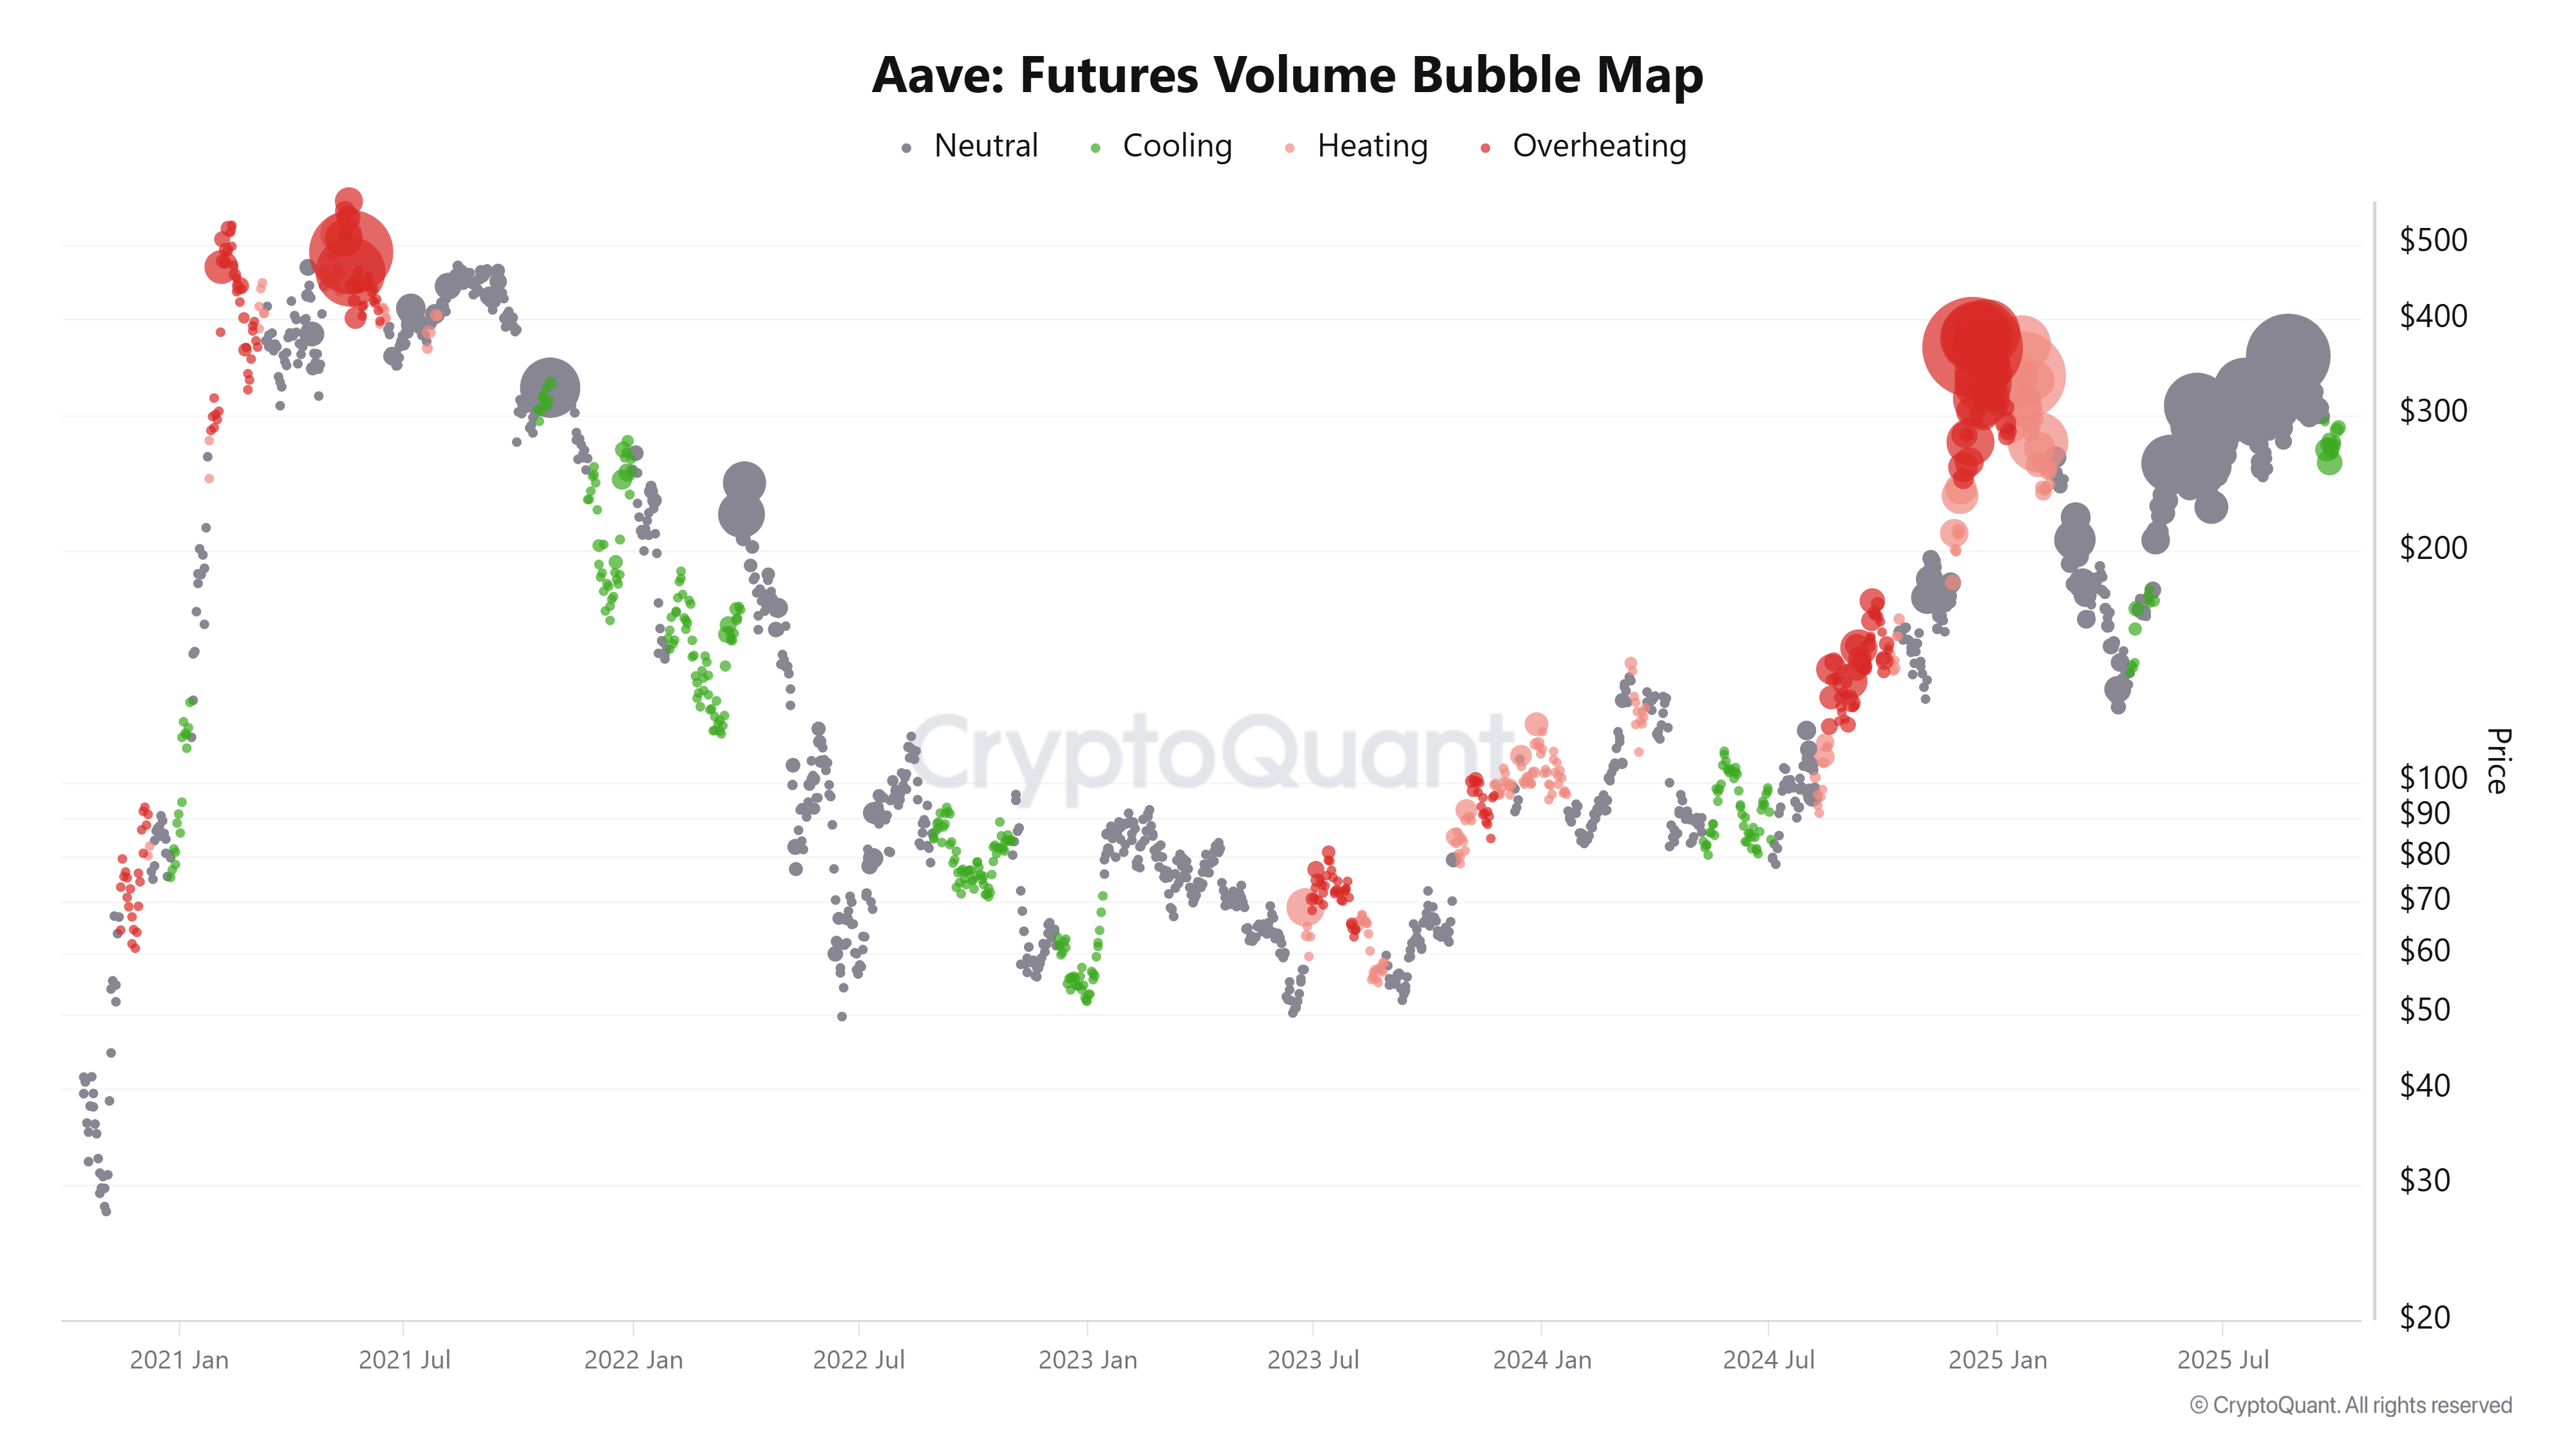
Aave Futures Volume Bubble Map chart. Source: CryptoQuant
Aave Price Forecast: AAVE bulls aiming for $367 mark
Aave price found support around the 50% Fibonacci level at $250.53 (drawn from the April low of $114.05 to the August high of $387.02) last week and recovered, closing above the 200-day Exponential Moving Average (EMA) at $268.05 on Sunday. As of Monday, the start of this week, AAVE continues its recovery, with a 5% increase by Thursday, finding support around the 200-day EMA. At the time of writing on Friday, it hovers at around $290.
If AAVE continues its upward trend, it could extend the rally toward its daily resistance level at $367.11.
The Relative Strength Index (RSI) on the daily chart is moving above the neutral level of 50, indicating fading bearish momentum. The Moving Average Convergence Divergence (MACD) displayed a bullish crossover on Thursday, signaling a buy opportunity and indicating the potential start of an upward trend.
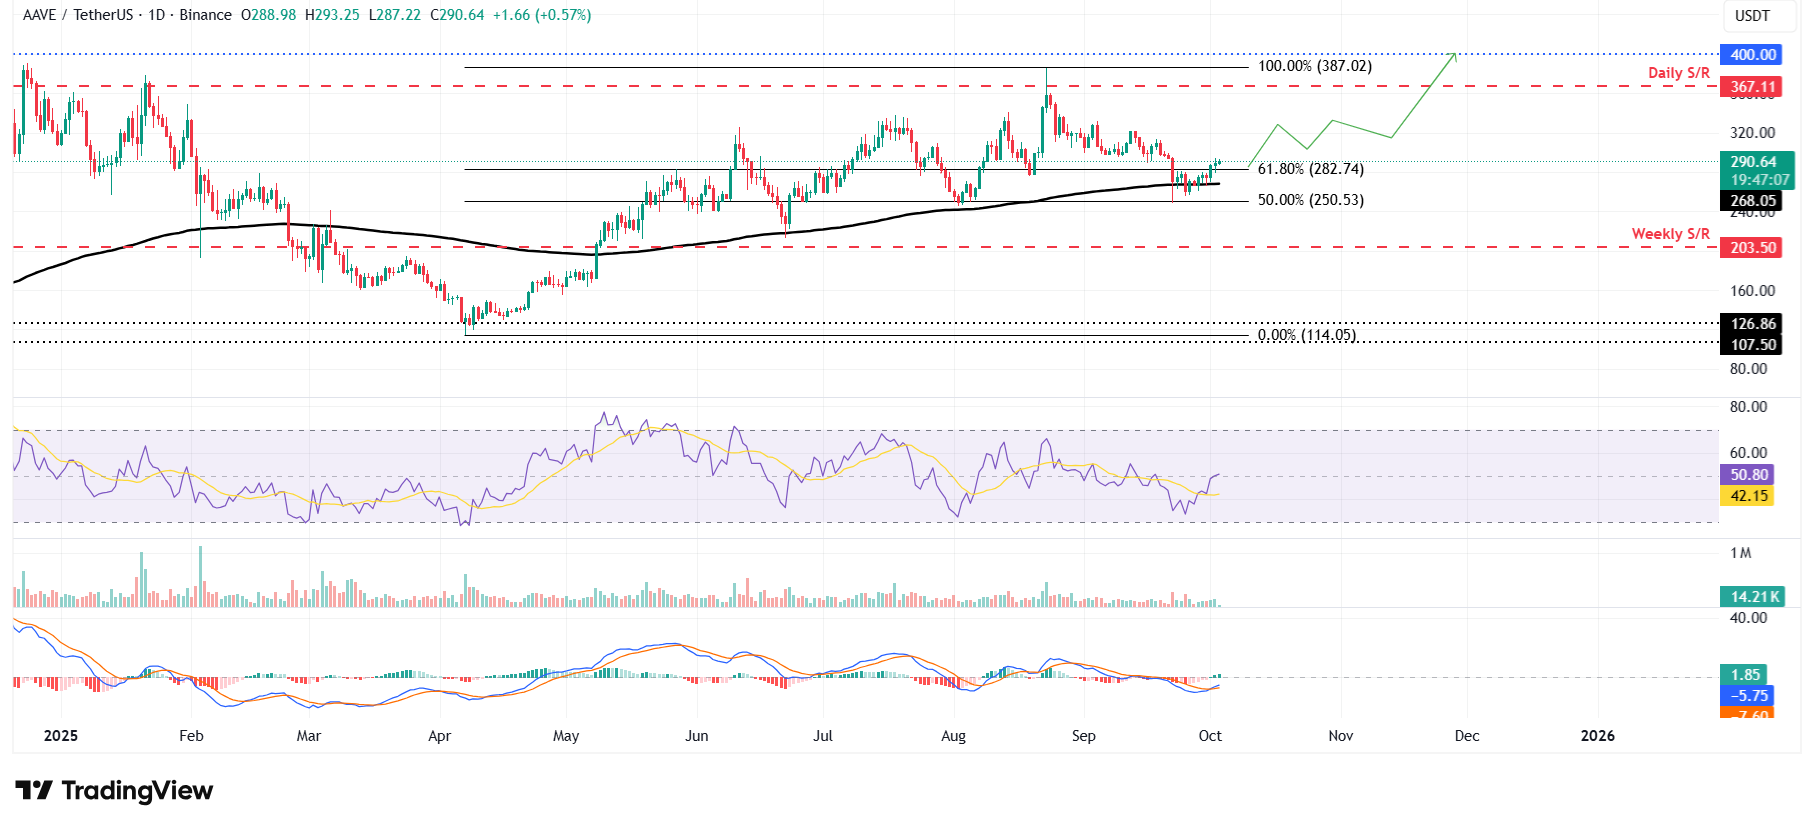
AAVE/USDT daily chart
However, if AAVE faces a correction, it could extend the decline toward the 200-day EMA at $268.05.

Acuity Trading
Acuity Trading ialah fintech berpangkalan di London yang ditubuhkan pada 2013, pakar dalam data alternatif berkuasa AI dan analisis sentimen untuk dagangan dan pelaburan. Mereka merevolusikan pengalaman dagangan dalam talian dengan alat berita dan sentimen visual, dan terus menerajui pasaran dengan data alternatif penjana alfa dan alat dagangan yang sangat interaktif menggunakan penyelidikan serta teknologi AI terkini.
Read More


