
AUD/USD Price Forecast: Climbs toward 0.7100, eyes on YTD high
Oleh Christian Borjon Valencia
Tarikh Diterbitkan: 21 Feb 2026 | Tarikh Diubah: 21 Feb 2026


ARTIKEL POPULAR

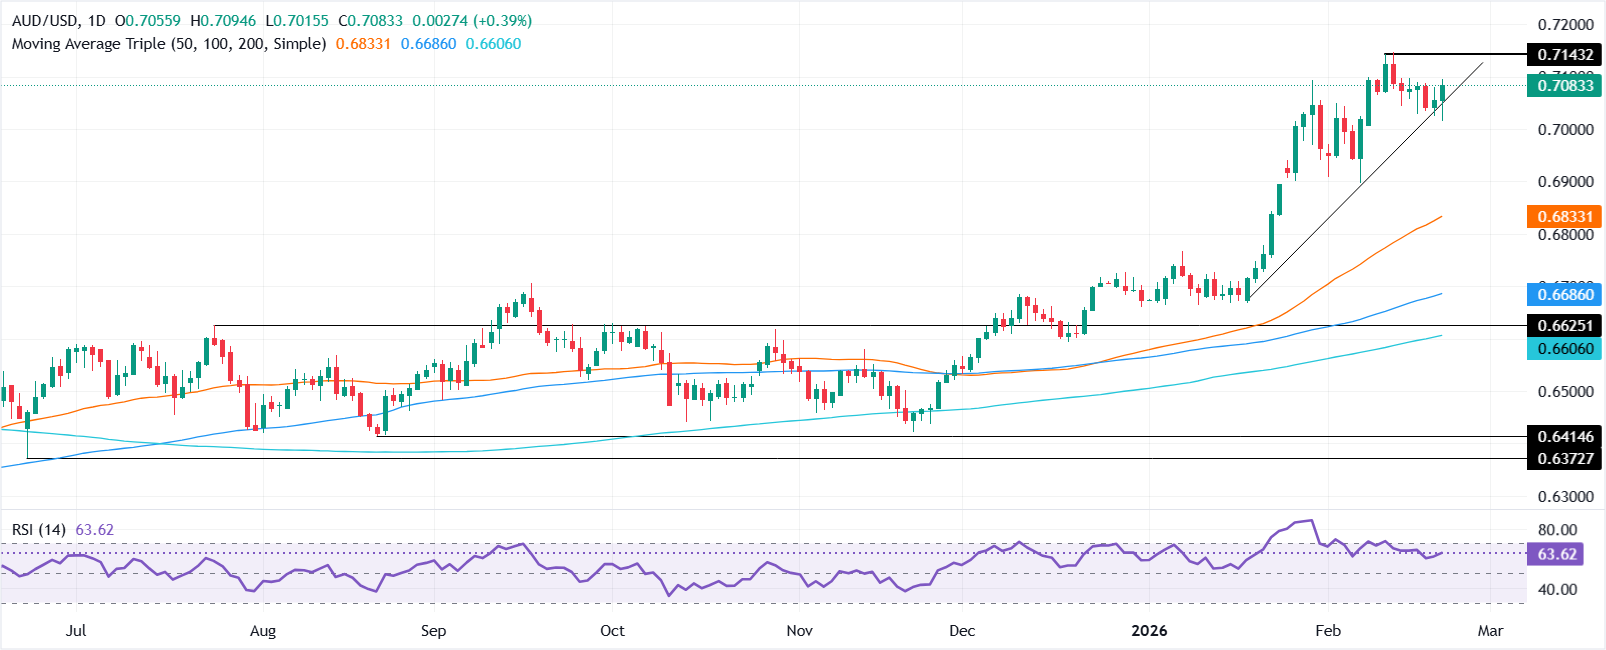
The AUD/USD advances for the second straight day, up by 0.36% as the Greenback edges lower as US economic growth takes a toll while inflation accelerates towards the 3% threshold. At the time of writing, the pair trades at 0.7086, poised to end the week with gains of over 0.19%.
- AUD/USD gains as weaker US growth offsets firmer inflation, weighing on Dollar.
- Break above 20-day SMA strengthens bullish bias, with 0.7100 as next resistance.
- RSI momentum improves, opening path toward yearly high near 0.7147.
The AUD/USD advances for the second straight day, up by 0.36% as the Greenback edges lower as US economic growth takes a toll while inflation accelerates towards the 3% threshold. At the time of writing, the pair trades at 0.7086, poised to end the week with gains of over 0.19%.
AUD/USD Price Forecast: Technical outlook
The AUD/USD remains upward biased after buyers pushed the exchange rate past above the 20-day Simple Moving Average (SMA) of 0.7034. Following that, they cleared 0.7050 and seem poised to challenge the 0.7100 mark.
Bullish momentum remains intact, with the Relative Strength Index (RSI) aiming higher, after bottoming near 59.34. If the index surpasses 65.00, the AUD/USD could clear the next key resistance level and eye the yearly high of 0.7147.
Conversely, if AUD/USD tumbles below 0.7000 the first support would be the February 6 daily low at 0.6897, followed by the 50-day SMA at 0.6832.
AUD/USD Price Chart – Daily
Australian Dollar Price This week
The table below shows the percentage change of Australian Dollar (AUD) against listed major currencies this week. Australian Dollar was the strongest against the Japanese Yen.
| USD | EUR | GBP | JPY | CAD | AUD | NZD | CHF | |
|---|---|---|---|---|---|---|---|---|
| USD | 0.73% | 1.17% | 1.57% | 0.54% | -0.17% | 0.89% | 0.87% | |
| EUR | -0.73% | 0.44% | 0.86% | -0.20% | -0.90% | 0.16% | 0.14% | |
| GBP | -1.17% | -0.44% | 0.15% | -0.62% | -1.34% | -0.28% | -0.30% | |
| JPY | -1.57% | -0.86% | -0.15% | -1.02% | -1.70% | -0.68% | -0.66% | |
| CAD | -0.54% | 0.20% | 0.62% | 1.02% | -0.75% | 0.35% | 0.33% | |
| AUD | 0.17% | 0.90% | 1.34% | 1.70% | 0.75% | 1.08% | 1.06% | |
| NZD | -0.89% | -0.16% | 0.28% | 0.68% | -0.35% | -1.08% | -0.02% | |
| CHF | -0.87% | -0.14% | 0.30% | 0.66% | -0.33% | -1.06% | 0.02% |
The heat map shows percentage changes of major currencies against each other. The base currency is picked from the left column, while the quote currency is picked from the top row. For example, if you pick the Australian Dollar from the left column and move along the horizontal line to the US Dollar, the percentage change displayed in the box will represent AUD (base)/USD (quote).

Acuity Trading ialah fintech berpangkalan di London yang ditubuhkan pada 2013, pakar dalam data alternatif berkuasa AI dan analisis sentimen untuk dagangan dan pelaburan. Mereka merevolusikan pengalaman dagangan dalam talian dengan alat berita dan sentimen visual, dan terus menerajui pasaran dengan data alternatif penjana alfa dan alat dagangan yang sangat interaktif menggunakan penyelidikan serta teknologi AI terkini.
Baca Lagi


