
Cardano Price Forecast: ADA edges lower, weighed down by dwindling retail demand
Oleh John Isige
Tarikh Diterbitkan: 16 Dec 2025 | Tarikh Diubah: 16 Dec 2025


ARTIKEL POPULAR

Cardano (ADA) is trading under pressure at the time of writing on Tuesday, as sellers remain dominant in the broader cryptocurrency market. The smart contract token’s recovery potential has remained a pipe dream since the October 10 flash crash, despite support at $0.3707-$0.3775 holding steady.
- Cardano holds key support at $0.3775, but the overall trend outlook remains bearish.
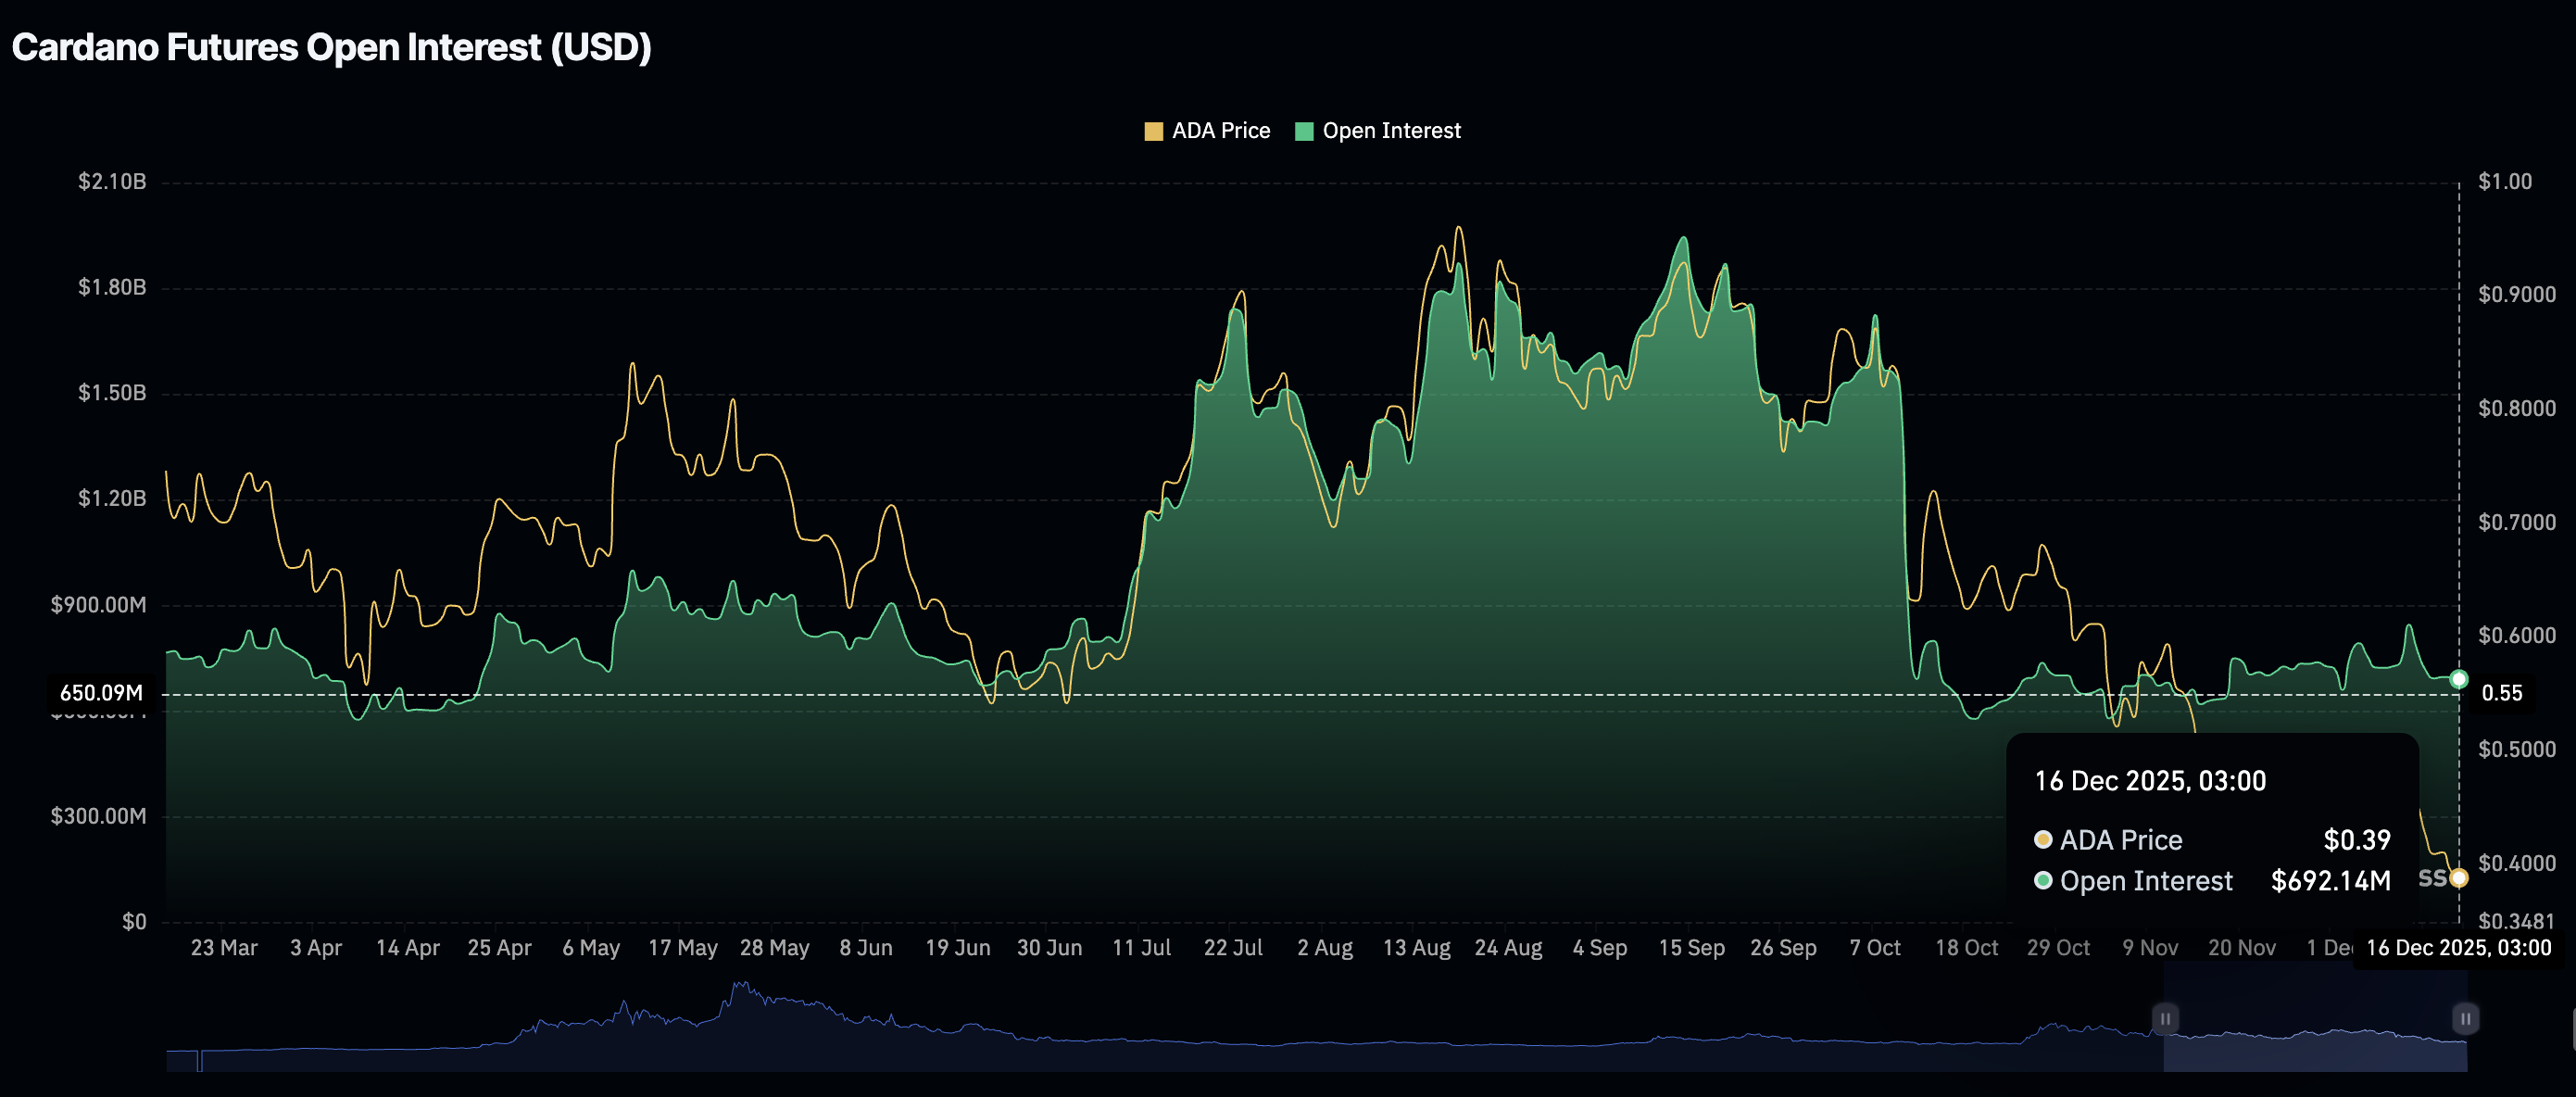
- ADA wobbles under increasing selling pressure amid a weak derivatives market, with Open Interest at $692 million.
- The RSI holds near oversold territory, while the 50 EMA caps potential rebounds.
Cardano (ADA) is trading under pressure at the time of writing on Tuesday, as sellers remain dominant in the broader cryptocurrency market. The smart contract token’s recovery potential has remained a pipe dream since the October 10 flash crash, despite support at $0.3707-$0.3775 holding steady.
Falling retail demand limits Cardano’s recovery potential
Cardano has, since the October 10 flash crash, faced declining demand, with the derivatives market faltering. CoinGlass data shows futures Open Interest (OI) at $692 million, down from $842 million on Wednesday.
OI represents the notional value of outstanding futures contracts and averaged $1.52 billion on October 10. Retail demand reached its highest level in history at $1.95 billion mid-September, when Cardano traded around $0.95.
A steady increase in OI indicates that investors are confident the token will sustainably trend higher, leading them to increase their risk exposure. If OI remains subdued, recovery would be limited, increasing the odds of a prolonged downtrend.
Technical outlook: Can Cardano hold key support?
Cardano is trading above a key support area at $0.3707-$0.3775 at the time of writing on Tuesday, as sellers tighten their grip. The downward-trending 50 Exponential Moving Average (EMA) at $0.4108, the 100 EMA at $0.4218, and the 200 EMA at $0.4530 on the 4-hour chart highlight the dominant bearish outlook.
The Relative Strength Index (RSI) sits near oversold territory on the same chart, indicating the bearish momentum is increasing. A sell signal from the Moving Average Convergence Divergence (MACD) indicator could prompt investors to reduce risk exposure, thereby contributing to selling pressure.
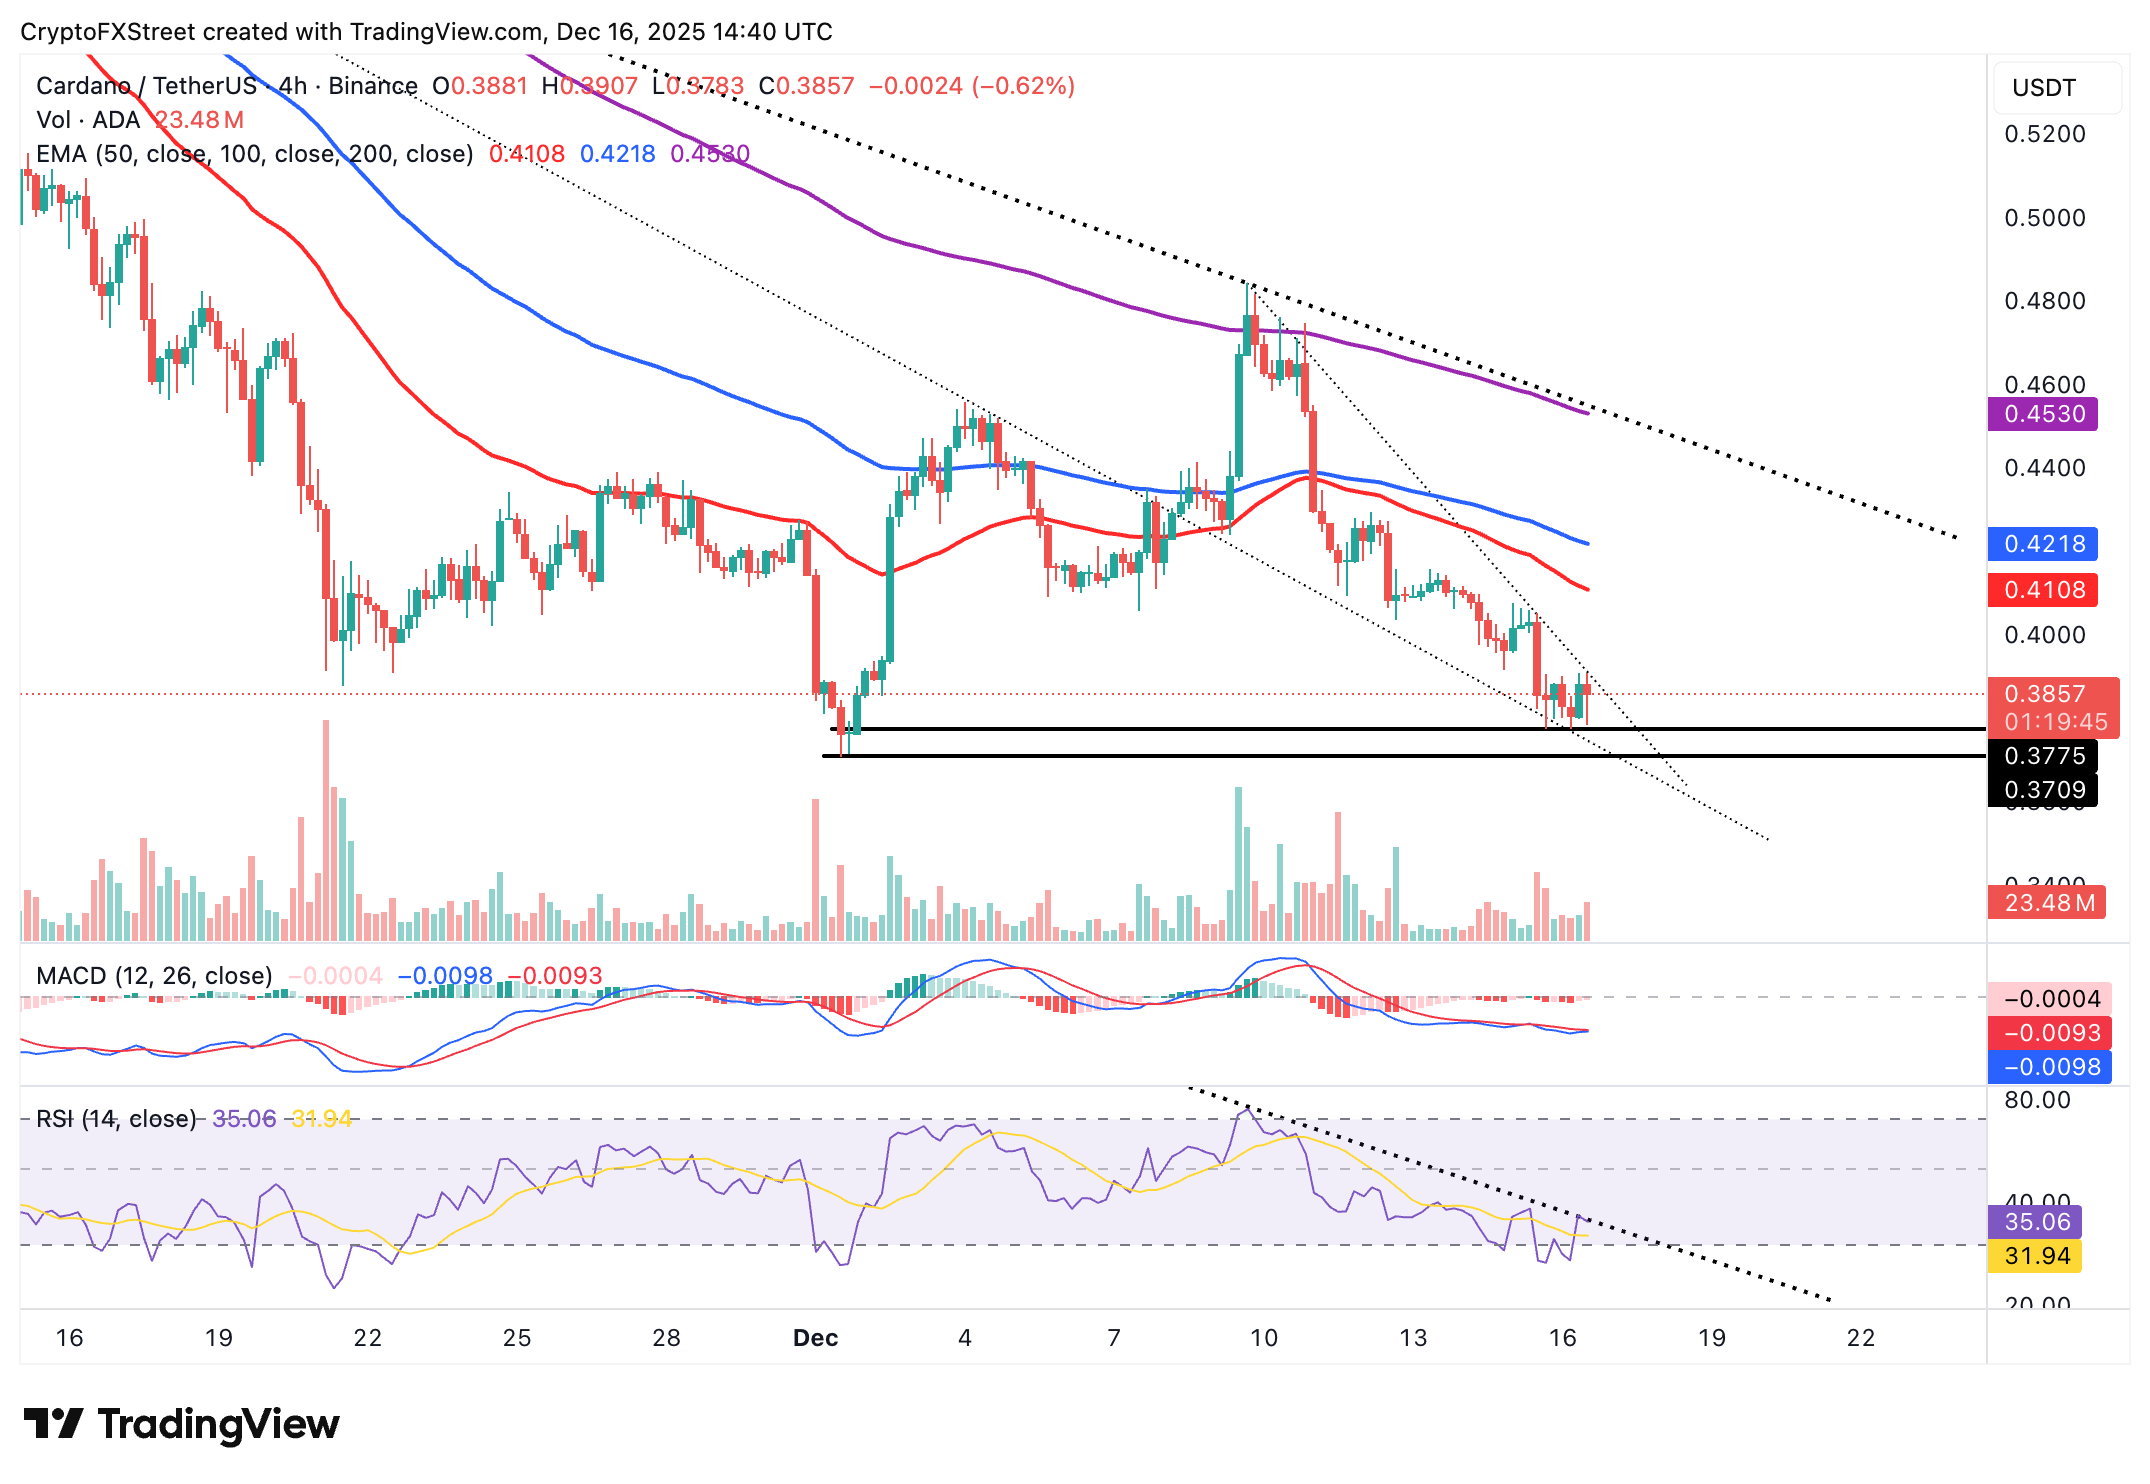
A declining downtrend provides a base around the key support range between $0.3707 and $0.3775. If this demand area breaks, the downtrend will likely extend to the October 10’s low of $0.2756.
Gains above the accelerated trendline would mark the first step toward a strong trend change. However, Cardano may continue to lean bearish until the 50 EMA at $0.4108 becomes support, paving the way for a recovery above the 100 EMA at $0.4218 and the 200-day EMA at $0.4530.
Open Interest, funding rate FAQs
Higher Open Interest is associated with higher liquidity and new capital inflow to the market. This is considered the equivalent of increase in efficiency and the ongoing trend continues. When Open Interest decreases, it is considered a sign of liquidation in the market, investors are leaving and the overall demand for an asset is on a decline, fueling a bearish sentiment among investors.
Funding fees bridge the difference between spot prices and prices of futures contracts of an asset by increasing liquidation risks faced by traders. A consistently high and positive funding rate implies there is a bullish sentiment among market participants and there is an expectation of a price hike. A consistently negative funding rate for an asset implies a bearish sentiment, indicating that traders expect the cryptocurrency’s price to fall and a bearish trend reversal is likely to occur.

Acuity Trading ialah fintech berpangkalan di London yang ditubuhkan pada 2013, pakar dalam data alternatif berkuasa AI dan analisis sentimen untuk dagangan dan pelaburan. Mereka merevolusikan pengalaman dagangan dalam talian dengan alat berita dan sentimen visual, dan terus menerajui pasaran dengan data alternatif penjana alfa dan alat dagangan yang sangat interaktif menggunakan penyelidikan serta teknologi AI terkini.
Baca Lagi


