
Trade The World
EUR/JPY price forecast: Targets 171.50 support after breaking below nine-day EMA
Oleh Akhtar Faruqui
Tarikh Diterbitkan: 15 Aug 2025 | Tarikh Diubah: 15 Aug 2025


POPULAR ARTICLES

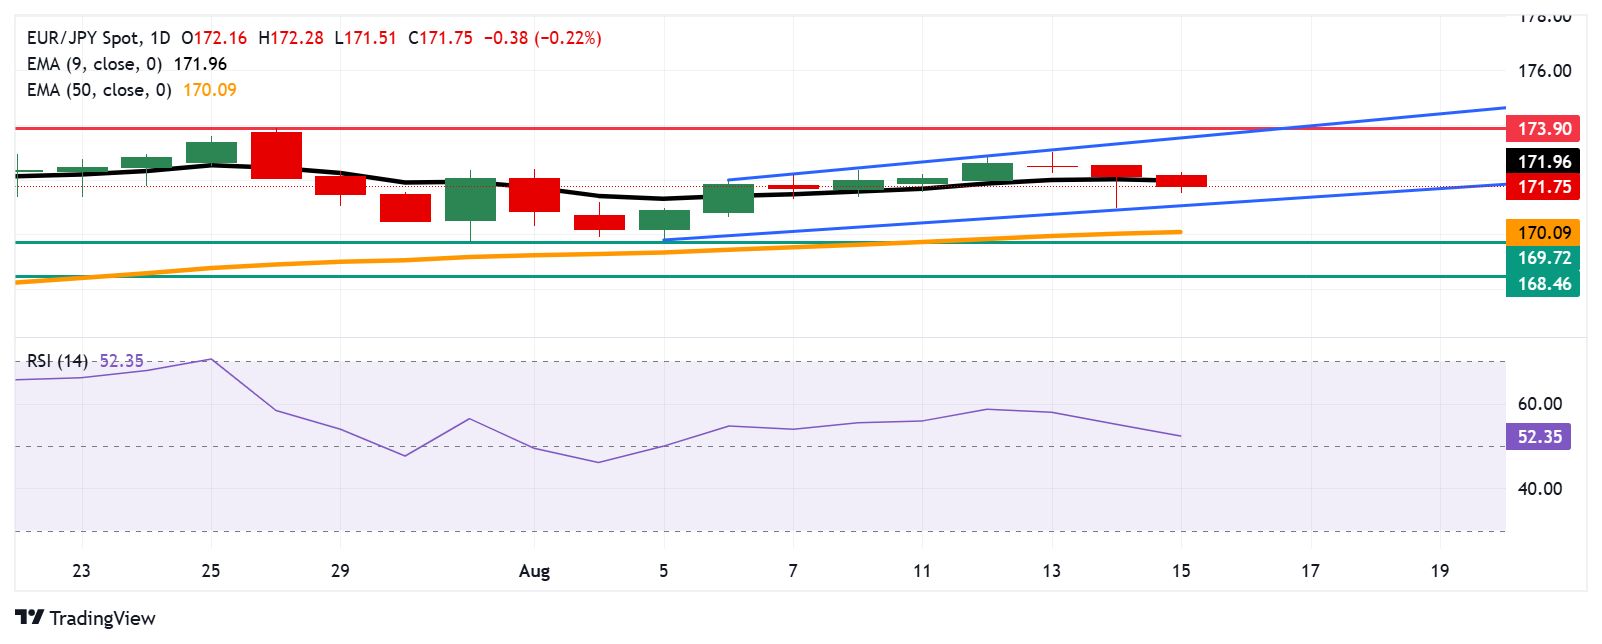
EUR/JPY loses ground for the third consecutive day, trading around 171.80 during the European hours on Friday. The technical analysis of the daily chart suggests a prevailing bullish bias as the currency cross remains within the ascending channel pattern.
- EUR/JPY may find the initial barrier at the nine-day EMA of 171.95.
- The bullish bias is prevailing as the 14-day Relative Strength Index remains above 50.
- The primary support appears at the psychological level of 171.50.
EUR/JPY loses ground for the third consecutive day, trading around 171.80 during the European hours on Friday. The technical analysis of the daily chart suggests a prevailing bullish bias as the currency cross remains within the ascending channel pattern.
The 14-day Relative Strength Index (RSI) is positioned above the 50 mark, suggesting the bullish bias is active. However, the short-term price momentum is weaker as the EUR/JPY cross moved below the nine-day Exponential Moving Average (EMA).
The EUR/JPY cross could test the immediate barrier at the nine-day EMA of 171.95. A break above this level would strengthen short-term price momentum and support the currency cross to approach the upper boundary of the ascending channel around 173.60, followed by 173.90, the highest since July 2024, recorded on July 28, 2025.
On the downside, the EUR/JPY cross may test the crucial support level at 171.50, followed by the ascending channel’s lower boundary around 171.10 and the psychological level of 171.00. A break below this crucial support zone would put downward pressure on the pair to test the 50-day EMA at 170.09, followed by the six-week low at 169.72, which was recorded on July 31. Further declines would prompt the currency cross to reach the two-month low at 168.46, registered on July 1.
EUR/JPY: Daily Chart
Euro PRICE Today
The table below shows the percentage change of Euro (EUR) against listed major currencies today. Euro was the weakest against the Japanese Yen.
| USD | EUR | GBP | JPY | CAD | AUD | NZD | CHF | |
|---|---|---|---|---|---|---|---|---|
| USD | -0.25% | -0.16% | -0.54% | -0.15% | -0.28% | -0.13% | -0.20% | |
| EUR | 0.25% | 0.09% | -0.21% | 0.09% | -0.06% | 0.11% | 0.05% | |
| GBP | 0.16% | -0.09% | -0.28% | 0.00% | -0.15% | 0.02% | -0.04% | |
| JPY | 0.54% | 0.21% | 0.28% | 0.30% | 0.17% | 0.37% | 0.24% | |
| CAD | 0.15% | -0.09% | -0.00% | -0.30% | -0.08% | 0.02% | -0.04% | |
| AUD | 0.28% | 0.06% | 0.15% | -0.17% | 0.08% | 0.10% | 0.11% | |
| NZD | 0.13% | -0.11% | -0.02% | -0.37% | -0.02% | -0.10% | -0.06% | |
| CHF | 0.20% | -0.05% | 0.04% | -0.24% | 0.04% | -0.11% | 0.06% |
The heat map shows percentage changes of major currencies against each other. The base currency is picked from the left column, while the quote currency is picked from the top row. For example, if you pick the Euro from the left column and move along the horizontal line to the US Dollar, the percentage change displayed in the box will represent EUR (base)/USD (quote).

Acuity Trading
Acuity Trading ialah fintech berpangkalan di London yang ditubuhkan pada 2013, pakar dalam data alternatif berkuasa AI dan analisis sentimen untuk dagangan dan pelaburan. Mereka merevolusikan pengalaman dagangan dalam talian dengan alat berita dan sentimen visual, dan terus menerajui pasaran dengan data alternatif penjana alfa dan alat dagangan yang sangat interaktif menggunakan penyelidikan serta teknologi AI terkini.
Read More


