
Hedera Price Forecast: HBAR extends gains as ETF inflows boost sentiment
Oleh Manish Chhetri
Tarikh Diterbitkan: 14 Jan 2026 | Tarikh Diubah: 14 Jan 2026


ARTIKEL POPULAR

Hedera (HBAR) is trading at around $0.127 on Wednesday, approaching a key resistance level; a breakout above this level would signal further gains. Institutional demand continues to strengthen this week, with spot HBAR Exchange-Traded Funds (ETFs) recording three consecutive days of inflows.
- Hedera price is nearing key resistance at $0.127 on Wednesday, a firm close above suggests a rally ahead.
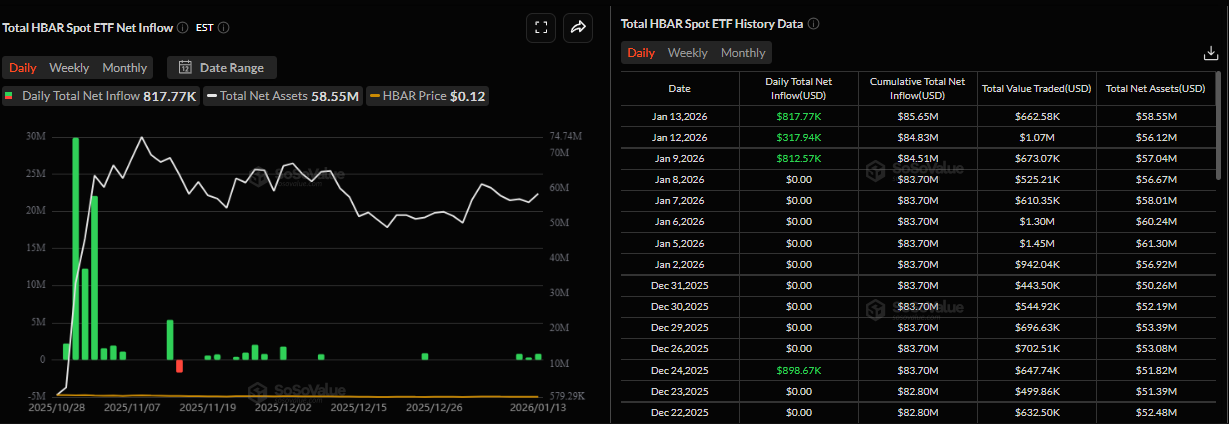
- US-listed spot ETF records an inflow of $817,770 on Tuesday, marking the third positive flow since January 9.
- On-chain and derivatives metrics suggest bullish sentiment with large whale orders and rising long bets.
Hedera (HBAR) is trading at around $0.127 on Wednesday, approaching a key resistance level; a breakout above this level would signal further gains. Institutional demand continues to strengthen this week, with spot HBAR Exchange-Traded Funds (ETFs) recording three consecutive days of inflows. The bullish outlook from on-chain and derivatives data further suggests HBAR could rally.
Institutional demand for HBAR continues to grow
Institutional demand for Hedera has continued to strengthen this week. SoSoValue data show that Hedera spot ETFs recorded an inflow of $817,770 inflow of Tuesday, marking the third consecutive positive flow since last week. If these inflows continue and intensify, HBAR could extend its ongoing price rally.
Positive on-chain and derivatives metrics
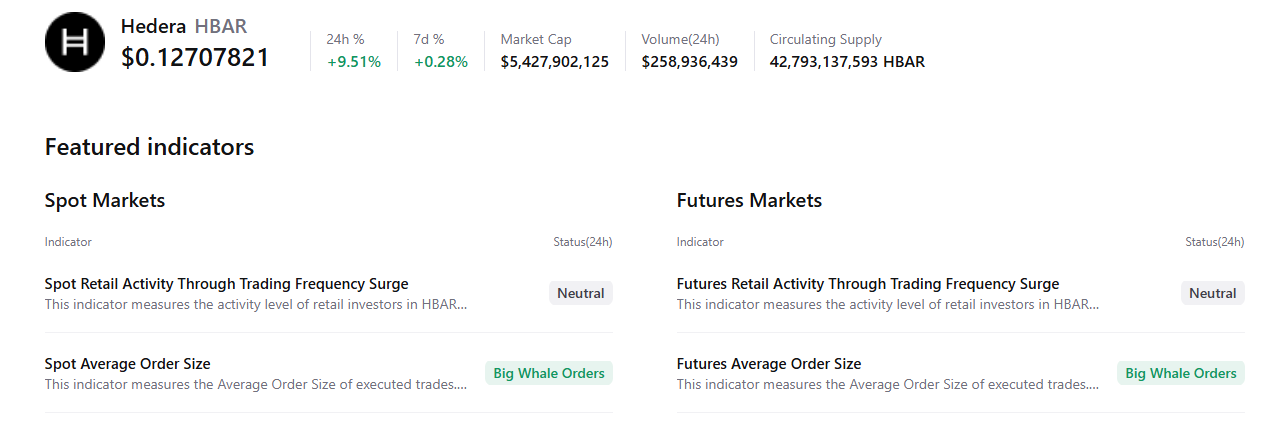
The CryptoQuant chart below supports a positive outlook, as HBAR’s spot and futures markets show large whale orders, signaling a potential rally ahead.
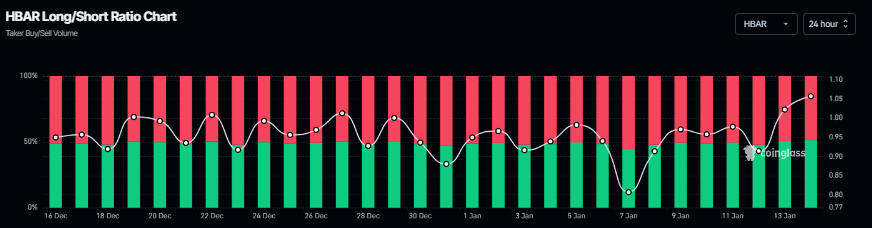
On the derivatives side, HBAR’s Coinglass long-to-short ratio reads 1.06 on Wednesday, the highest level in over a month. This ratio, above one, reflects bullish sentiment in the markets, as more traders are betting on the Hedera price to rise.
Hedera Price Forecast: HBAR could extend gains if it closes above the 50-day EMA
Hedera's price has been within a falling wedge pattern (formed by connecting multiple highs and lows since the end of July) and surged more than 6% on Tuesday. As of writing on Wednesday, HBAR is nearing the 50-day Exponential Moving Average (EMA) at $0.127.
If HBAR closes above the 50-day EMA at $0.127 on a daily basis, it could extend the rally toward the upper trendline boundary of the wedge pattern at around $0.152.
The Relative Strength Index (RSI) on the daily chart is at 56, above the neutral 50 level, indicating bullish momentum is gaining traction. Moreover, the Moving Average Convergence Divergence (MACD) shows a bullish crossover that remains intact, further supporting the positive outlook.
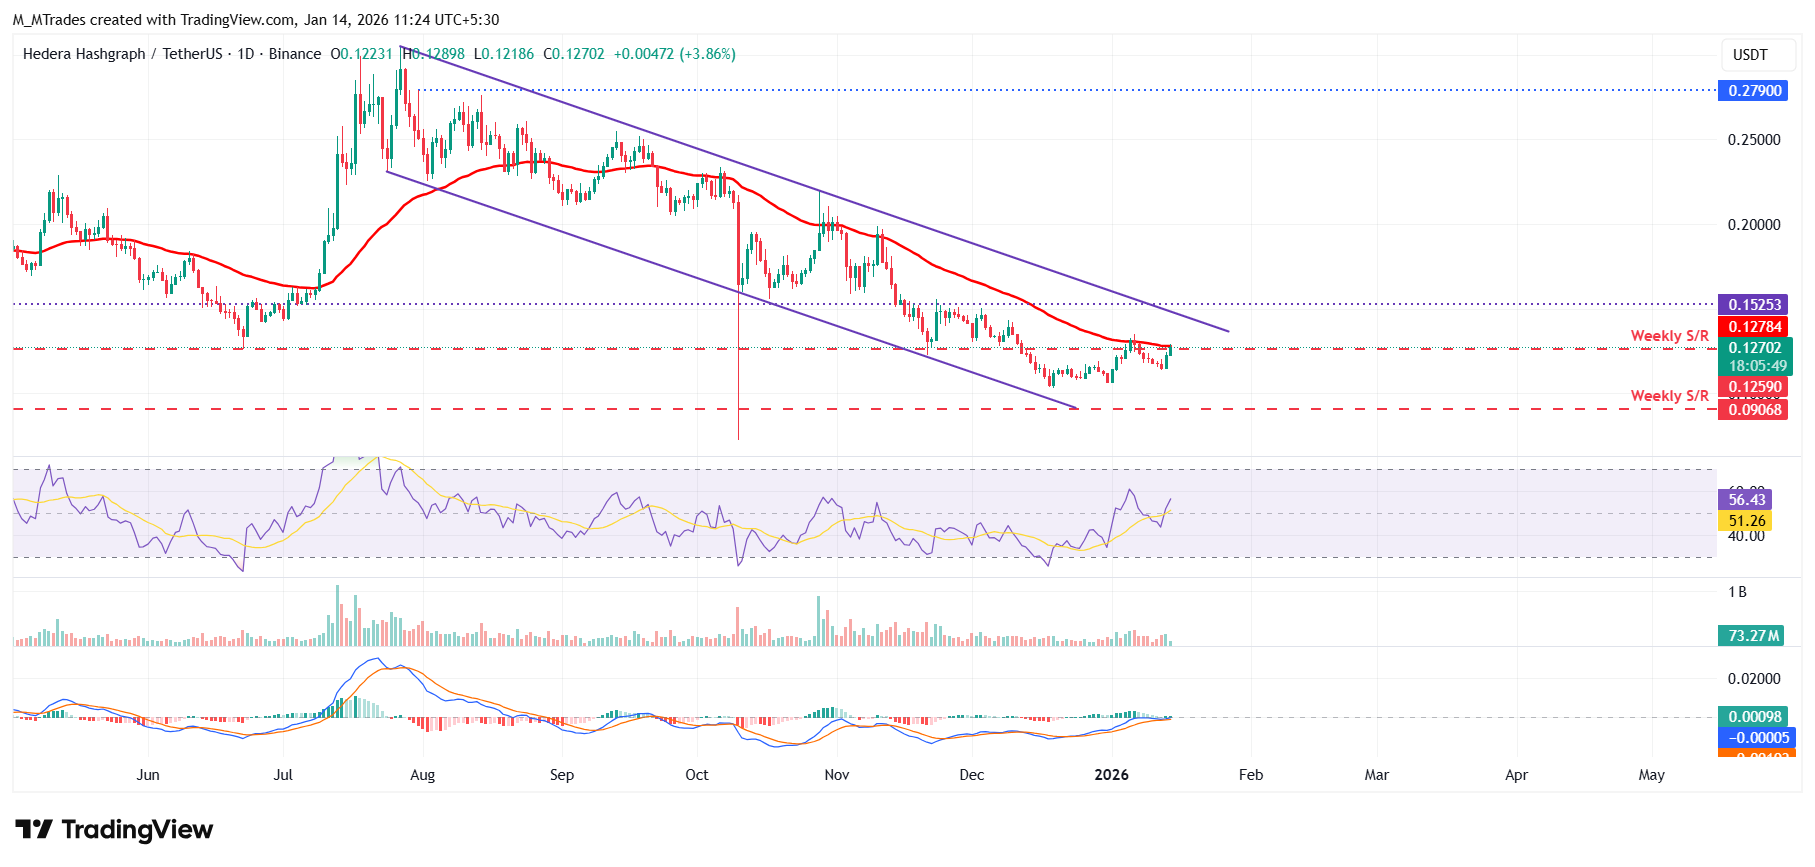
However, if HBAR faces a correction, it could extend the decline toward the weekly support at $0.090.

Acuity Trading ialah fintech berpangkalan di London yang ditubuhkan pada 2013, pakar dalam data alternatif berkuasa AI dan analisis sentimen untuk dagangan dan pelaburan. Mereka merevolusikan pengalaman dagangan dalam talian dengan alat berita dan sentimen visual, dan terus menerajui pasaran dengan data alternatif penjana alfa dan alat dagangan yang sangat interaktif menggunakan penyelidikan serta teknologi AI terkini.
Baca Lagi


