
US Dollar Index Price Forecast: Tests nine-day EMA support near 99.00
Oleh Akhtar Faruqui
Tarikh Diterbitkan: 19 Jan 2026 | Tarikh Diubah: 19 Jan 2026


ARTIKEL POPULAR

The US Dollar Index (DXY), which measures the value of the US Dollar (USD) against six major currencies, is losing ground after two days of gains and trading around 99.20 during the European hours on Monday.
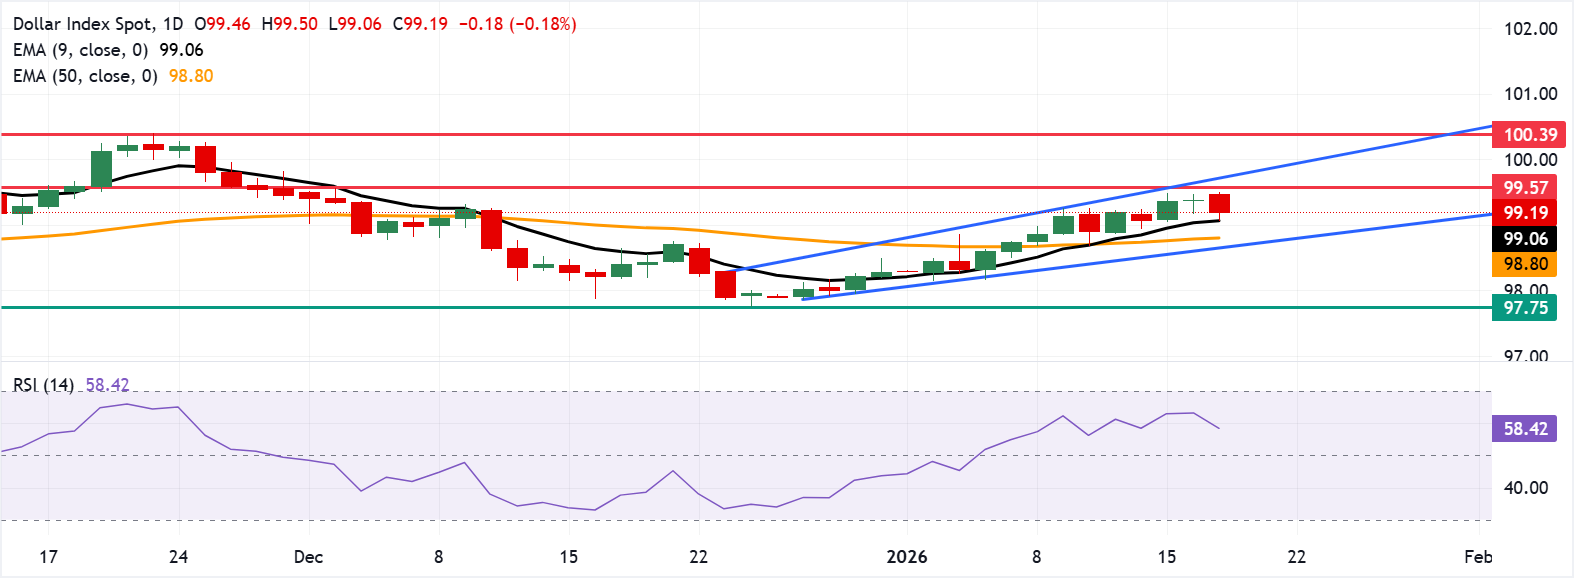
- US Dollar Index may find initial resistance at the eight-week high of 99.57.
- The 14-day Relative Strength Index at 58.57 signals bullish momentum.
- The immediate support lies at the nine-day EMA of 99.06.
The US Dollar Index (DXY), which measures the value of the US Dollar (USD) against six major currencies, is losing ground after two days of gains and trading around 99.20 during the European hours on Monday. The technical analysis of the daily chart shows that the dollar index moves upward within the ascending channel pattern, suggesting a persistent bullish bias.
The US Dollar Index holds above the rising nine-day Exponential Moving Average (EMA) and the 50-day EMA, keeping the short-term bias positive. The short-term average above the medium-term average reinforces upside control. The 14-day Relative Strength Index (RSI) at 58.57 shows bullish momentum while remaining below the overbought threshold.
Immediate resistance aligns at the eight-week high of 99.57, recorded on December 2, followed by the upper boundary of the ascending channel around 99.70. A close through the channel barrier could extend gains toward the next cap at the seven-month high of 100.26, which was recorded on August 1.
On the downside, the US Dollar Index tests the immediate support at the nine-day EMA of 99.06, aligned with the psychological level of 99.00. A break below this level would weaken the short-term price momentum and expose the confluence support zone around the 50-day EMA at 98.80 and the lower ascending channel boundary around 98.60. Further declines would target the region around the 97.75, the lowest since October 25.
(The technical analysis of this story was written with the help of an AI tool.)
US Dollar Price Today
The table below shows the percentage change of US Dollar (USD) against listed major currencies today. US Dollar was the weakest against the Swiss Franc.
| USD | EUR | GBP | JPY | CAD | AUD | NZD | CHF | |
|---|---|---|---|---|---|---|---|---|
| USD | -0.16% | -0.17% | -0.02% | -0.18% | -0.14% | -0.35% | -0.42% | |
| EUR | 0.16% | -0.02% | 0.17% | -0.02% | 0.02% | -0.20% | -0.26% | |
| GBP | 0.17% | 0.02% | 0.19% | -0.00% | 0.03% | -0.18% | -0.24% | |
| JPY | 0.02% | -0.17% | -0.19% | -0.19% | -0.14% | -0.36% | -0.42% | |
| CAD | 0.18% | 0.02% | 0.00% | 0.19% | 0.04% | -0.17% | -0.24% | |
| AUD | 0.14% | -0.02% | -0.03% | 0.14% | -0.04% | -0.22% | -0.28% | |
| NZD | 0.35% | 0.20% | 0.18% | 0.36% | 0.17% | 0.22% | -0.06% | |
| CHF | 0.42% | 0.26% | 0.24% | 0.42% | 0.24% | 0.28% | 0.06% |
The heat map shows percentage changes of major currencies against each other. The base currency is picked from the left column, while the quote currency is picked from the top row. For example, if you pick the US Dollar from the left column and move along the horizontal line to the Japanese Yen, the percentage change displayed in the box will represent USD (base)/JPY (quote).

Acuity Trading ialah fintech berpangkalan di London yang ditubuhkan pada 2013, pakar dalam data alternatif berkuasa AI dan analisis sentimen untuk dagangan dan pelaburan. Mereka merevolusikan pengalaman dagangan dalam talian dengan alat berita dan sentimen visual, dan terus menerajui pasaran dengan data alternatif penjana alfa dan alat dagangan yang sangat interaktif menggunakan penyelidikan serta teknologi AI terkini.
Baca Lagi


