
Trade The World
USD/CAD Price Forecast: Tests rectangle’s upper boundary above 1.3900
Oleh Akhtar Faruqui
Tarikh Diterbitkan: 25 Sep 2025 | Tarikh Diubah: 25 Sep 2025


POPULAR ARTICLES

USD/CAD hovers around 1.3900 during the early European hours on Thursday, following its three-day winning streak.
- USD/CAD tests the immediate barrier at the rectangle’s upper boundary around 1.3910.
- The pair is consolidating within a rectangle pattern, with the 14-day RSI above 50 indicating bullish consolidation.
- The primary support appears at the nine-day EMA of 1.3838.
USD/CAD hovers around 1.3900 during the early European hours on Thursday, following its three-day winning streak. The technical analysis of the daily chart suggests that the pair consolidates within a rectangle pattern, while the 14-day RSI above 50 signals bullish consolidation with potential for an upside breakout.
Additionally, the USD/CAD pair remains above the nine-day Exponential Moving Average (EMA), suggesting the short-term price momentum is stronger.
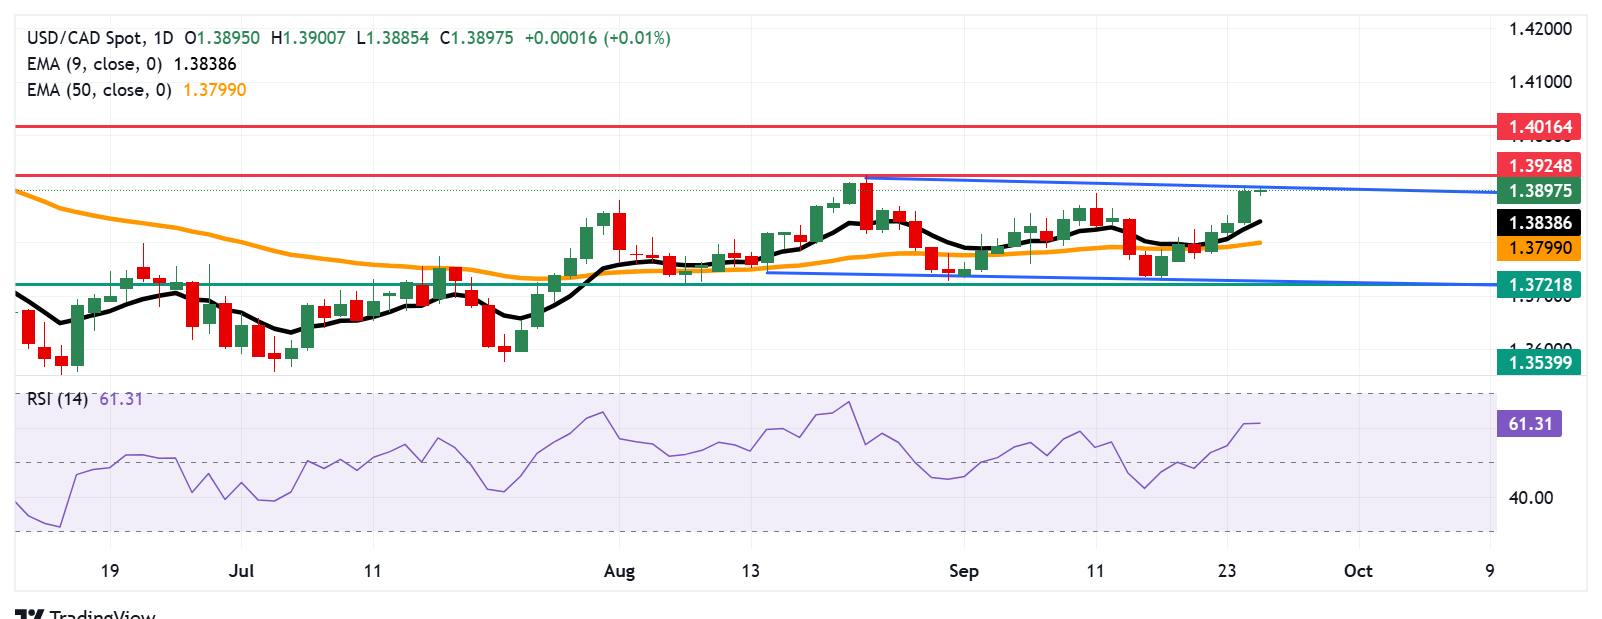
On the upside, the USD/CAD pair is testing the rectangle’s upper boundary around 1.3910, followed by the four-month high at 1.3924, which was recorded on August 22. A break above this confluence resistance zone would prompt the pair to explore the region around the five-month high at 1.4016, reached on May 13.
The USD/CAD pair may find its initial support at the nine-day EMA of 1.3838, followed by the 50-day EMA at 1.3799. A break below these levels would weaken the short- and medium-term price momentum and put downward pressure on the pair to navigate the region around the lower boundary of the rectangle around 1.3730, followed by the two-month low of 1.3721, which was recorded on August 7. Further declines below the crucial support zone would weaken the bullish consolidation and put downward pressure on the pair to navigate the area around the two-month low of 1.3539.
USD/CAD: Daily Chart
Canadian Dollar Price Today
The table below shows the percentage change of Canadian Dollar (CAD) against listed major currencies today. Canadian Dollar was the strongest against the Swiss Franc.
| USD | EUR | GBP | JPY | CAD | AUD | NZD | CHF | |
|---|---|---|---|---|---|---|---|---|
| USD | -0.07% | -0.09% | -0.09% | 0.01% | -0.16% | -0.12% | 0.00% | |
| EUR | 0.07% | -0.04% | -0.03% | 0.07% | -0.08% | -0.06% | 0.07% | |
| GBP | 0.09% | 0.04% | 0.02% | 0.12% | -0.07% | 0.01% | 0.15% | |
| JPY | 0.09% | 0.03% | -0.02% | 0.09% | -0.10% | 0.14% | 0.10% | |
| CAD | -0.01% | -0.07% | -0.12% | -0.09% | -0.15% | -0.11% | 0.03% | |
| AUD | 0.16% | 0.08% | 0.07% | 0.10% | 0.15% | 0.34% | 0.16% | |
| NZD | 0.12% | 0.06% | -0.01% | -0.14% | 0.11% | -0.34% | -0.13% | |
| CHF | -0.00% | -0.07% | -0.15% | -0.10% | -0.03% | -0.16% | 0.13% |
The heat map shows percentage changes of major currencies against each other. The base currency is picked from the left column, while the quote currency is picked from the top row. For example, if you pick the Canadian Dollar from the left column and move along the horizontal line to the US Dollar, the percentage change displayed in the box will represent CAD (base)/USD (quote).

Acuity Trading
Acuity Trading ialah fintech berpangkalan di London yang ditubuhkan pada 2013, pakar dalam data alternatif berkuasa AI dan analisis sentimen untuk dagangan dan pelaburan. Mereka merevolusikan pengalaman dagangan dalam talian dengan alat berita dan sentimen visual, dan terus menerajui pasaran dengan data alternatif penjana alfa dan alat dagangan yang sangat interaktif menggunakan penyelidikan serta teknologi AI terkini.
Read More


