
AUD/USD Price Forecast: Hovers around 0.7250 near nine-day EMA support
Oleh Akhtar Faruqui
Dikemas kini: 14 May 2026


ARTIKEL POPULAR

AUD/USD inches lower after registering modest gains in the previous day, trading around 0.7250 during the Asian hours on Thursday. The technical analysis of the daily chart indicates that the pair is remaining within the ascending channel, suggesting an ongoing bullish bias.
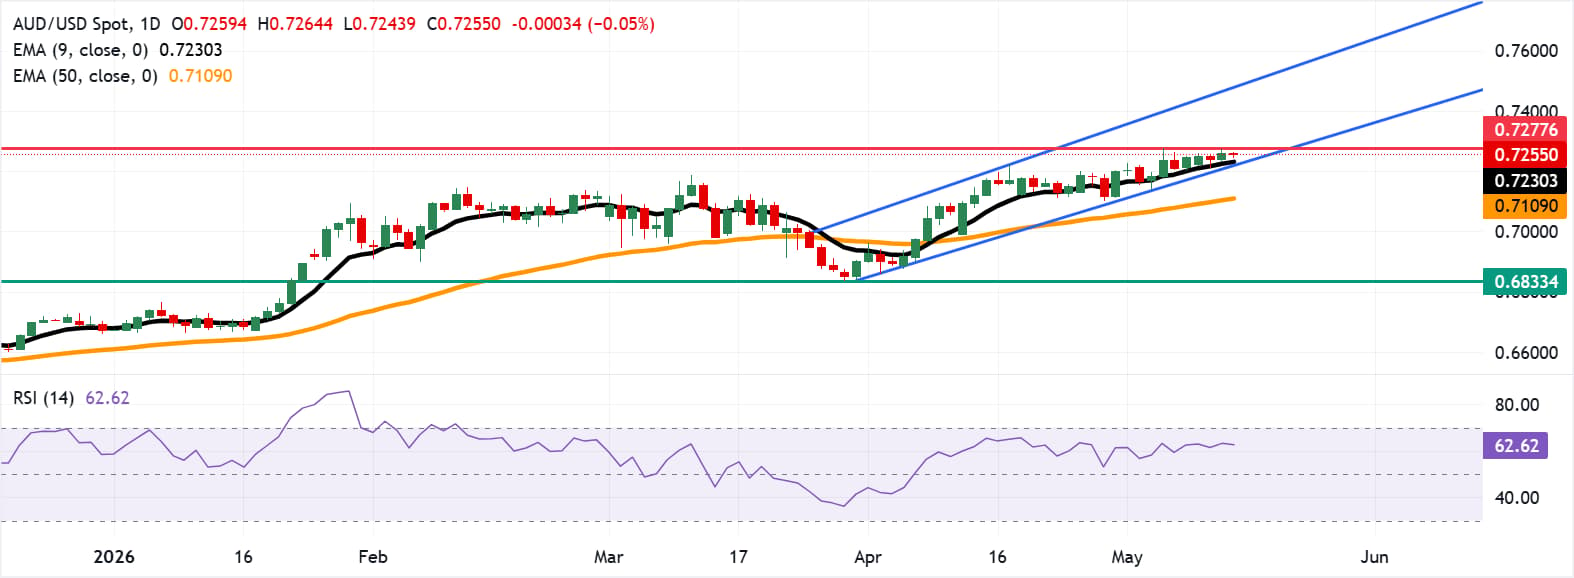
- AUD/USD may rebound toward 0.7277, the highest since June 2022.
- The 14-day Relative Strength Index of 63 indicates strong upward momentum.
- The pair may test the primary support at the nine-day EMA at 0.7230.
AUD/USD inches lower after registering modest gains in the previous day, trading around 0.7250 during the Asian hours on Thursday. The technical analysis of the daily chart indicates that the pair is remaining within the ascending channel, suggesting an ongoing bullish bias.
The near-term tone stays bullish as the AUD/USD pair holds above both the nine-period Exponential Moving Average (EMA) and the 50-period EMA, suggesting a constructive trend structure.
The 14-day Relative Strength Index (RSI) is around 63 points to firm but not extreme upside momentum, hinting that buyers still have the upper hand while the price approaches overhead levels.
The AUD/USD pair may retest the 0.7277, the highest since June 2022, recorded on May 6. A successful break above this level would support the pair to target the upper boundary of the ascending channel around 0.7480.
On the downside, the AUD/USD pair may test the immediate support at the nine-day EMA of 0.7230, aligned with the lower boundary of the ascending channel. Further declines below the channel would expose the 50-day EMA at 0.7109. A sustained break below the medium-term average would cause the bearish emergence and put downward pressure on the AUD/USD pair to navigate the region around the three-month low of 0.6833, which was recorded on March 30.
(The technical analysis of this story was written with the help of an AI tool.)
Australian Dollar Price Today
The table below shows the percentage change of Australian Dollar (AUD) against listed major currencies today. Australian Dollar was the weakest against the Canadian Dollar.
| USD | EUR | GBP | JPY | CAD | AUD | NZD | CHF | |
|---|---|---|---|---|---|---|---|---|
| USD | -0.01% | 0.06% | 0.02% | 0.00% | 0.03% | 0.00% | -0.05% | |
| EUR | 0.00% | 0.05% | -0.02% | -0.00% | -0.02% | -0.03% | -0.04% | |
| GBP | -0.06% | -0.05% | -0.04% | -0.06% | -0.05% | -0.08% | -0.07% | |
| JPY | -0.02% | 0.02% | 0.04% | -0.03% | -0.01% | -0.04% | -0.09% | |
| CAD | -0.01% | 0.00% | 0.06% | 0.03% | 0.03% | -0.02% | -0.01% | |
| AUD | -0.03% | 0.02% | 0.05% | 0.00% | -0.03% | -0.02% | 0.00% | |
| NZD | -0.00% | 0.03% | 0.08% | 0.04% | 0.02% | 0.02% | -0.00% | |
| CHF | 0.05% | 0.04% | 0.07% | 0.09% | 0.00% | -0.00% | 0.00% |
The heat map shows percentage changes of major currencies against each other. The base currency is picked from the left column, while the quote currency is picked from the top row. For example, if you pick the Australian Dollar from the left column and move along the horizontal line to the US Dollar, the percentage change displayed in the box will represent AUD (base)/USD (quote).

Lebih sejuta pengguna bergantung pada FXStreet untuk data pasaran masa nyata, alat carta, pandangan pakar dan berita Forex. Kalendar ekonomi yang komprehensif dan webinar pendidikan mereka membantu pedagang kekal bermaklumat dan membuat keputusan yang dikira. FXStreet disokong oleh pasukan kira-kira 60 profesional di ibu pejabat Barcelona dan pelbagai wilayah global.
Baca Lagi


