
Bitcoin Price Forecast: BTC stages modest rebound ahead of US PPI data
Oleh Manish Chhetri
Dikemas kini: 11 Jun 2026


ARTIKEL POPULAR

Bitcoin (BTC) recovers slightly, trading above $62,500 at the time of writing on Thursday after three consecutive days of losses earlier this week.
- Bitcoin recovers slightly, trading above $62,500 on Thursday after three consecutive days of losses.
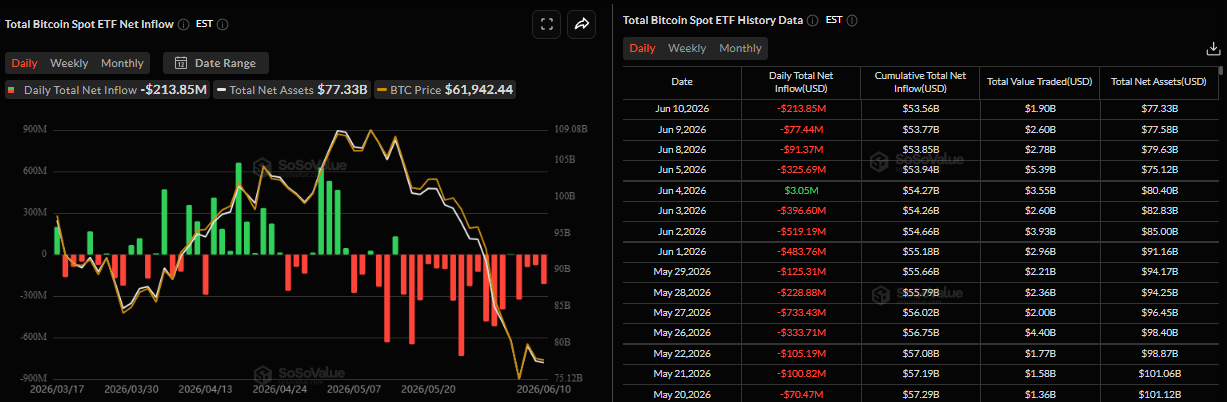
- US-listed spot ETFs recorded outflows of $213.85 million on Wednesday, indicating persistent withdrawals amid renewed US-Iran tensions.
- Investors await US PPI data on Thursday, which could shed more light on the Fed’s monetary policy stance.
Bitcoin (BTC) recovers slightly, trading above $62,500 at the time of writing on Thursday after three consecutive days of losses earlier this week. Despite the rebound, market sentiment remains fragile, as US-listed spot Bitcoin Exchange-Traded Funds (ETFs) recorded net outflows of $213.85 million on Wednesday, indicating persistent institutional withdrawals amid renewed US-Iran tensions. Market participants are now turning their attention to the US Producer Price Index (PPI) report on Thursday, which could provide fresh clues on the Federal Reserve’s (Fed) monetary policy outlook and drive the next move in BTC.
US-Iran talks are still on track despite the recent military exchange
Talks to reach a deal between the US and Iran are still on track after overnight negotiations, CNN reports on Thursday.
The discussions continued despite an overnight exchange of strikes between the US and Iran that threatened to complicate the diplomatic effort.
Meanwhile, Iran announced the closure of the Strait of Hormuz after the US launched a fresh wave of strikes across the country. Iran’s joint military command said that its armed forces will give a “crushing and decisive” response to any “aggression” from the US in the region.
These developments have kept geopolitical tensions elevated and uncertainty high, weighing on risk-sensitive assets such as Bitcoin, which has remained under pressure during the first half of this week but is recovering slightly, trading above $62,500 on Thursday.
US PPI data could bring fresh volatility in BTC
Investors now await the US May PPI data on Thursday, which could offer additional clues about the Fed monetary policy path and trigger fresh volatility across risk-sensitive assets. Headline PPI inflation is expected to accelerate to 6.4% year-over-year (YoY) rate in May from 6% in the previous month, while core PPI inflation, which excludes volatile food and energy prices, is expected to rise to 5.4% YoY from 5.2% in April. Monthly PPI and core PPI readings are expected to increase 0.7% and 0.5%, respectively, half the advance seen a month earlier.
On Wednesday, data from the US Bureau of Labor Statistics showed that core Consumer Price Index (CPI) inflation rised 0.2% in May, below the 0.3% forecast and to the previous month’s 0.4%, while the yearly rate accelerated 2.9%, from 2.8% previously, matching expectations.
On the other hand, headline CPI accelerated sharply 4.2% YoY in May from 3.8% in April, marking its highest level in three years, largely driven by a 23.5% surge in energy costs.
Traders should be cautious, as escalating US-Iran tensions risk disrupting oil supplies through the Strait of Hormuz, which could push Crude Oil prices higher. Higher energy prices could fuel inflationary pressures and reinforce expectations for a restrictive Fed policy stance, which does not bode well for risky assets such as BTC.
Institutional sell-off continues
Institutional selling continues so far this week. SoSoValue data shows that US-listed spot BTC ETFs recorded an outflow of $213.85 million on Wednesday, marking the third consecutive withdrawal so far this week. If this trend continues, BTC could see further correction ahead.
Bitcoin Price Forecast: Mild rebound
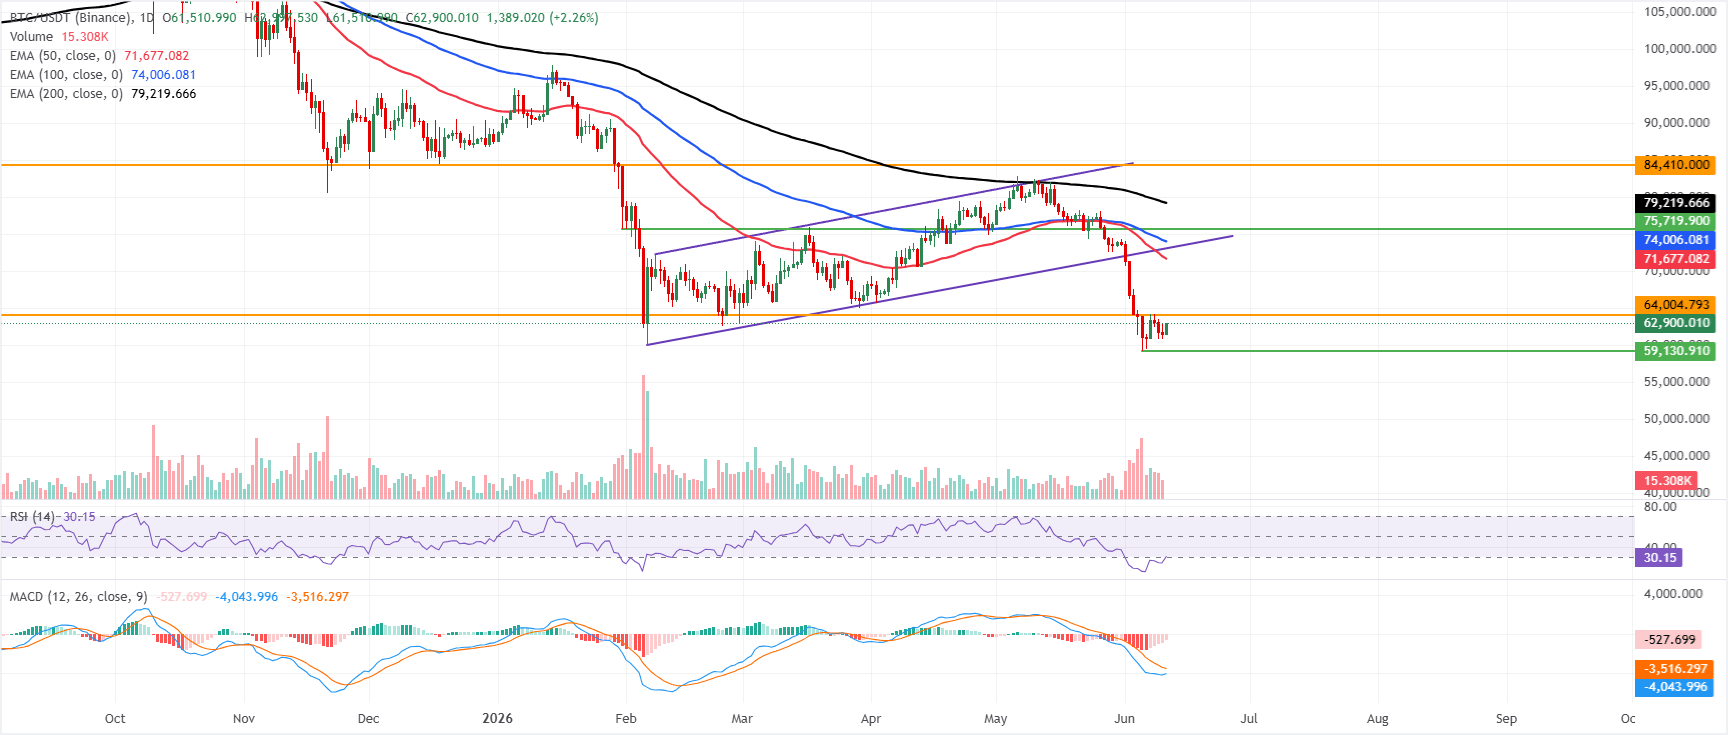
Bitcoin price trades at $62,900 on Wednesday, extending a bearish phase and remaining well below the 50-day, 100-day, and 200-day Exponential Moving Averages (EMAs) at $71,677, $74,006, and $79,219, respectively. The recent drop has also left the Crypto King below the previously supportive rising trendline, whose break point near $73,105 now reinforces the overhead supply zone.
Momentum remains bearish, with the Relative Strength Index (RSI) on the daily chart hovering just above the oversold band around 30 and the Moving Average Convergence Divergence (MACD) remaining negative, suggesting that downside pressure persists despite intermittent bounces.
On the topside, initial resistance is seen at the horizontal cap around $64,004, ahead of the 50-day EMA at $71,677. Above that, the former trendline support-turned-barrier near $73,105 and the 100-day EMA at $74,006 create a dense medium-term ceiling, while the 200-day EMA at $79,219 and the major horizontal level at $84,410 guard the broader bullish trend.
With no clear structural support levels defined by the current indicator set below spot, traders may look to prior swing lows and round numbers for potential demand. Still, the prevailing configuration keeps BTC vulnerable to further weakness while it trades under the aforementioned EMA cluster.
(The technical analysis of this story was written with the help of an AI tool.)
Bitcoin, altcoins, stablecoins FAQs
Bitcoin is the largest cryptocurrency by market capitalization, a virtual currency designed to serve as money. This form of payment cannot be controlled by any one person, group, or entity, which eliminates the need for third-party participation during financial transactions.
Altcoins are any cryptocurrency apart from Bitcoin, but some also regard Ethereum as a non-altcoin because it is from these two cryptocurrencies that forking happens. If this is true, then Litecoin is the first altcoin, forked from the Bitcoin protocol and, therefore, an “improved” version of it.
Stablecoins are cryptocurrencies designed to have a stable price, with their value backed by a reserve of the asset it represents. To achieve this, the value of any one stablecoin is pegged to a commodity or financial instrument, such as the US Dollar (USD), with its supply regulated by an algorithm or demand. The main goal of stablecoins is to provide an on/off-ramp for investors willing to trade and invest in cryptocurrencies. Stablecoins also allow investors to store value since cryptocurrencies, in general, are subject to volatility.
Bitcoin dominance is the ratio of Bitcoin's market capitalization to the total market capitalization of all cryptocurrencies combined. It provides a clear picture of Bitcoin’s interest among investors. A high BTC dominance typically happens before and during a bull run, in which investors resort to investing in relatively stable and high market capitalization cryptocurrency like Bitcoin. A drop in BTC dominance usually means that investors are moving their capital and/or profits to altcoins in a quest for higher returns, which usually triggers an explosion of altcoin rallies.

Lebih sejuta pengguna bergantung pada FXStreet untuk data pasaran masa nyata, alat carta, pandangan pakar dan berita Forex. Kalendar ekonomi yang komprehensif dan webinar pendidikan mereka membantu pedagang kekal bermaklumat dan membuat keputusan yang dikira. FXStreet disokong oleh pasukan kira-kira 60 profesional di ibu pejabat Barcelona dan pelbagai wilayah global.
Baca Lagi


