
Cardano Price Forecast: ADA bearish signals grow, but whale accumulation hints at a twist
Oleh Manish Chhetri
Dikemas kini: 27 Mar 2026


ARTIKEL POPULAR

Cardano (ADA) price is struggling, trading below $0.26 as of writing on Friday, nearly wiping out its recovery from earlier this week. Derivatives and technical indicators support this bearish bias, while certain whales are buying aggressively, which could cushion further downside.
- Cardano price trades in the red on Friday, nearly erasing its recovery from earlier this week.
- Derivatives data and the technical outlook suggest a bearish outlook, with falling open interest and weakening momentum.
- Despite the correction, Santiment shows certain whale accumulation, suggesting some investors are buying the dip.
Cardano (ADA) price is struggling, trading below $0.26 as of writing on Friday, nearly wiping out its recovery from earlier this week. Derivatives and technical indicators support this bearish bias, while certain whales are buying aggressively, which could cushion further downside.
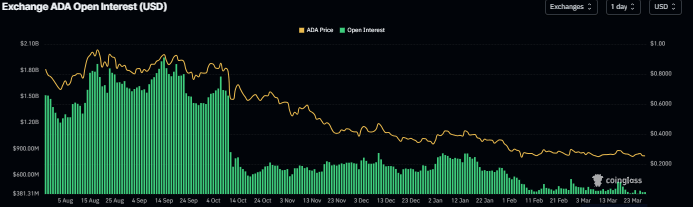
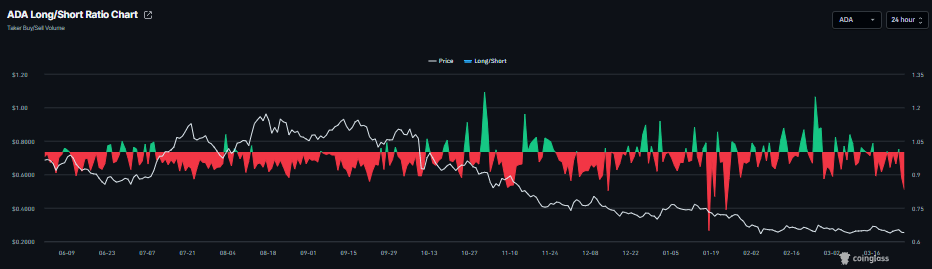
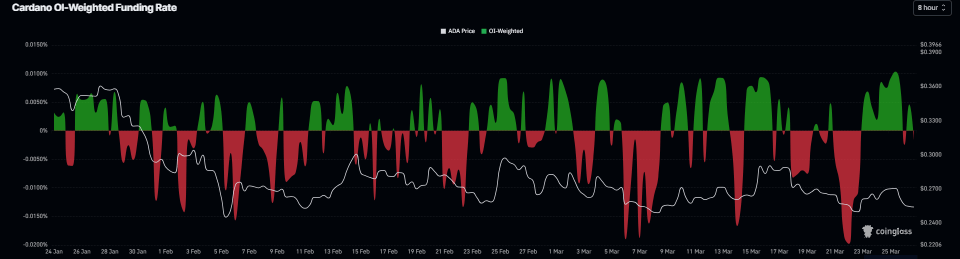
Derivatives metrics project a bearish bias for Cardano
Cardano’s futures Open Interest (OI) dropped to $402.94 million on Friday and has been steadily falling since mid-March. This drop in OI reflects waning investor participation and projects a bearish outlook.
In addition, CoinGlass’s ADA long-to-short ratio, currently at 0.83 on Friday, is near its lowest level in over a month. This ratio, below one, reflects bearish sentiment in the markets, as more traders are betting on the asset price to fall.
CoinGlass funding rates data also supports negative sentiment. The metric flipped to a negative rate on Friday, reading -0.0015%, indicating shorts are paying longs and suggesting bearish sentiment toward ADA.
Some whales are buying Cardano’s dips
Despite the bearish outlook, on-chain data from the Santiment chart below shows that certain whales have started accumulating ADA.
The Supply Distribution metric indicates that whales holding between 100,000 and 1 million ADA tokens (red line) and 10 million and 100 million ADA tokens (blue line) have accumulated a total of 270 million tokens from Wednesday to Friday. During the same period, wallets holding between 1 million and 10 million ADA tokens (yellow line) have shed 20 million tokens.
This shows that the second cohort of whales could have fallen prey to the capitulation event. In contrast, the first set of wallets seized the opportunity and accumulated Cardano at a discount. Moreover, if this buying actively continues, it could provide some cushion against further downside.
 [08-1774586426358-1774586426359.42.01, 27 Mar, 2026].png)
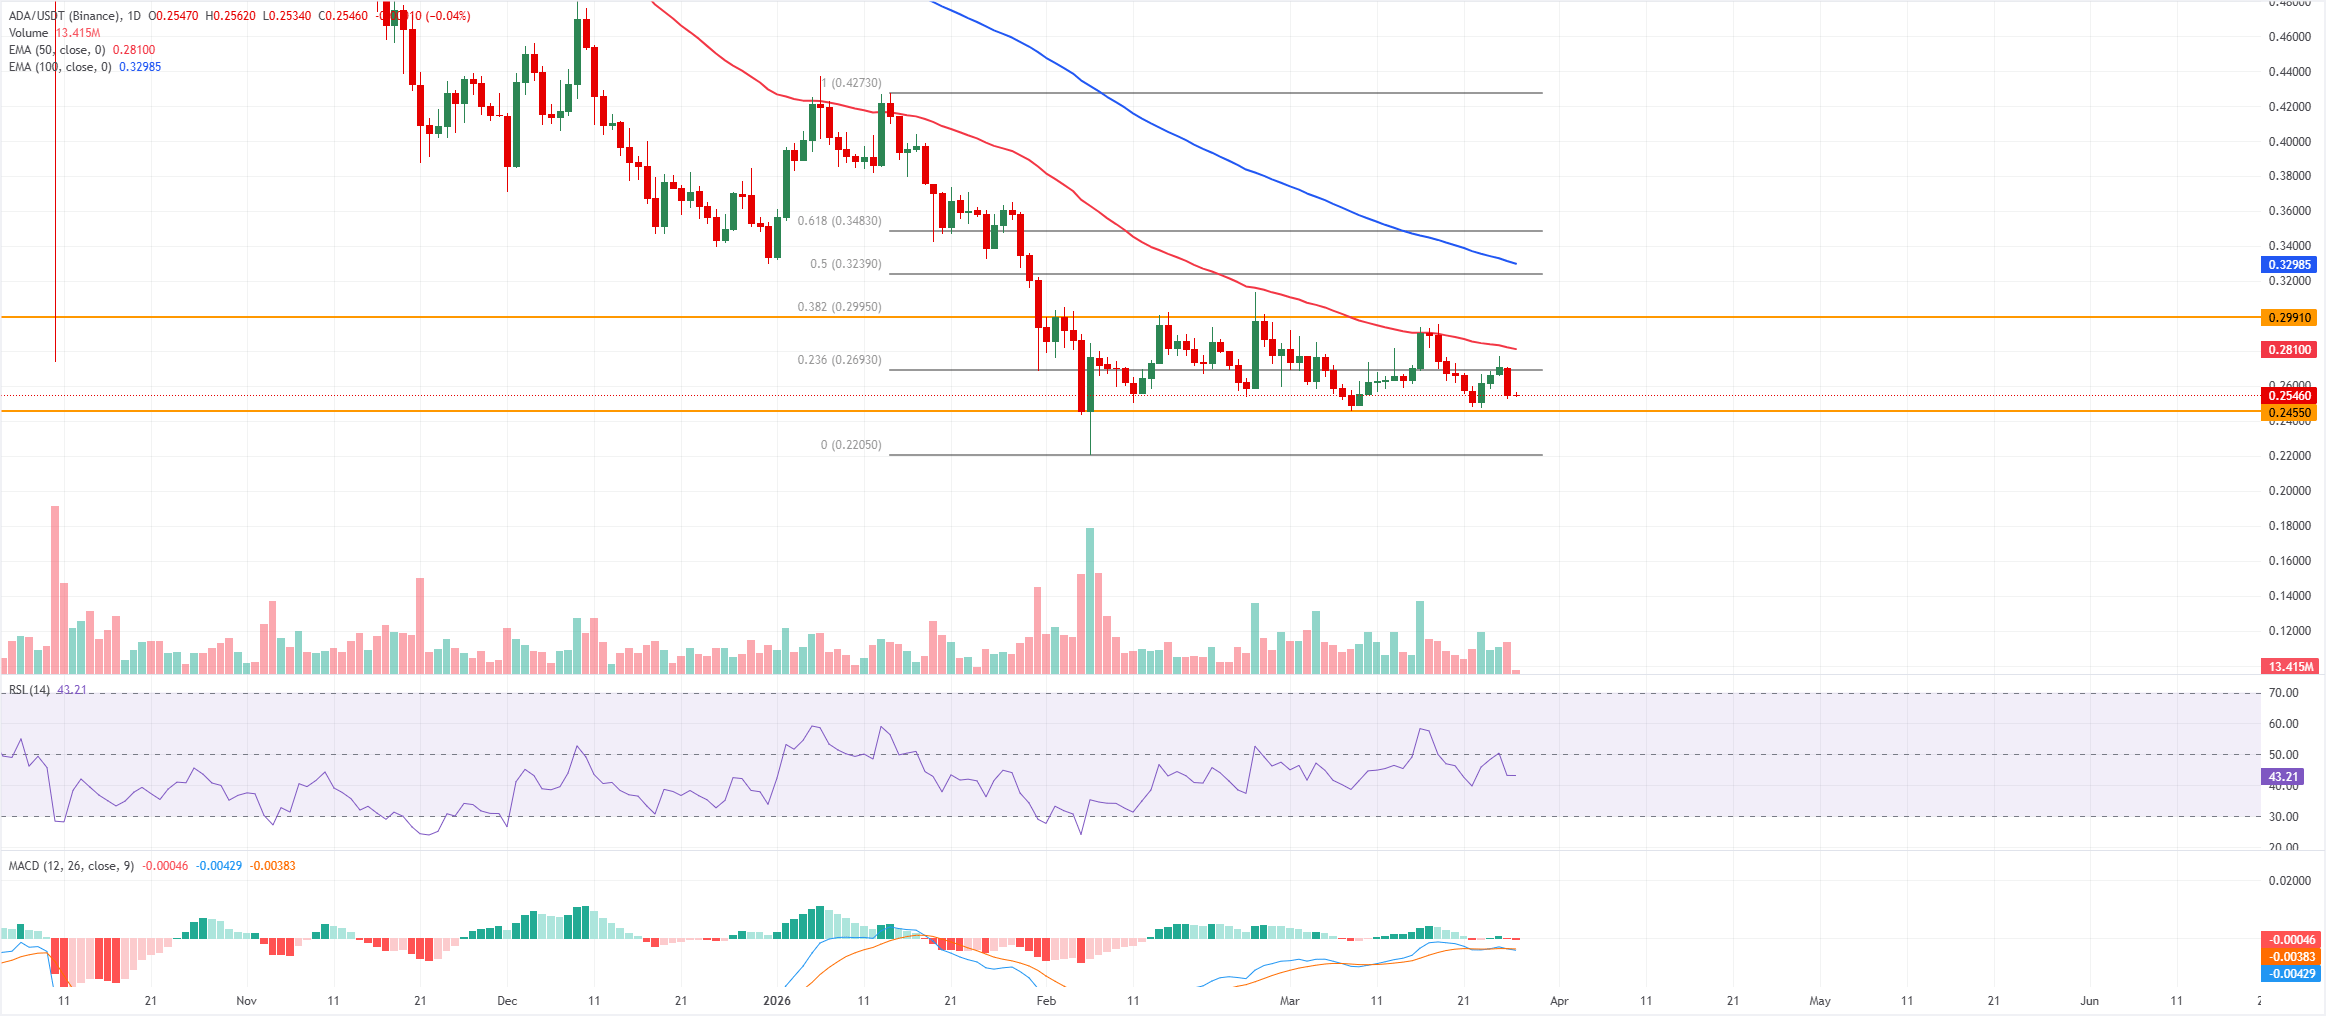
Cardano Price Forecast: Sellers in control
Cardano price is trading below $0.27 as of Friday, after falling nearly 6% the previous day. The near-term bias is mildly neutral, with a bearish tilt, as price holds below the 50-day and 100-day Exponential Moving Averages, keeping the broader downtrend intact despite recent stabilization.
Daily closes remain compressed between $0.25 and the mid-$0.26 area, while the Relative Strength Index (RSI) on the daily chart near 43 stays below the 50 midline, indicating subdued upside momentum. The Moving Average Convergence Divergence (MACD) indicator has slipped marginally back below the signal line around the zero area, reinforcing a lack of sustained bullish pressure and pointing to ongoing consolidation within a broader corrective phase.
Immediate support is seen at the horizontal level of $0.24, which protects the recent lows; a break below this floor would expose the next bearish objective toward the $0.23–$0.22 area, closer to the Fibonacci origin of the broader upswing.
On the upside, the first resistance aligns with the 23.6% Fibonacci retracement of the prior decline from $0.42 to $0.22 at $0.27, with stronger resistance at the 38.2% retracement and an overlapping horizontal barrier near $0.30. A daily close above this upper band would be needed to neutralize the bearish tilt and open the door to a recovery toward the $0.32 region, where the 50% retracement stands as a more significant structural cap.
(The technical analysis of this story was written with the help of an AI tool.)

Lebih sejuta pengguna bergantung pada FXStreet untuk data pasaran masa nyata, alat carta, pandangan pakar dan berita Forex. Kalendar ekonomi yang komprehensif dan webinar pendidikan mereka membantu pedagang kekal bermaklumat dan membuat keputusan yang dikira. FXStreet disokong oleh pasukan kira-kira 60 profesional di ibu pejabat Barcelona dan pelbagai wilayah global.
Baca Lagi


