
Cardano Price Forecast: ADA slips below $0.37 as holders offload tokens
Oleh Manish Chhetri
Tarikh Diterbitkan: 23 Dec 2025 | Tarikh Diubah: 23 Dec 2025


ARTIKEL POPULAR

Cardano (ADA) price trades below $0.37 at the time of writing on Tuesday after hitting a two-month low in the previous week. The bearish sentiment is further strengthened by holders offloading ADA, increasing selling pressure.
- Cardano price trades in the red on Tuesday after reaching a two-month low last week.
- Santiment data indicate that ADA holders are offloading tokens, adding to growing sell-side pressure.
- Derivatives data and technical indicators suggest further downside, with rising short positions and weakening momentum.
Cardano (ADA) price trades below $0.37 at the time of writing on Tuesday after hitting a two-month low in the previous week. The bearish sentiment is further strengthened by holders offloading ADA, increasing selling pressure. Meanwhile, rising short bets and weakening momentum further indicate downside pressure for Cardano.
Cardano whales offload 90 million tokens
Santiment’s Supply Distribution indicates that the number of Cardano’s large-wallet holders is declining, suggesting a bearish outlook.
The metric indicates that the whales holding between 100,000 and 1 million (red line), 1 million and 10 million (yellow line), and 10 million and 100 million (blue line) have shed a total of 90 million Cardano tokens from Saturday to Tuesday, thereby increasing selling pressure.
 [11-1766472952907-1766472952919.02.51, 23 Dec, 2025].png)
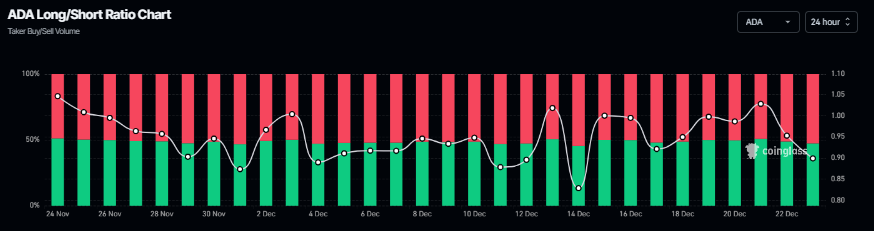
On the derivatives side, Coinglass’s long-to-short ratio for ADA reads 0.89 on Tuesday. The ratio below one suggests bearish sentiment in the market, as more traders are betting on the ADA price to fall.
Cardano Price Forecast: ADA bears aiming for levels below $0.27
Cardano price was rejected from the upper trendline of the falling wedge pattern (formed by connecting multiple highs and lows with two trendlines since mid-October) on December 9 and declined 27% in the next 9 days, reaching a two-month low of $0.34 on Friday. ADA recovered slightly but failed to sustain the rebound and continued its correction. At the time of writing on Tuesday, ADA is trading down, around $0.36.
If ADA continues its downward trend, it could extend the fall toward the October 10 low of $0.27.
The Relative Strength Index (RSI) on the daily chart is at 37, pointing downward toward the oversold level, indicating strong bearish momentum. Additionally, the Moving Average Convergence Divergence (MACD) indicator showed a bearish crossover on Wednesday, which remains intact, further supporting the negative outlook.
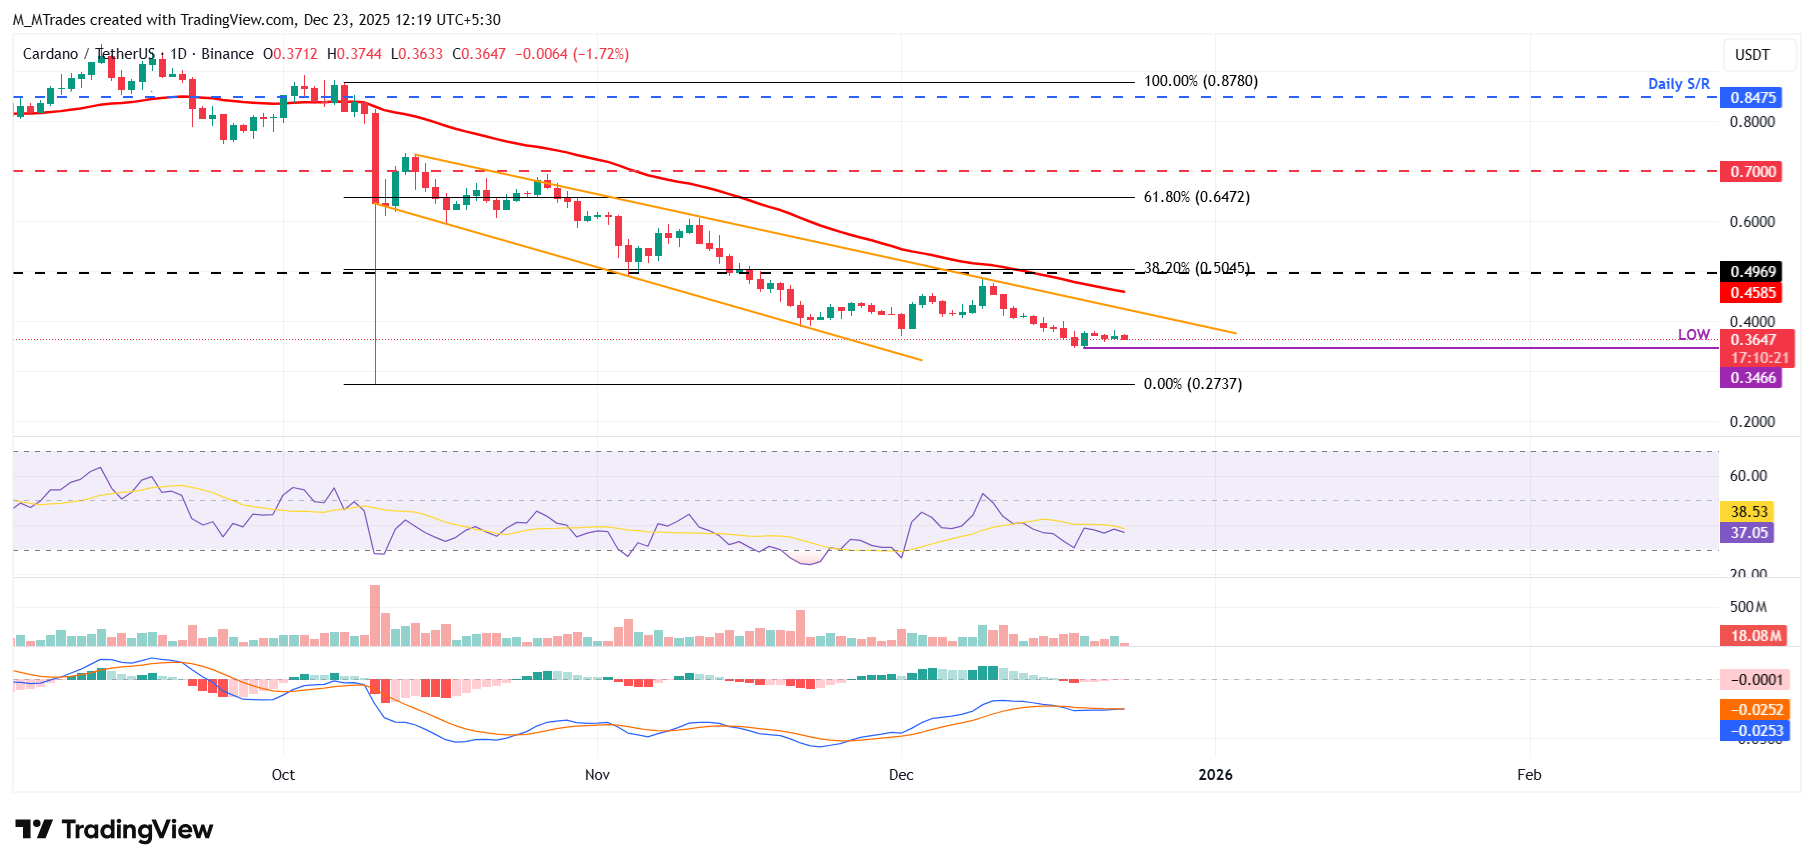
However, if ADA recovers, it could extend the advance toward the 50-day EMA at $0.45.

Lebih sejuta pengguna bergantung pada FXStreet untuk data pasaran masa nyata, alat carta, pandangan pakar dan berita Forex. Kalendar ekonomi yang komprehensif dan webinar pendidikan mereka membantu pedagang kekal bermaklumat dan membuat keputusan yang dikira. FXStreet disokong oleh pasukan kira-kira 60 profesional di ibu pejabat Barcelona dan pelbagai wilayah global.
Baca Lagi


