
Crypto Today: Bitcoin, Ethereum, XRP intensify sell-off as tariff uncertainty weighs
Oleh John Isige
Tarikh Diterbitkan: 23 Feb 2026 | Tarikh Diubah: 23 Feb 2026


ARTIKEL POPULAR

Bitcoin (BTC), Ethereum (ETH) and Ripple (XRP) are trading amid increasing selling pressure at the time of writing on Monday, as investors react to fresh trade uncertainty over United States (US) President Donald Trump’s push for more tariffs.
- Bitcoin holds above $66,000 but remains under pressure as total crypto liquidations near $500 million over the past 24 hours.
- Ethereum extends its downtrend below $1,900, weighed down by low retail participation.
- XRP broadens its losses for the second consecutive day amid a deteriorating technical picture.
Bitcoin (BTC), Ethereum (ETH) and Ripple (XRP) are trading amid increasing selling pressure at the time of writing on Monday, as investors react to fresh trade uncertainty over United States (US) President Donald Trump’s push for more tariffs.
Crypto sell-off accelerates as tariff pressure lingers
In a landmark ruling on Friday, the US Supreme Court found that President Trump overstepped his authority by imposing global trade tariffs. The ruling established that the International Emergency Economic Powers Act (IEEPA) does not grant the president the power to impose such taxes without Congress's approval. Congress holds the constitutional authority to tax and regulate trade.
However, President Trump criticized the ruling and swiftly signed another executive order imposing a blanket 10% global tariff under Section 122 of the Trade Act of 1974 of the US Constitution. This law allows for an interim 150-day tax to address balance-of-payments issues.
A separate directive on Saturday said the new global tariff would be raised to 15%, the maximum allowed under Section 122 of the Trade Act of 1974.
The crypto market, which has remained under pressure since the fourth quarter of 2025, has been hit by a fresh wave of headwinds, briefly pushing Bitcoin to an intraday low of $64,291.
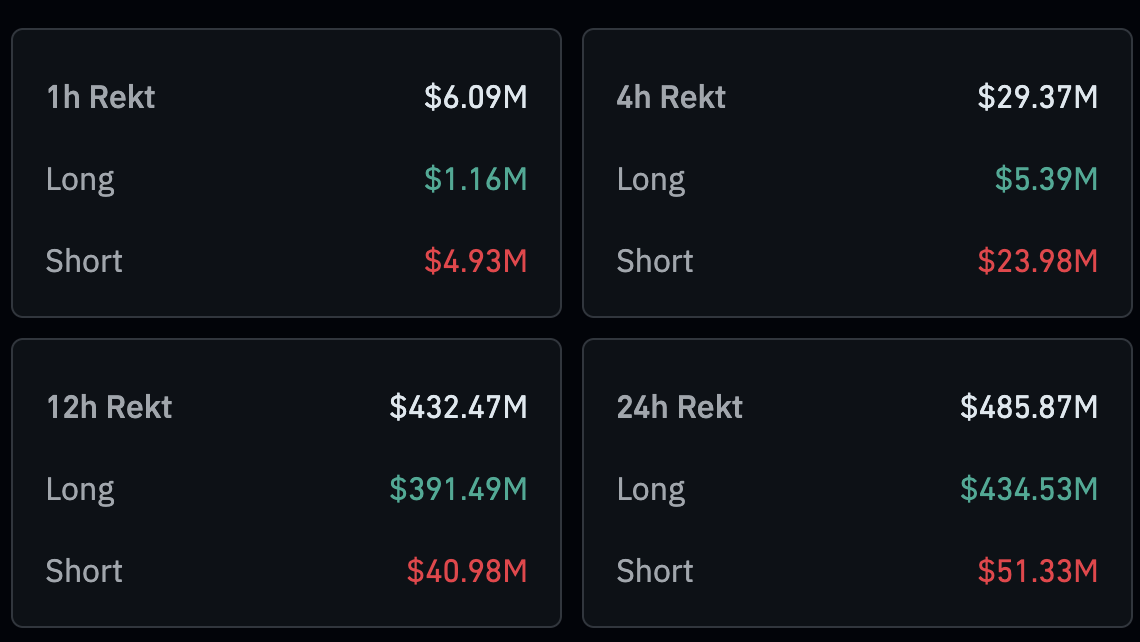
Retail traders are bearing the biggest brunt, with liquidation in the derivatives market averaging $486 million over the last 24 hours. If the sell-off persists amid uncertainty in the global trade market, leveraged position holders may incur losses, further deteriorating the market structure.
Ethereum faces a steady decline in retail interest, with futures Open Interest (OI) down to $23.88 billion on Monday from $24.22 billion the previous day. After the ETF futures OI peaked at $70.13 billion in August, the sell-off from its record high of $4,956 has not cooled.
Ethereum requires steady growth in retail demand to sustain its recovery, as the lack of derivatives support leaves the smart contract token vulnerable to sell-side pressure, especially if macroeconomic uncertainty and geopolitical tensions persist.
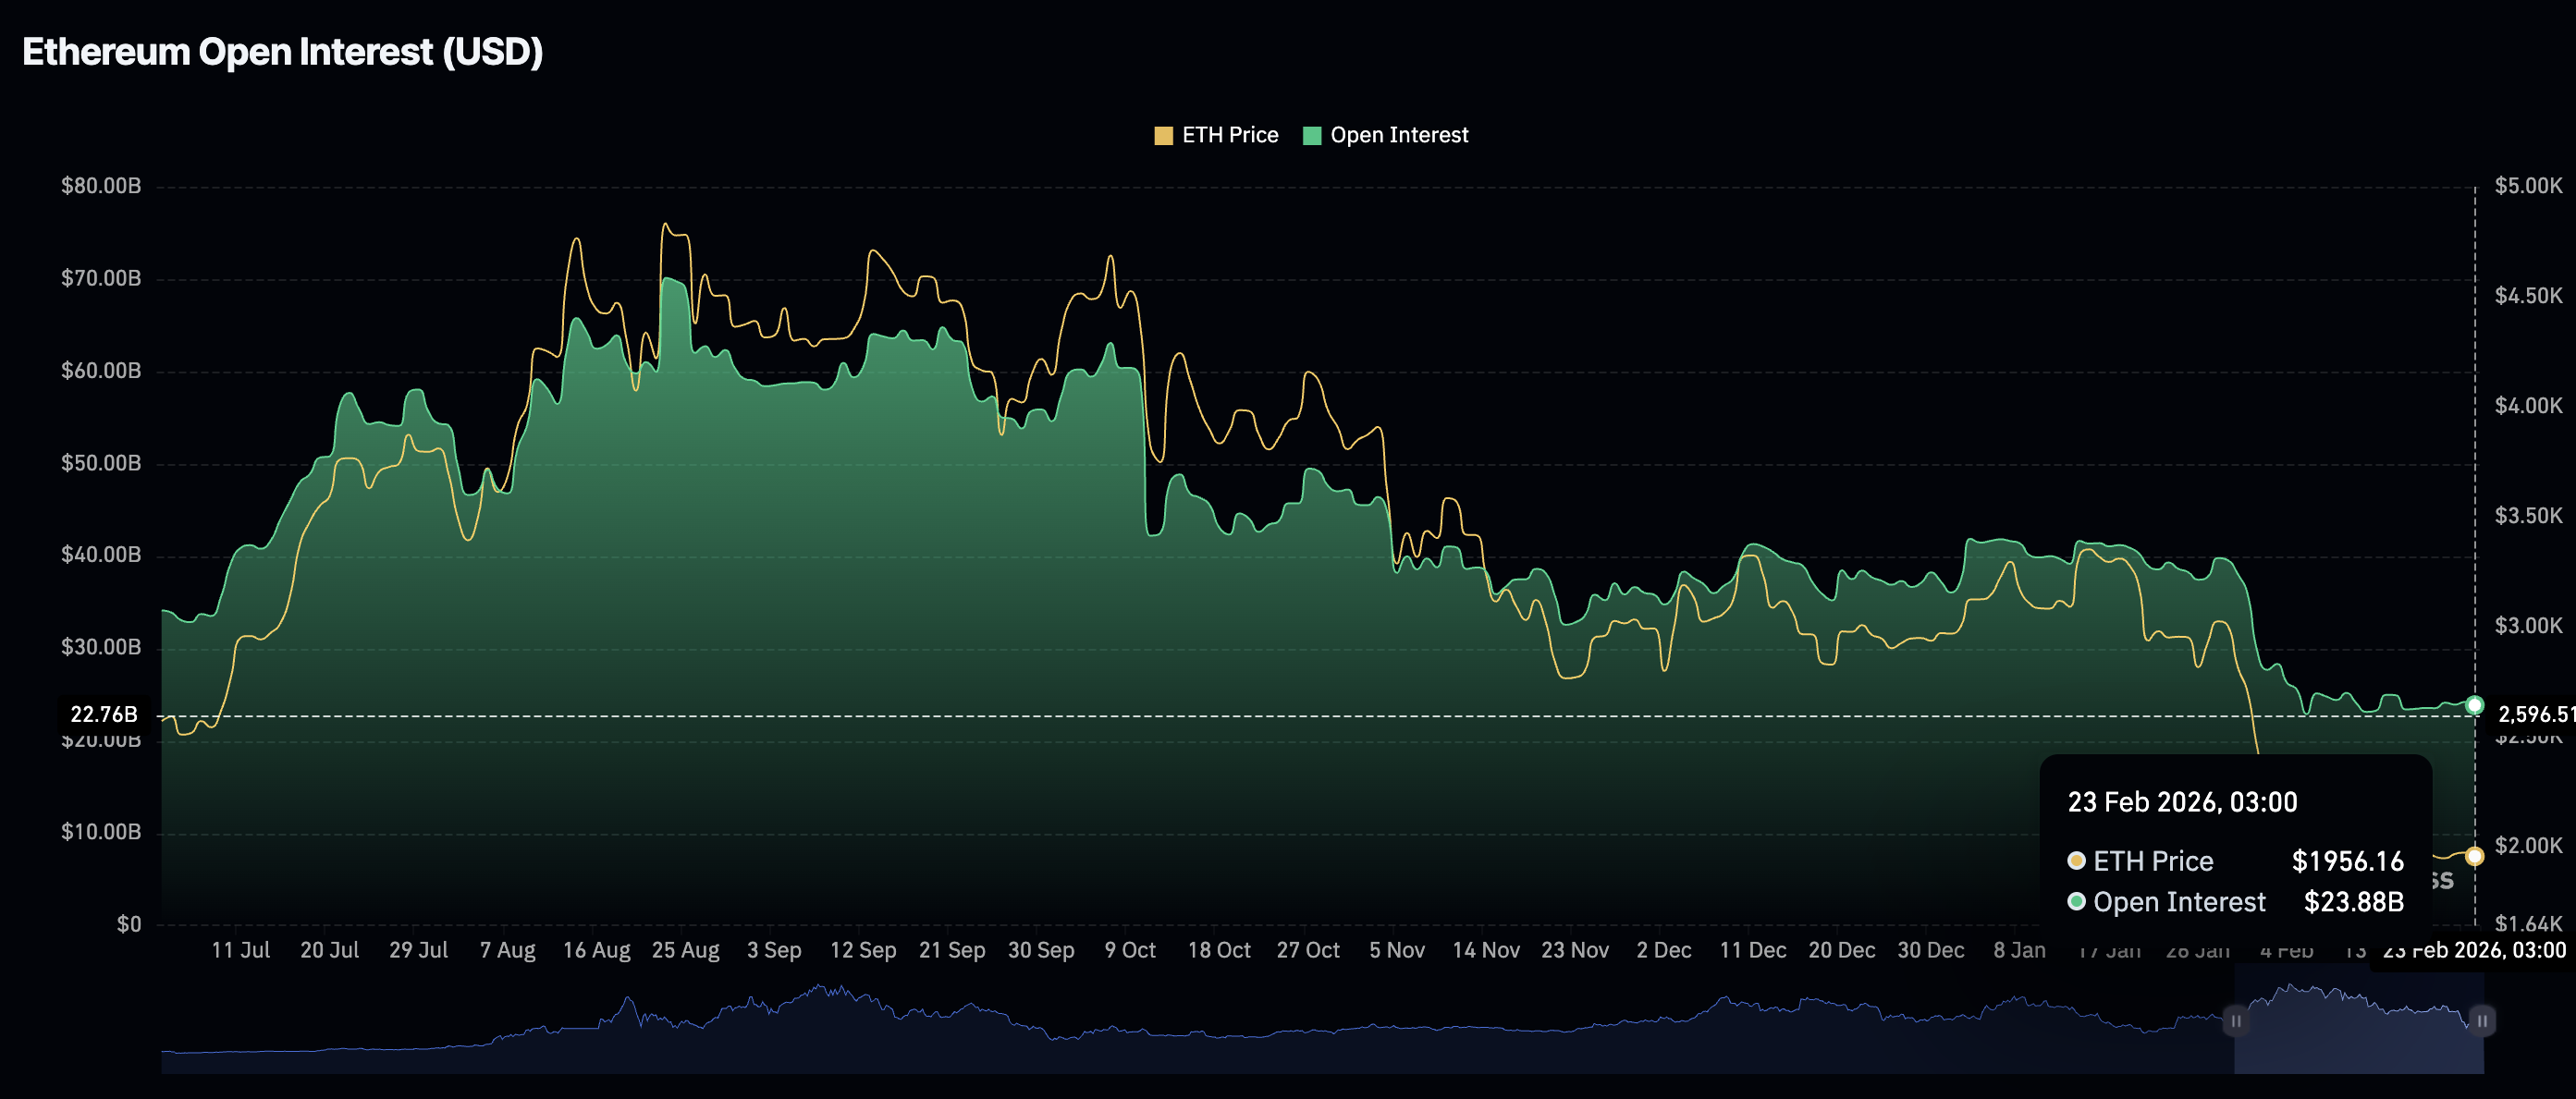
Chart of the day: Bitcoin sellers tighten their grip
Bitcoin hovers above $66,000, positioned well below the downward-trending 50-day Exponential Moving Average (EMA) at $77,427, the 100-day EMA at $84,845 and the 200-day EMA at $92,085.
Key technical indicators, such as the Relative Strength Index (RSI) at 34 on the daily chart, suggest bearish momentum may persist into upcoming sessions. The SuperTrend indicator appears to cap BTC’s upside at $72,271. Hence, traders should not lose sight of the intraday low at $64,291, which is likely to absorb selling pressure and stop further declines toward $60,000.
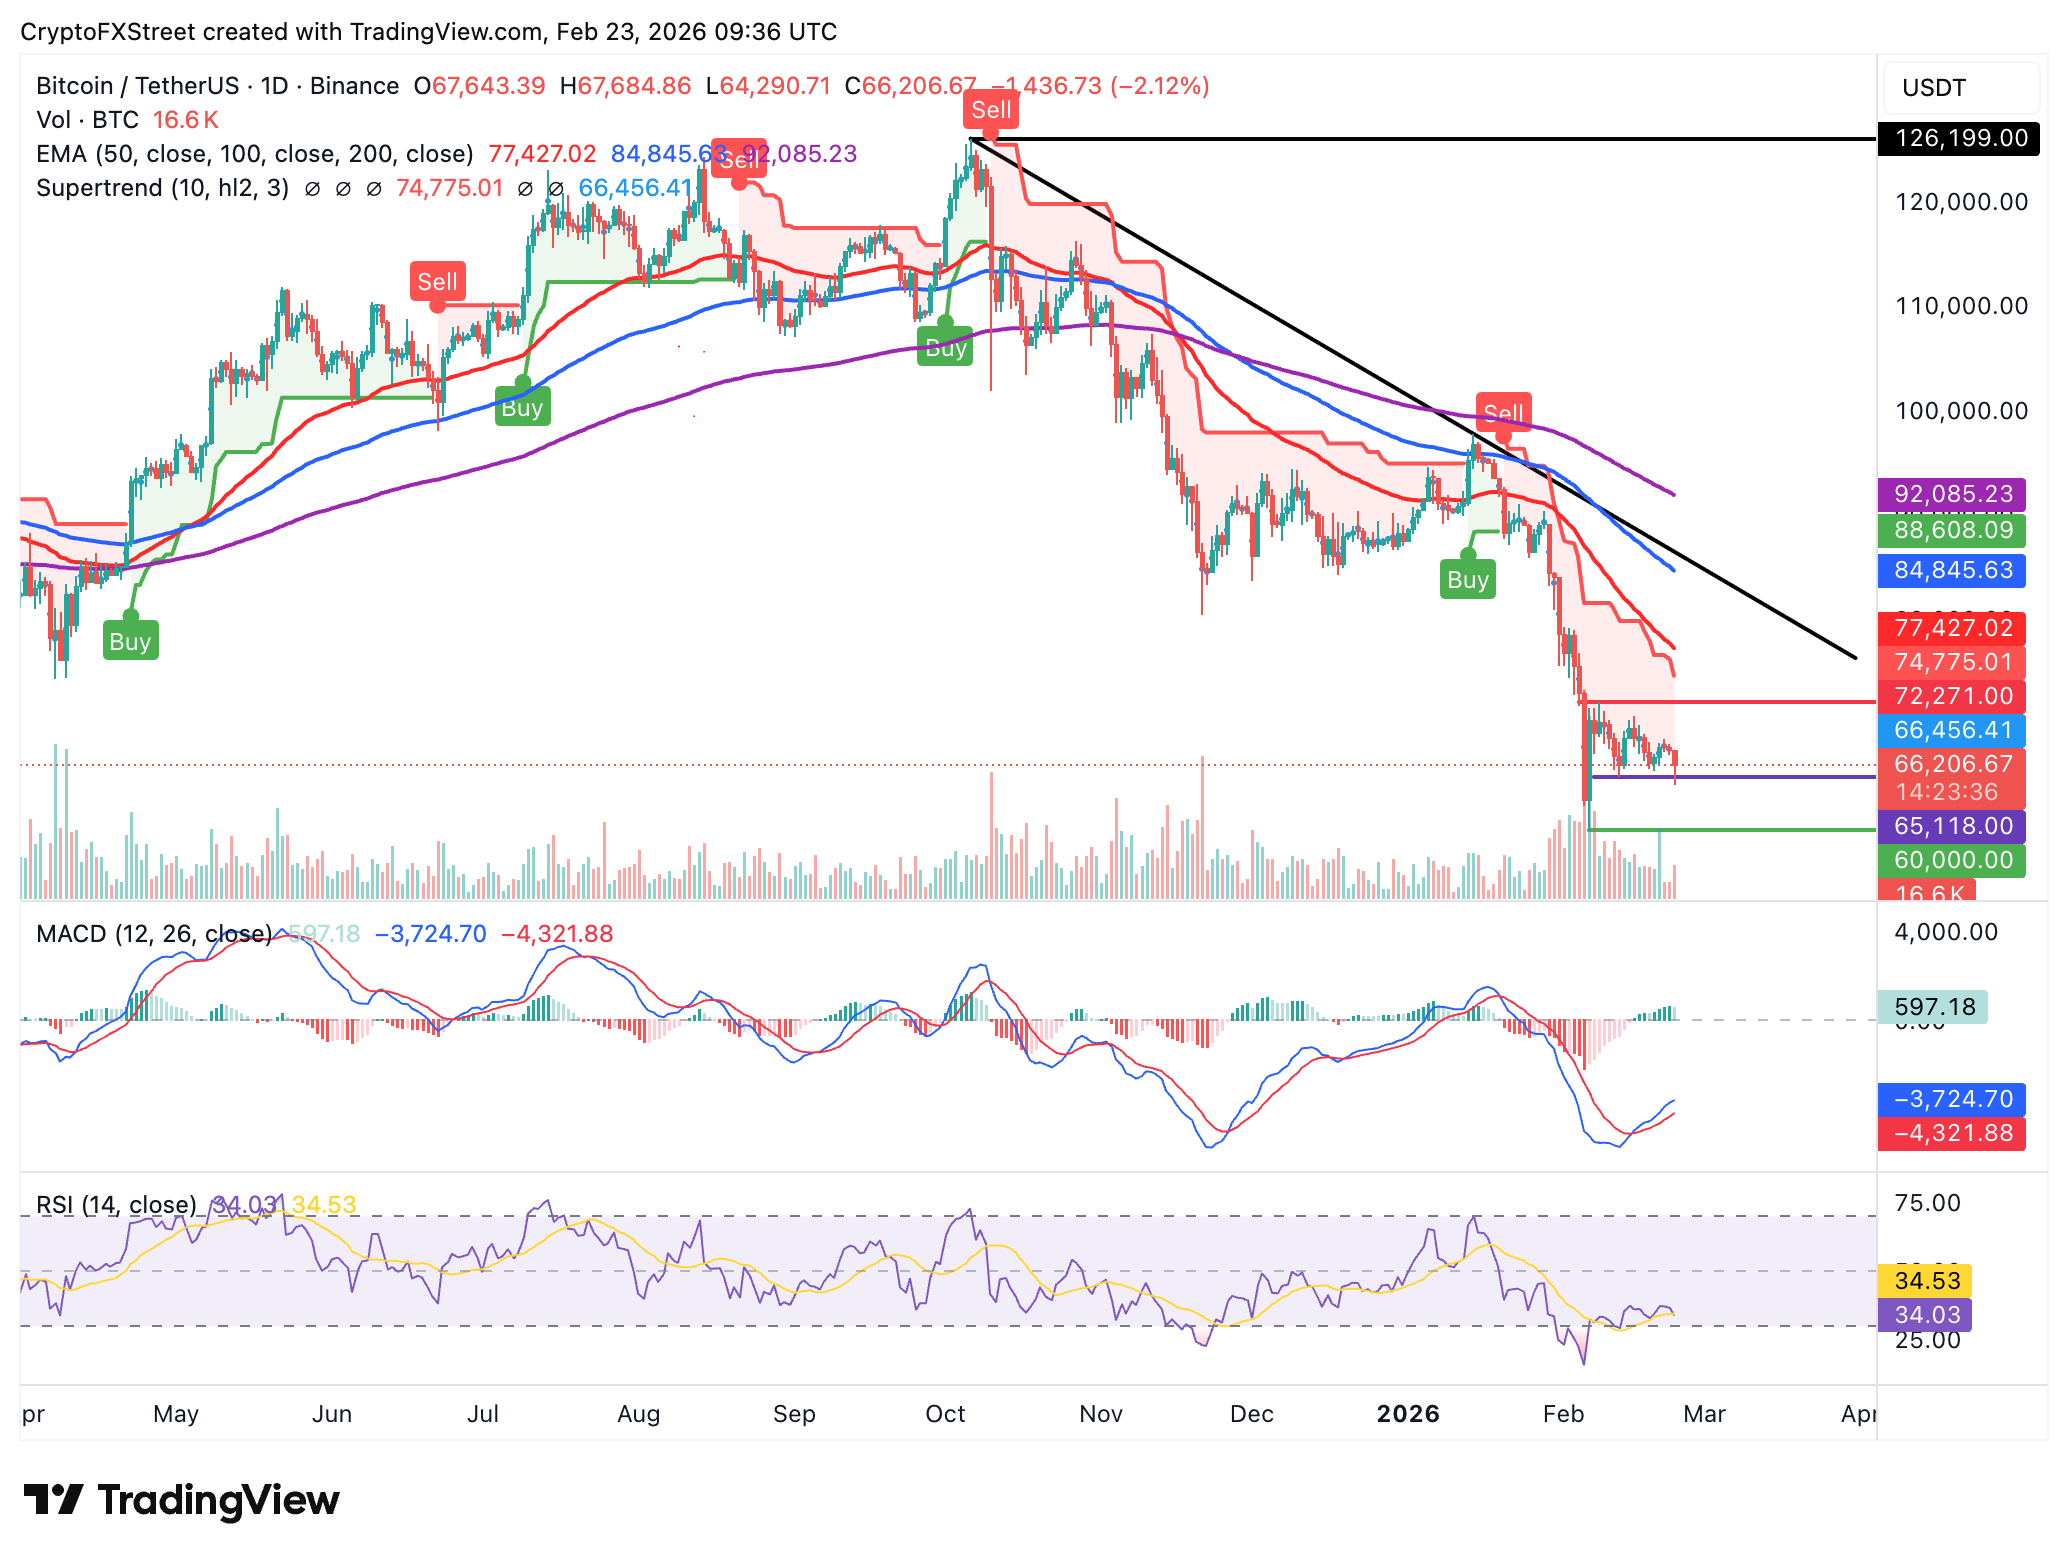
Still, the Moving Average Convergence Divergence (MACD) indicator remains above its signal line, suggesting that bulls have a slight upper hand. However, as the green histogram bars contract, overhead pressure could intensify, leading to an extended sell-off.
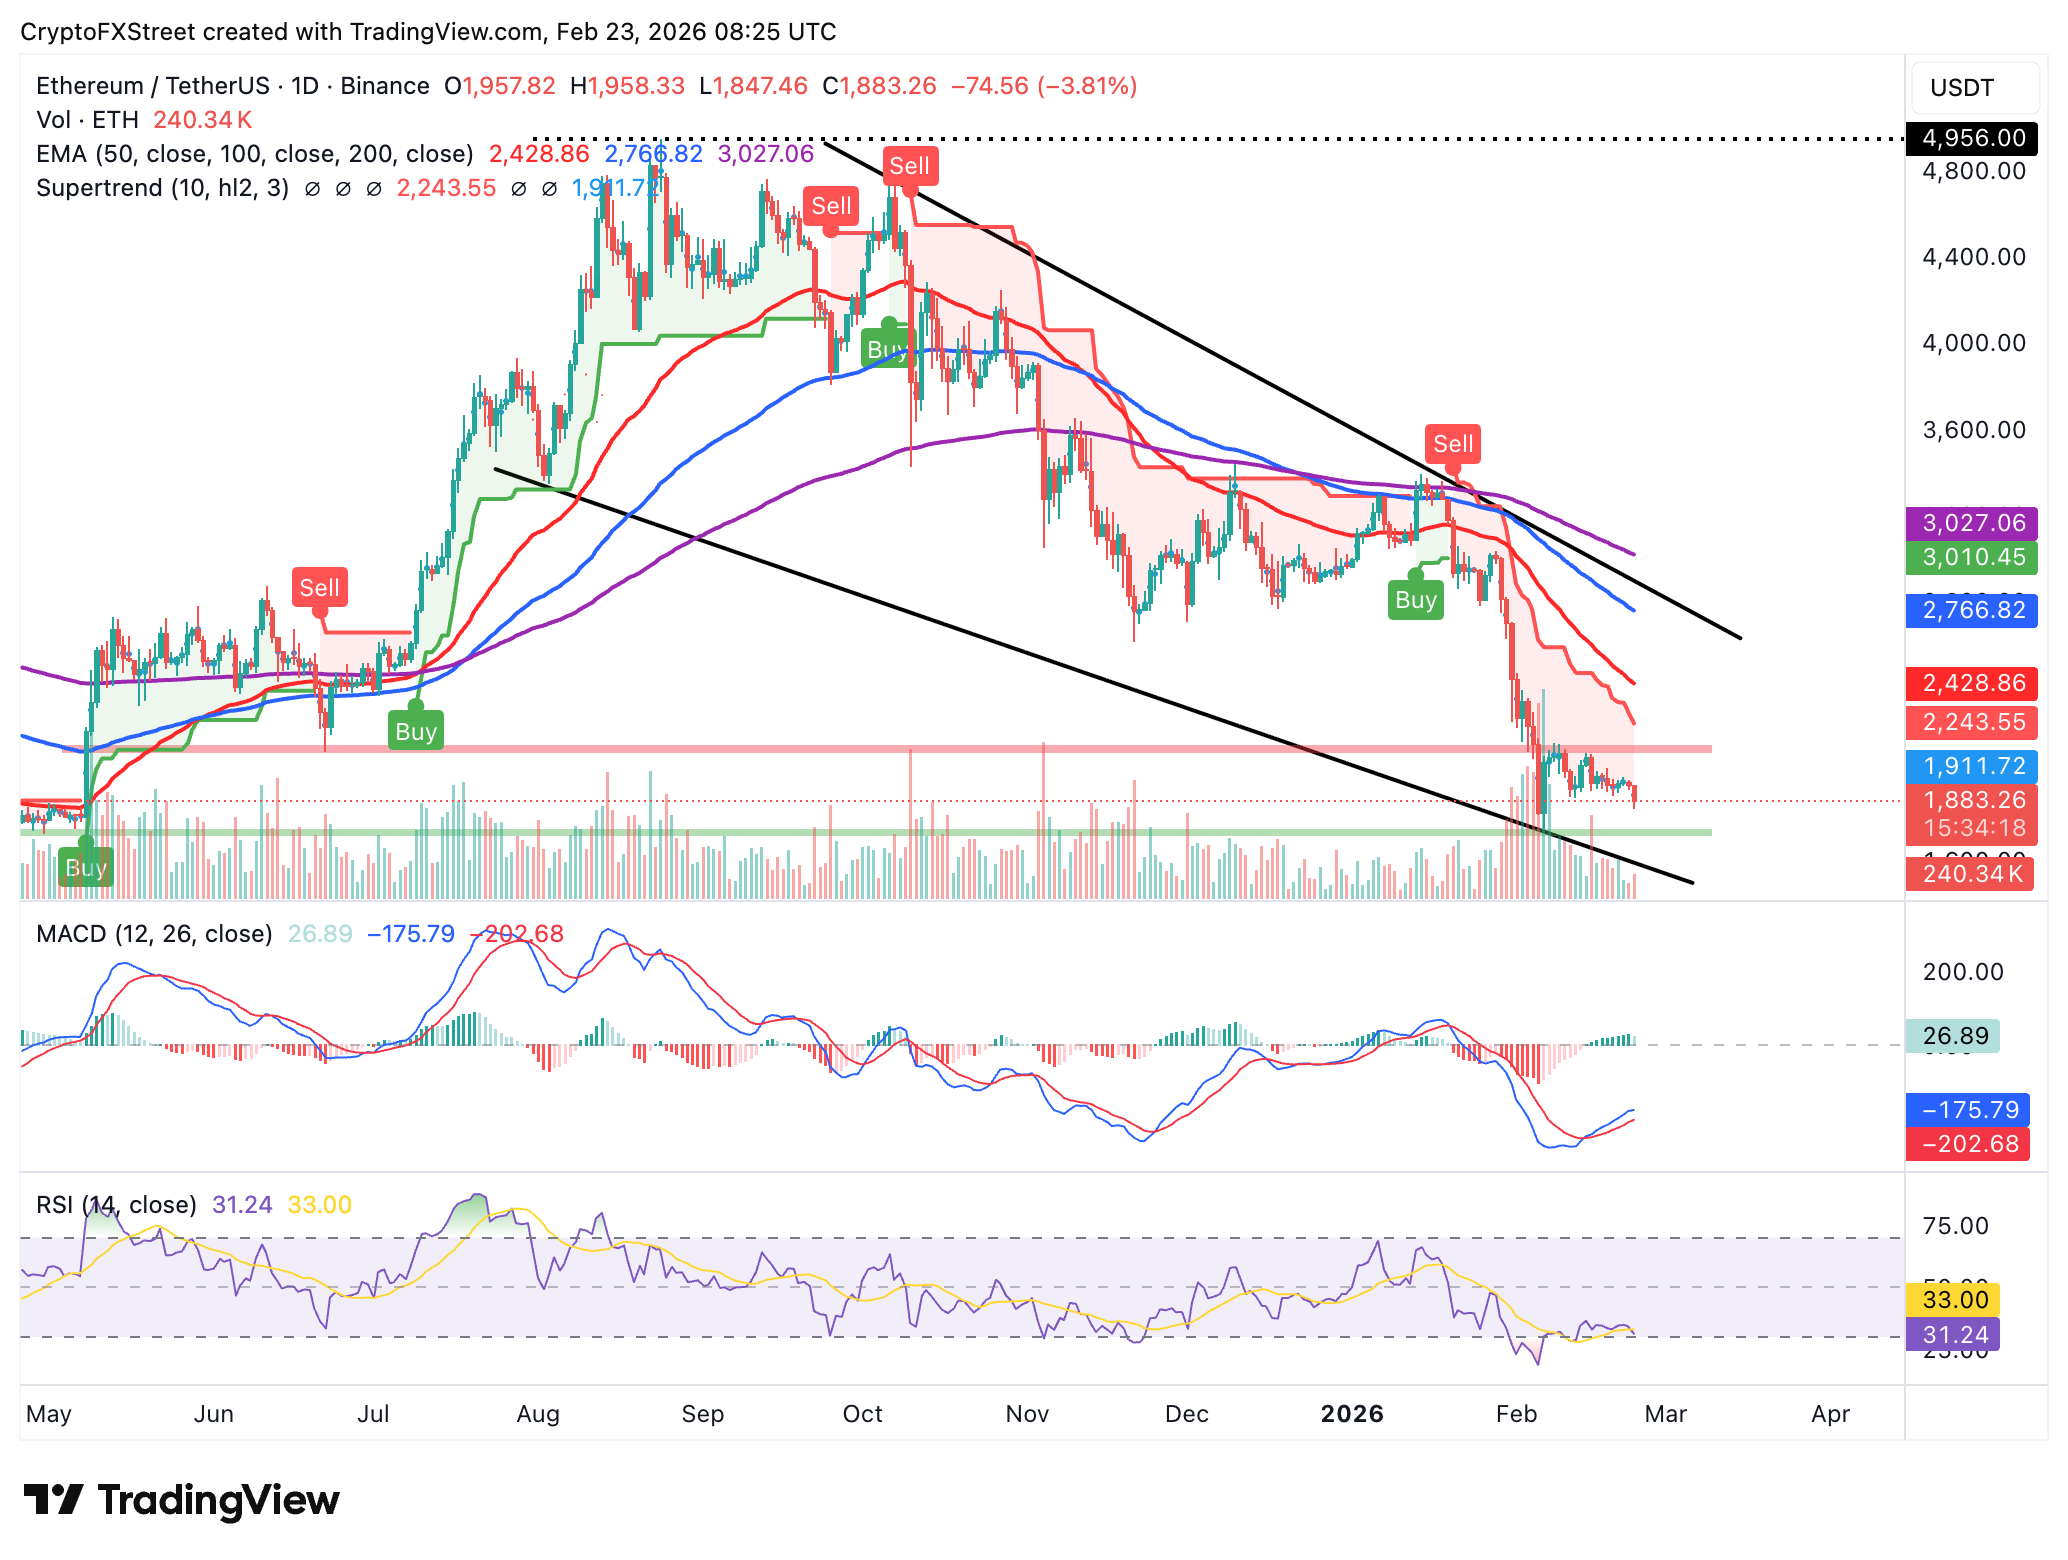
Altcoins technical outlook: Ethereum, XRP slide as sell-off jitters intensify
Ethereum is trading below the support-turned-resistance at $1,900 while holding above its intraday low of $1,847. The leading smart contract token also sits below the falling 50-day EMA at $2,428, the 100-day EMA at $2,767 and the 200-day EMA at $3,027.
The RSI indicator at 33 is sliding toward oversold territory, a scenario that could escalate the prevailing bearish momentum. Below the intraday low, Ethereum may stretch the downtrend to the February 6 low of $1,748.
However, the MACD indicator holds above its signal line, suggesting that, to some extent, bulls can turn the tables and push for a recovery above $1,900, with eyes on highs past $2,000.
XRP also succumbed to the headwinds in the broader crypto market, falling to trade above $1.36. The remittance token’s upside appears limited by the SuperTrend indicator at $1.63, the downward-trending 50-day EMA at $1.66, the 100-day EMA at $1.87, and the 200-day EMA at $2.09.
At the same time, the RSI at 36 on the daily chart suggests that bearish momentum is building, which is likely to accelerate XRP’s decline to the October 10 low of $1.25.
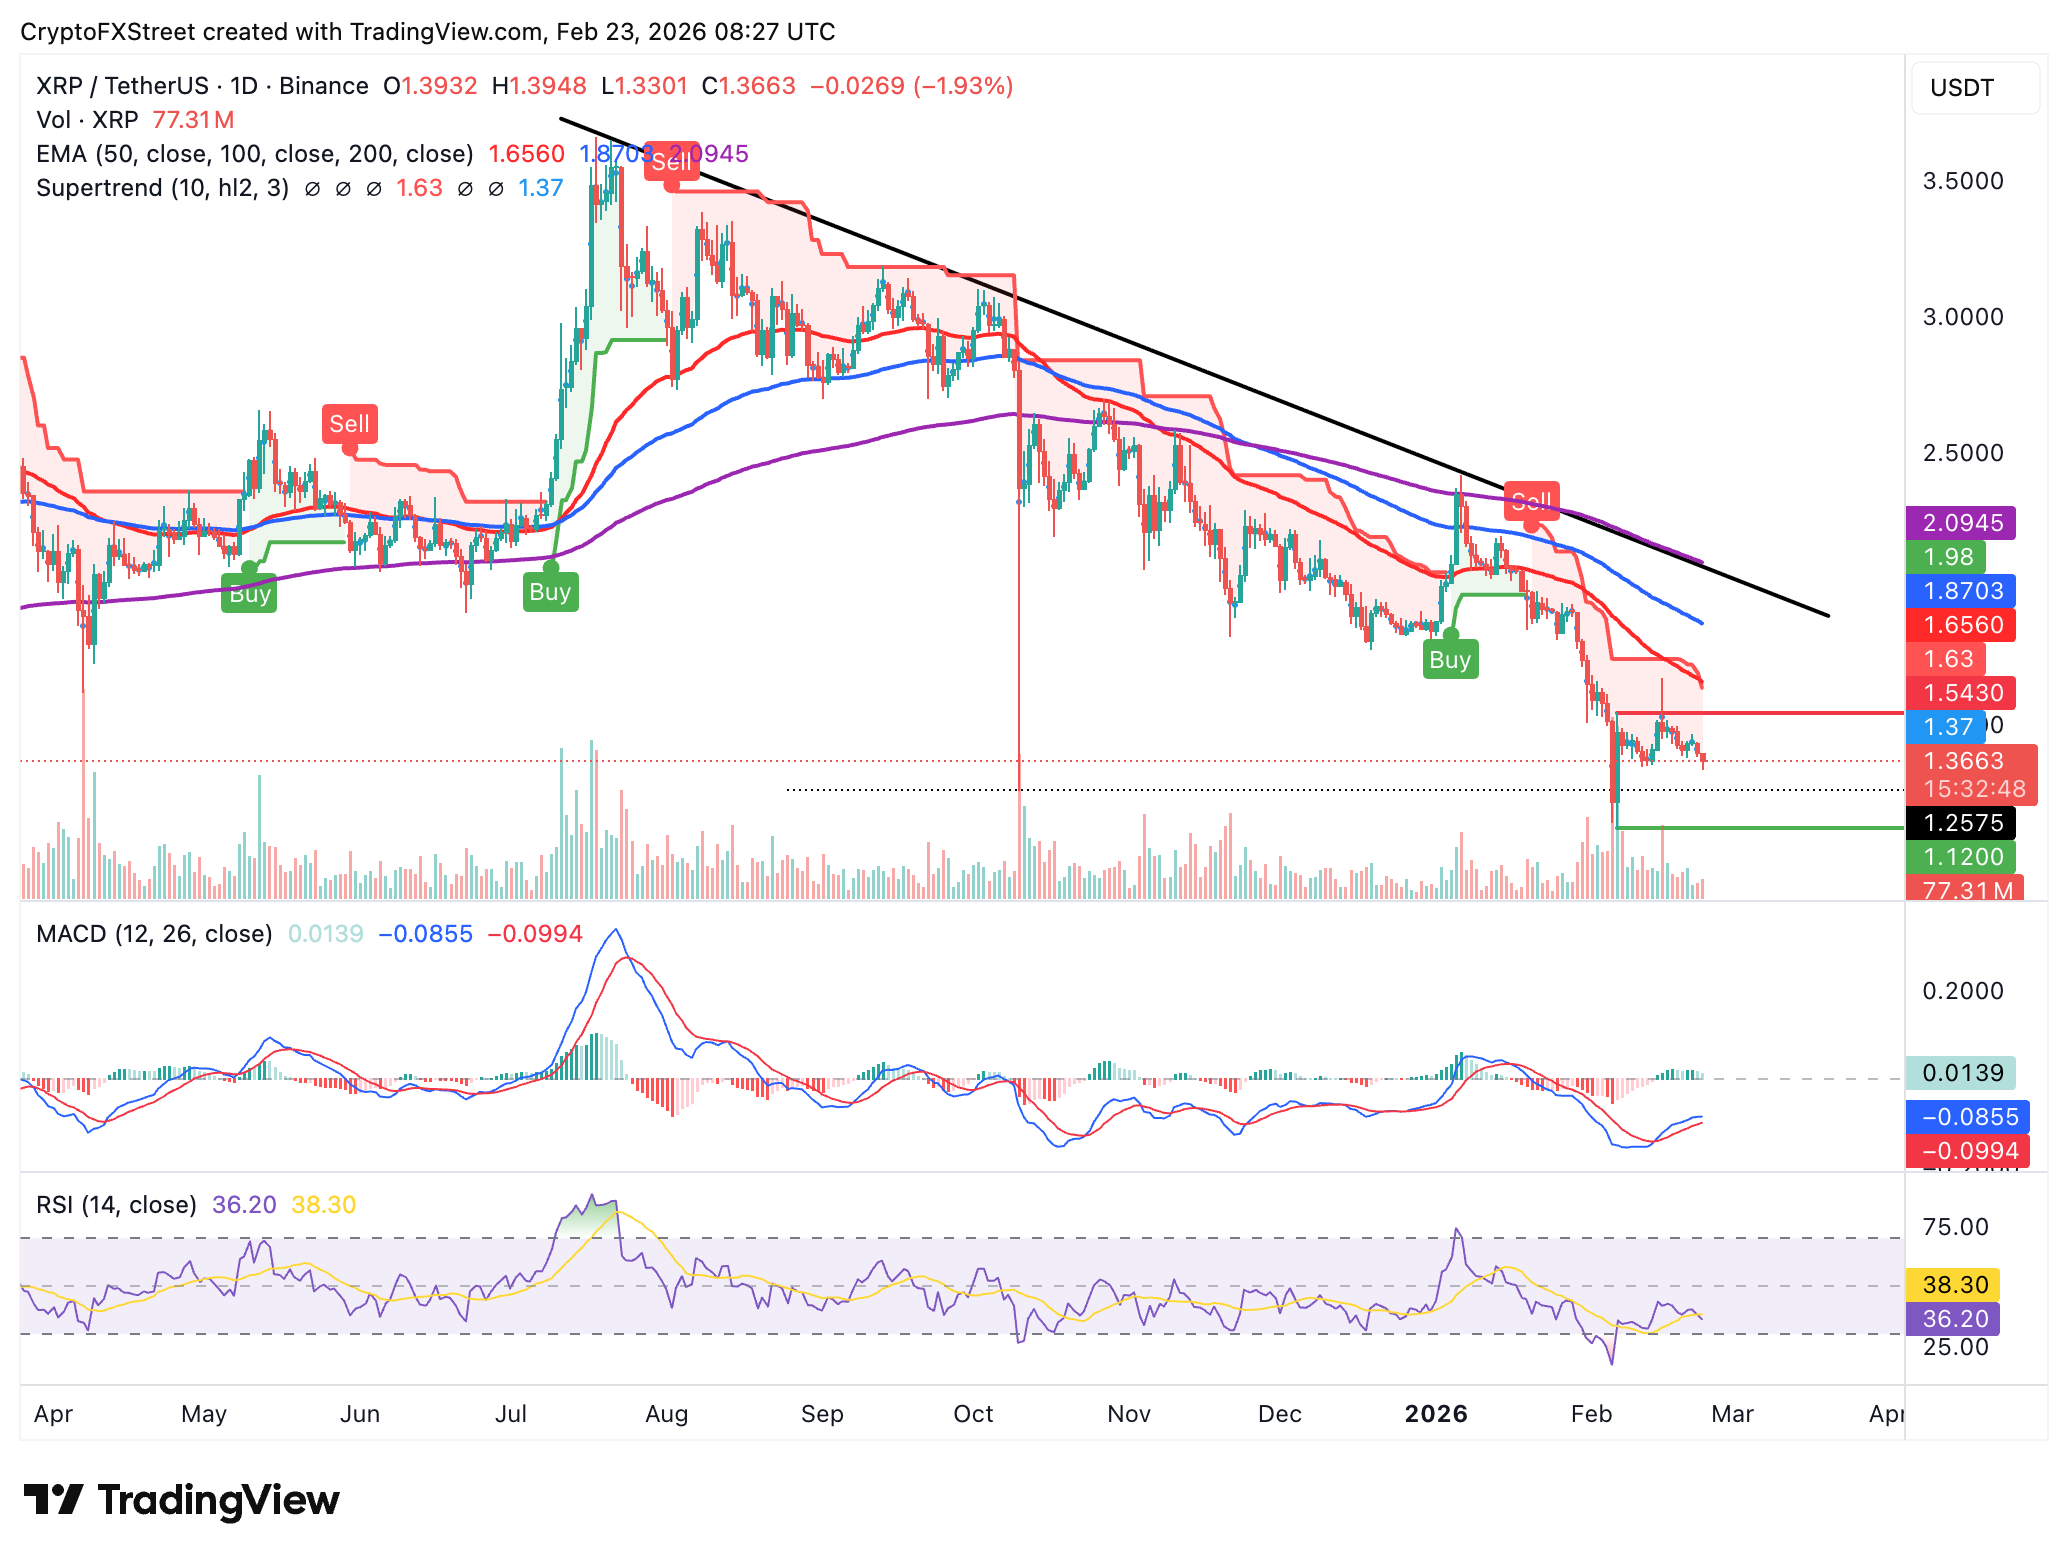
Despite the path of least resistance remaining downward, the MACD indicator holds above the signal line, building optimism for a potential rebound if investors increase their exposure. A reversal above resistance at $1.40 may open the door for an extended breakout past the 50-day EMA at $1.66.
Open Interest, funding rate FAQs
Higher Open Interest is associated with higher liquidity and new capital inflow to the market. This is considered the equivalent of increase in efficiency and the ongoing trend continues. When Open Interest decreases, it is considered a sign of liquidation in the market, investors are leaving and the overall demand for an asset is on a decline, fueling a bearish sentiment among investors.
Funding fees bridge the difference between spot prices and prices of futures contracts of an asset by increasing liquidation risks faced by traders. A consistently high and positive funding rate implies there is a bullish sentiment among market participants and there is an expectation of a price hike. A consistently negative funding rate for an asset implies a bearish sentiment, indicating that traders expect the cryptocurrency’s price to fall and a bearish trend reversal is likely to occur.

Lebih sejuta pengguna bergantung pada FXStreet untuk data pasaran masa nyata, alat carta, pandangan pakar dan berita Forex. Kalendar ekonomi yang komprehensif dan webinar pendidikan mereka membantu pedagang kekal bermaklumat dan membuat keputusan yang dikira. FXStreet disokong oleh pasukan kira-kira 60 profesional di ibu pejabat Barcelona dan pelbagai wilayah global.
Baca Lagi


