
Crypto Today: Bitcoin, Ethereum, XRP rally pauses amid broadly cooling demand
Oleh John Isige
Dikemas kini: 7 May 2026


ARTIKEL POPULAR

Cryptocurrency prices are showing broad weakness on Thursday, following a widespread rally this week that saw Bitcoin (BTC) rise to $82,850 for the first time in three months. The Crypto King is now trading above $81,000, with its upside seemingly capped as retail and institutional demand cools.
- Bitcoin struggles to gain momentum above $81,000, with both retail and institutional demand showing clear signs of exhaustion.
- Ethereum continues its downward correction for the second straight day, pressured by waning inflows into US-listed spot ETFs.
- XRP tests support at the 50-day EMA, with bearish pressure intensifying even as capital continues to flow in via derivatives and ETFs.
Cryptocurrency prices are showing broad weakness on Thursday, following a widespread rally this week that saw Bitcoin (BTC) rise to $82,850 for the first time in three months. The Crypto King is now trading above $81,000, with its upside seemingly capped as retail and institutional demand cools.
Altcoins, including Ethereum (ETH) and Ripple (XRP), are exhibiting weakness similar to Bitcoin's, suggesting their rebound could take a breather before gathering momentum. Ethereum holds above $2,300 after its brief stint above the pivotal $2,400 barrier, while XRP holds above the immediate $1.40 support level.
Crypto majors struggle for momentum as demand fades
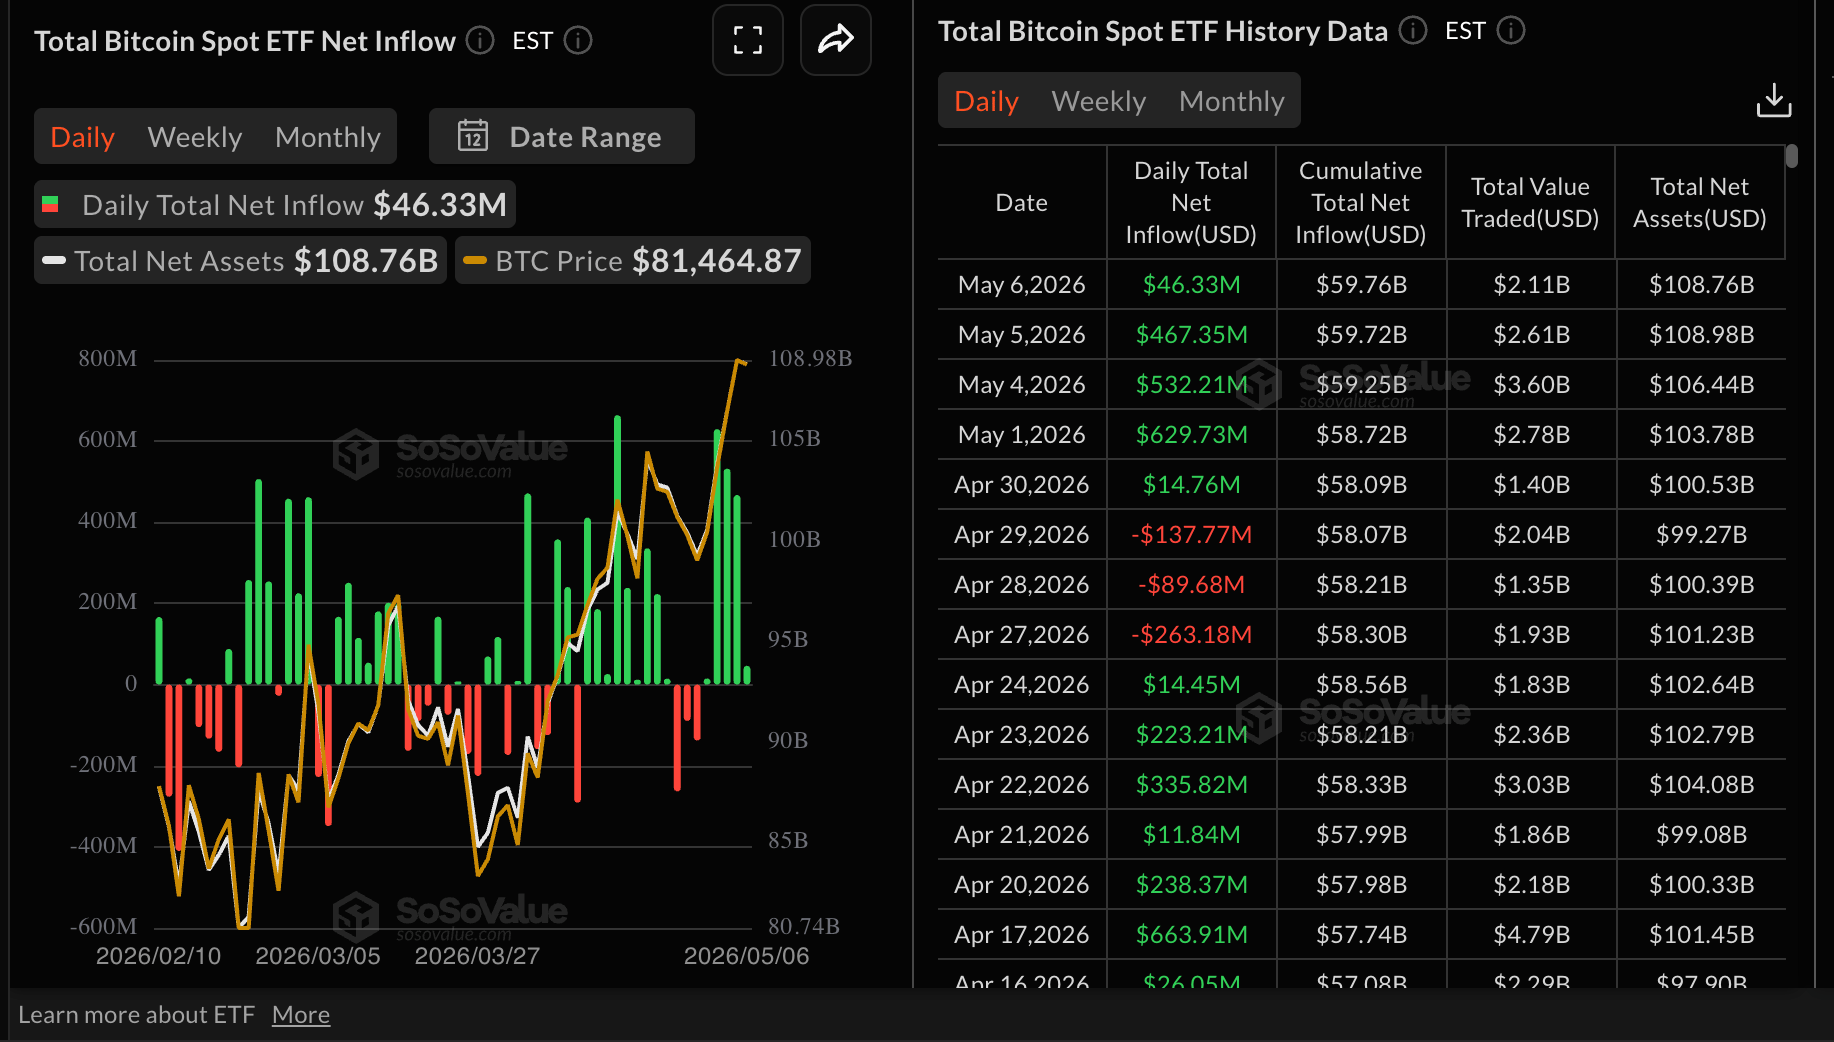
Bitcoin’s rally to $82,850 was partially driven by investors increasing their risk exposure through US-listed spot Exchange-Traded Funds (ETFs) and derivatives. BTC ETFs reflected this appetite with inflows totaling $630 million on Friday, $532 million on Monday and $467 million on Tuesday.
However, interest appears to be fading, with inflows plummeting to a mere $46 million on Wednesday. Cumulative inflows now stand at $59.76 billion, and net assets under management at $108.76 billion. A further decline in institutional interest may weigh on Bitcoin and continue to cap gains.
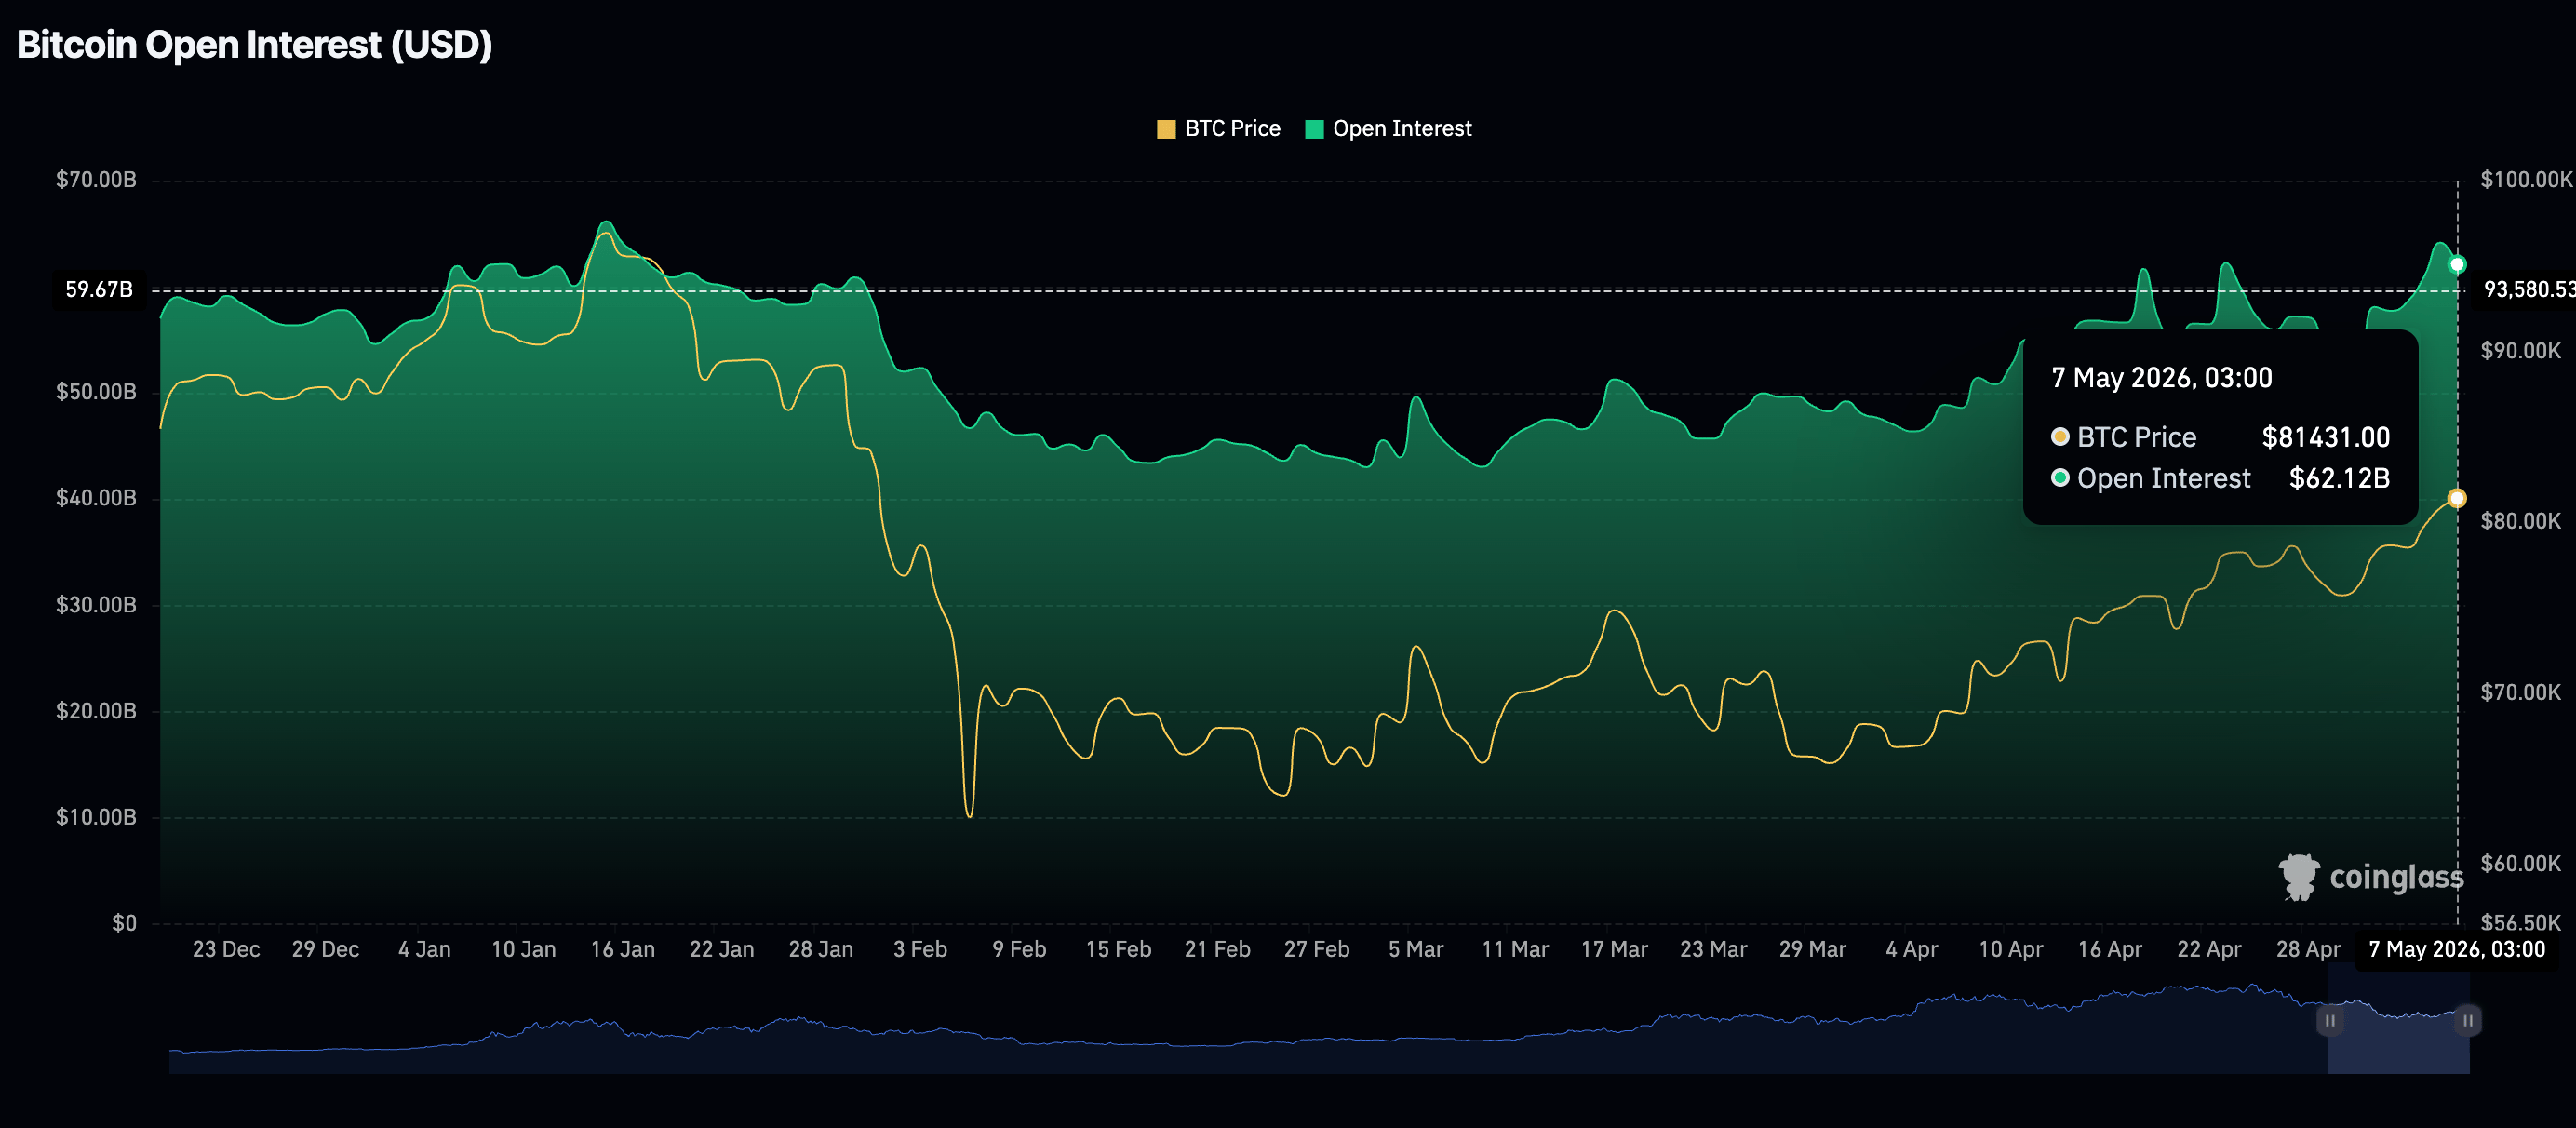
Bitcoin derivatives have also experienced a mild decline in interest, as perpetual futures Open Interest (OI) narrowed to $62.12 billion on Thursday, from $64.17 billion the day before.
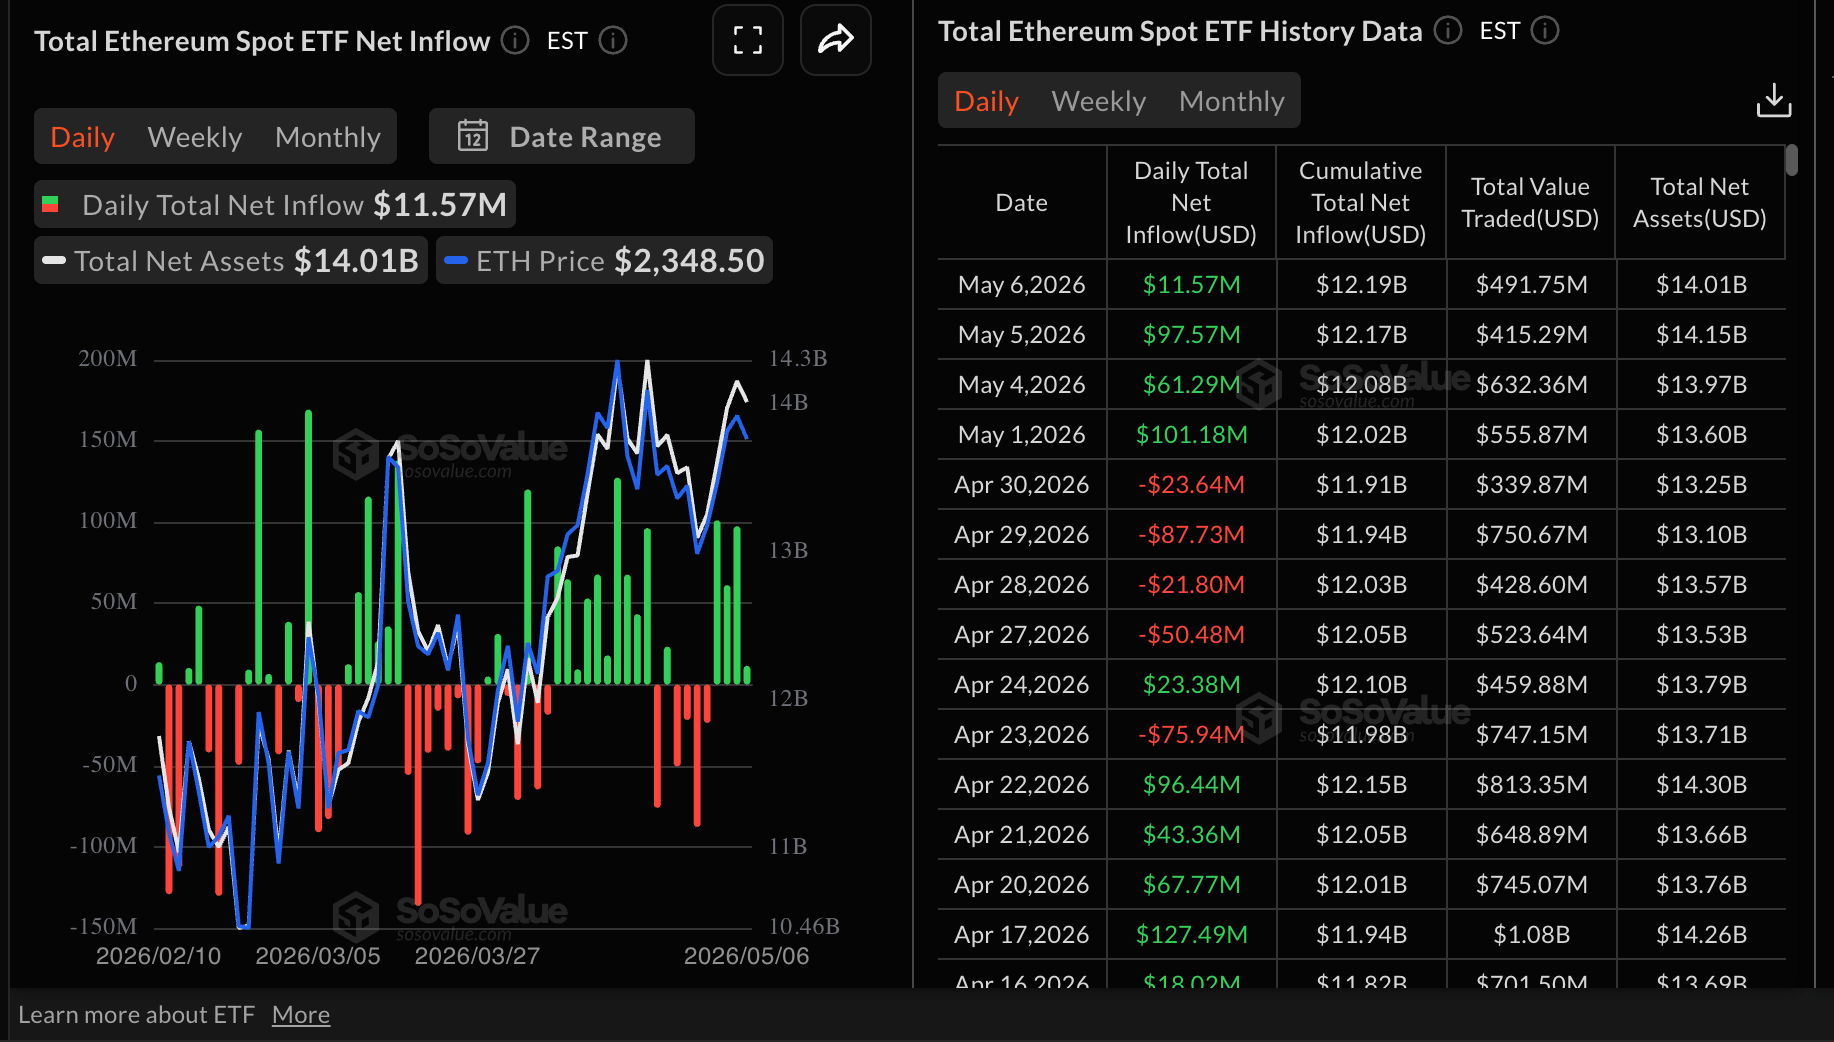
Ethereum spot ETFs recorded low inflows on Wednesday, totaling $12 million, after attracting approximately $ 101 million on Friday, $61 million on Monday, and nearly $98 million on Tuesday. Cumulative inflows average $12.19 billion, with net assets under management at $14.01 billion.
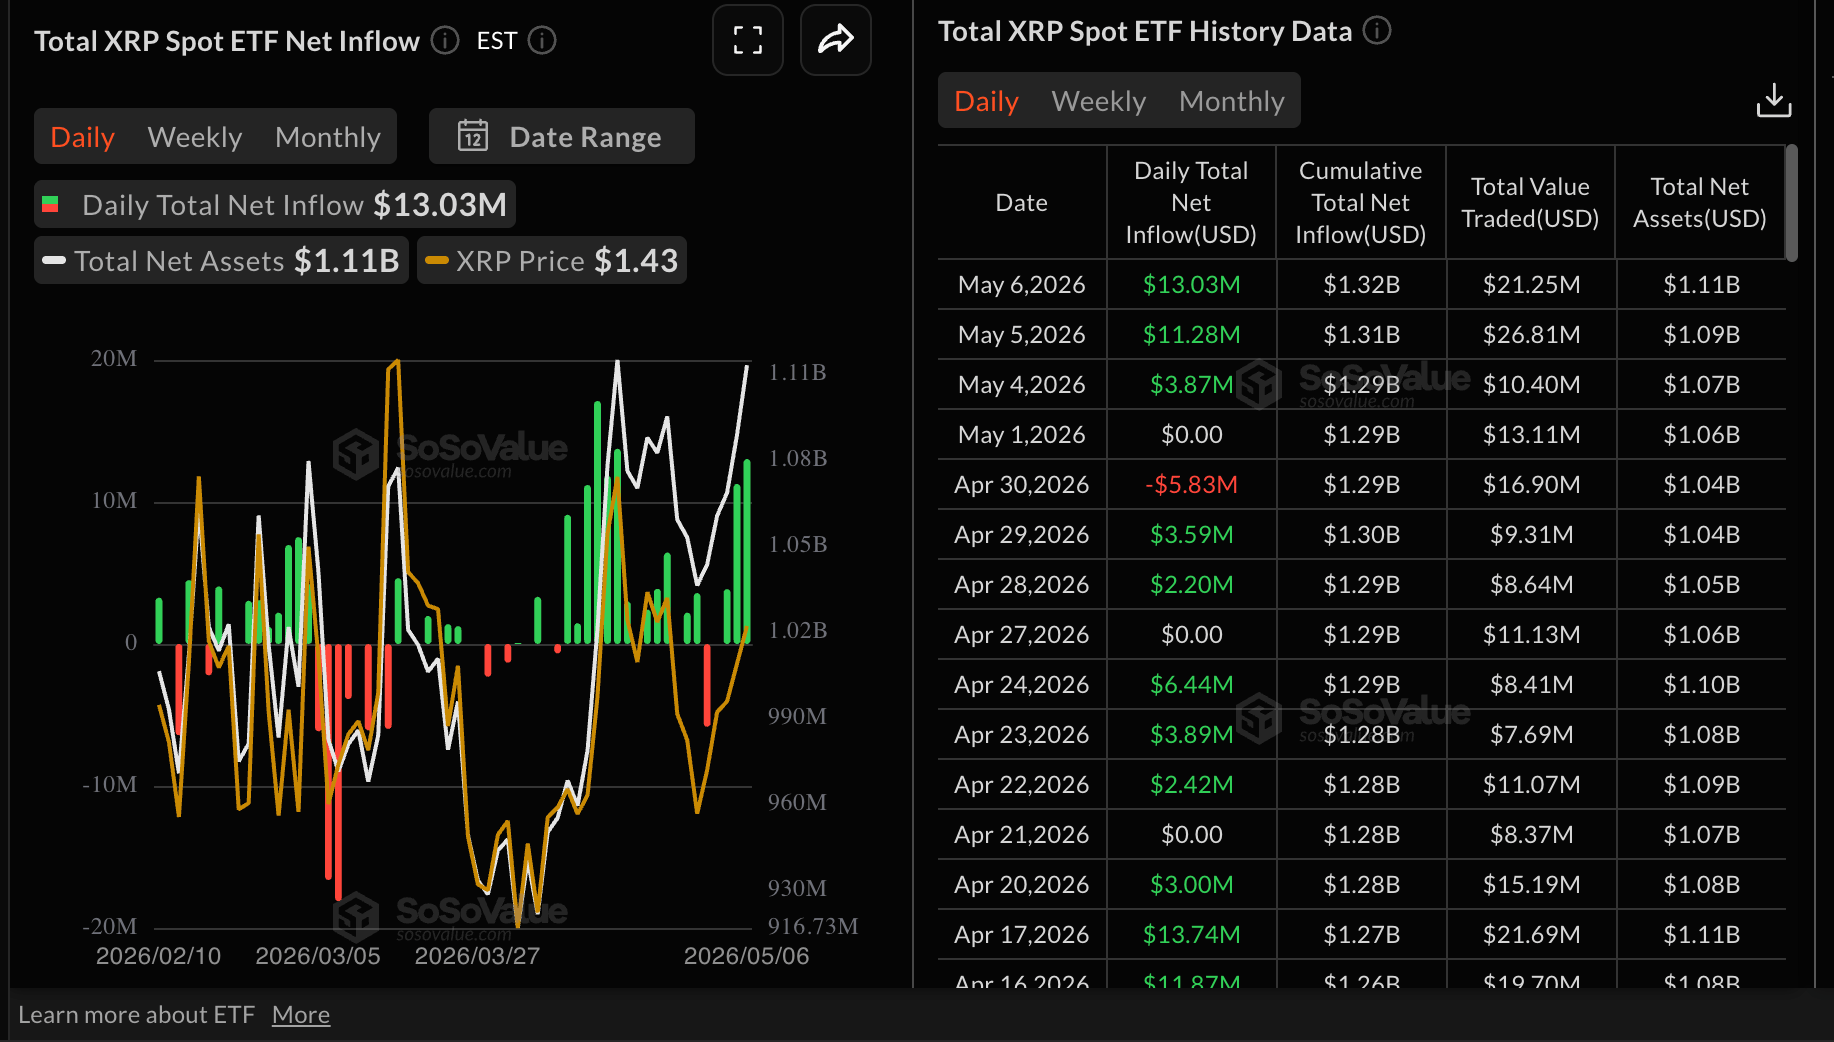
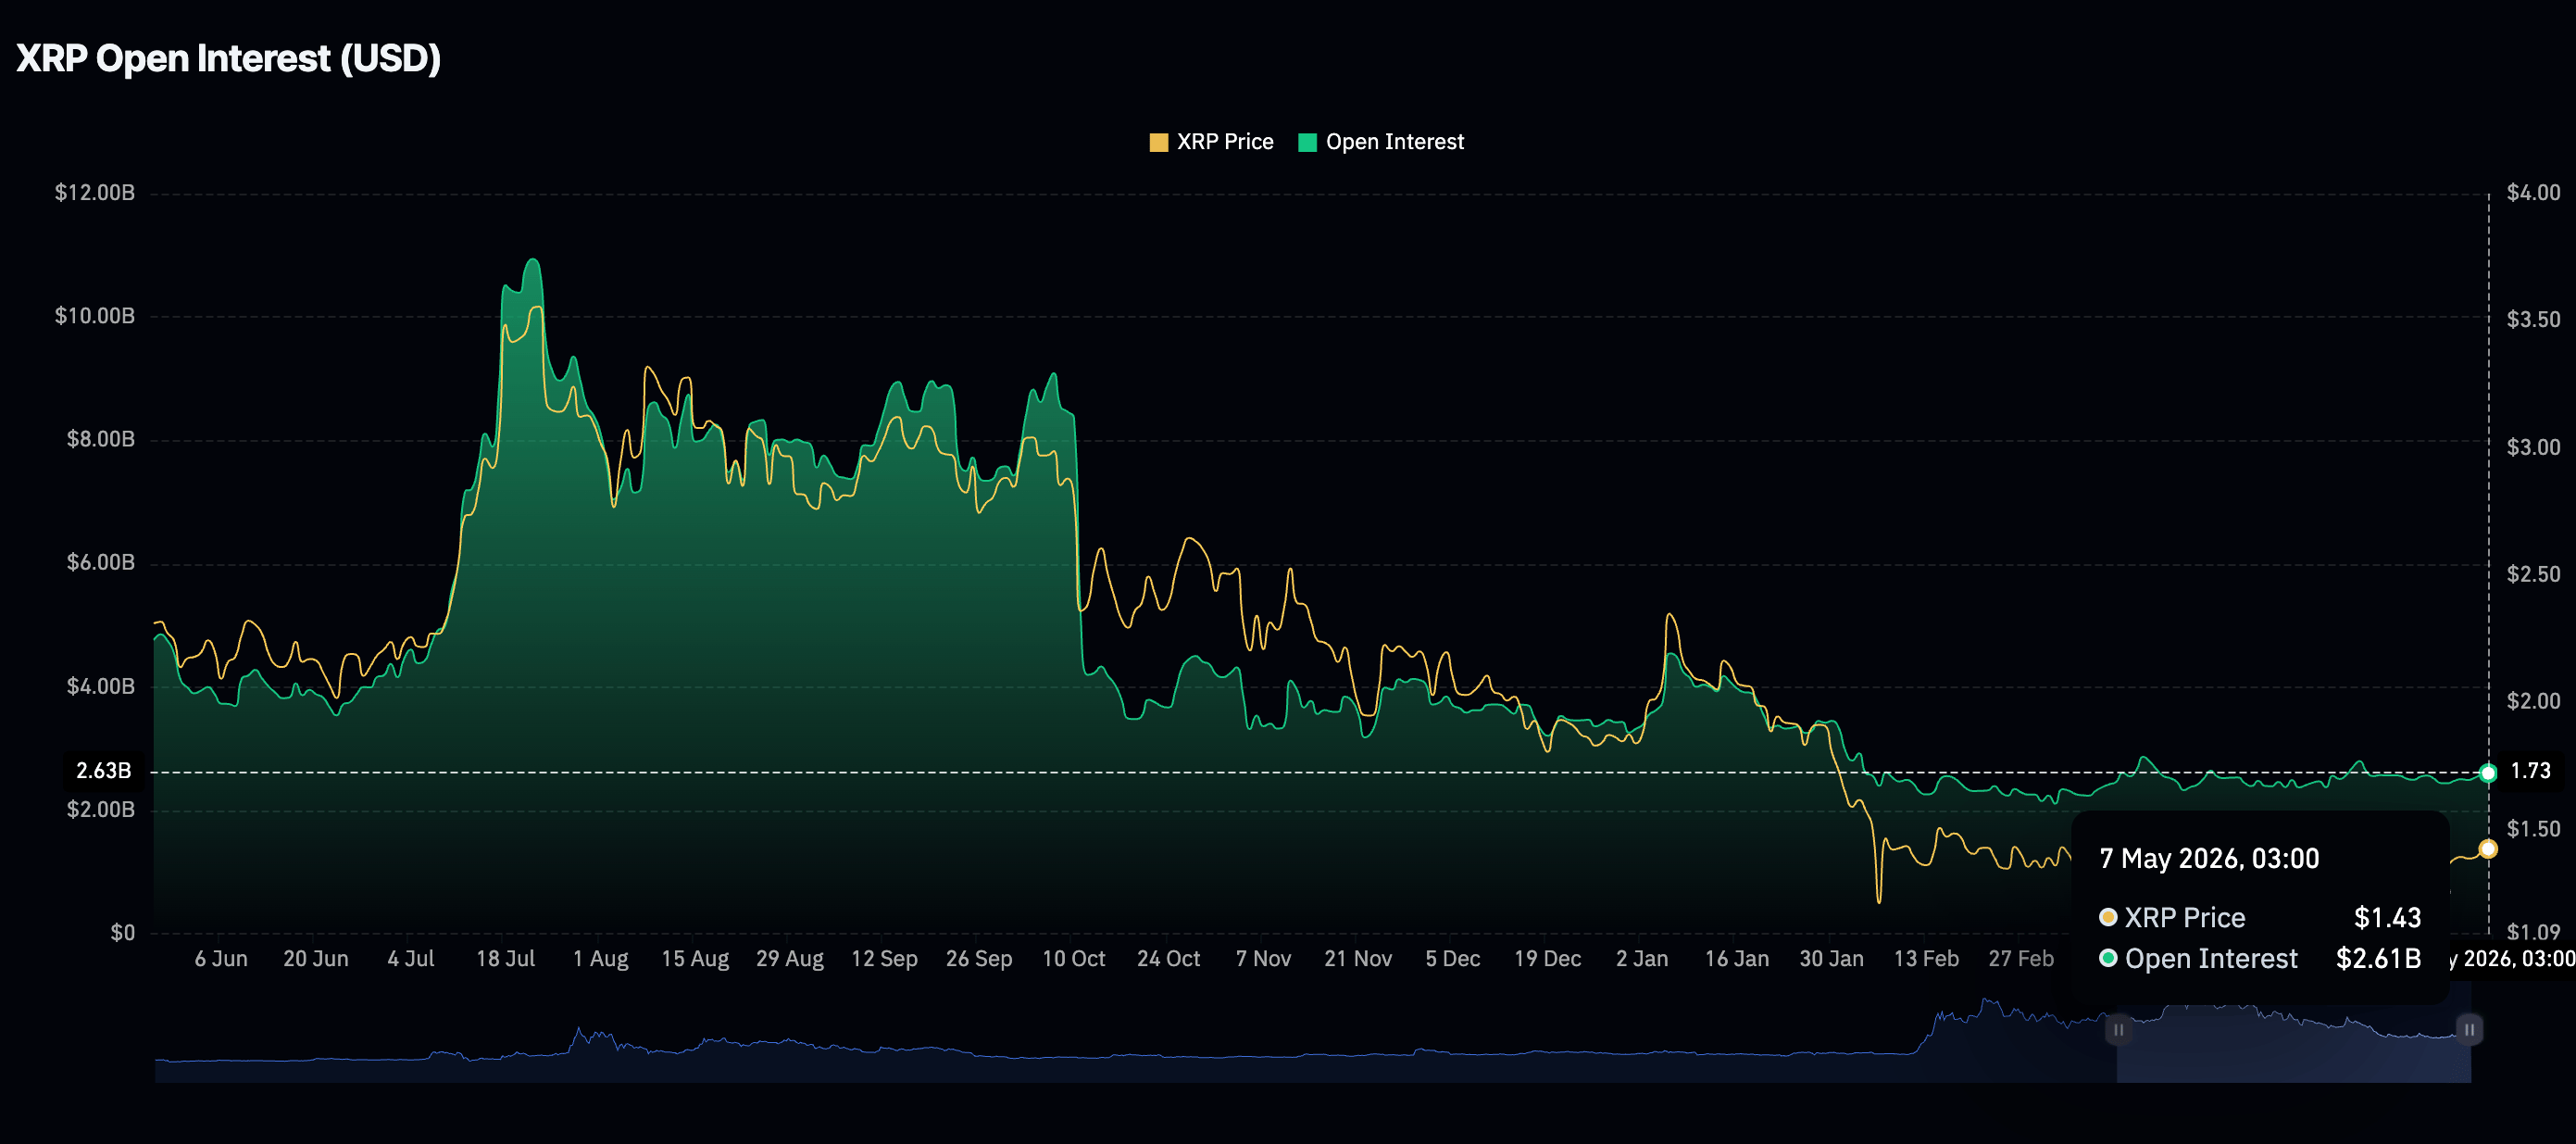
XRP spot ETFs, on the other hand, continue to see increasing inflows this week, totaling $3.87 million on Monday, $11.28 million on Tuesday and $13.03 million on Wednesday. Cumulative inflows average $1.32 billion, with net assets under management at $1.11 billion.
Retail participation in XRP derivatives is steadily strengthening, evidenced by a climb in futures Open Interest to $2.61 billion on Thursday, up from $2.59 billion the day before.
Technical outlook: Bitcoin retreats as sellers tighten grip
Bitcoin trades at $81,346, retaining a bullish near-term bias as price holds well above the 50-day and 100-day Exponential Moving Averages (EMAs) clustered around $75,206–$76,200 while still capped beneath the 200-day EMA at roughly $82,153.
The Moving Average Convergence Divergence (MACD) histogram remains in positive territory on the daily chart, and the Relative Strength Index (RSI) hovers just below the overbought band at 69, suggesting firm upside momentum, although the elevated reading hints that further gains could become increasingly labored as price approaches overhead supply.
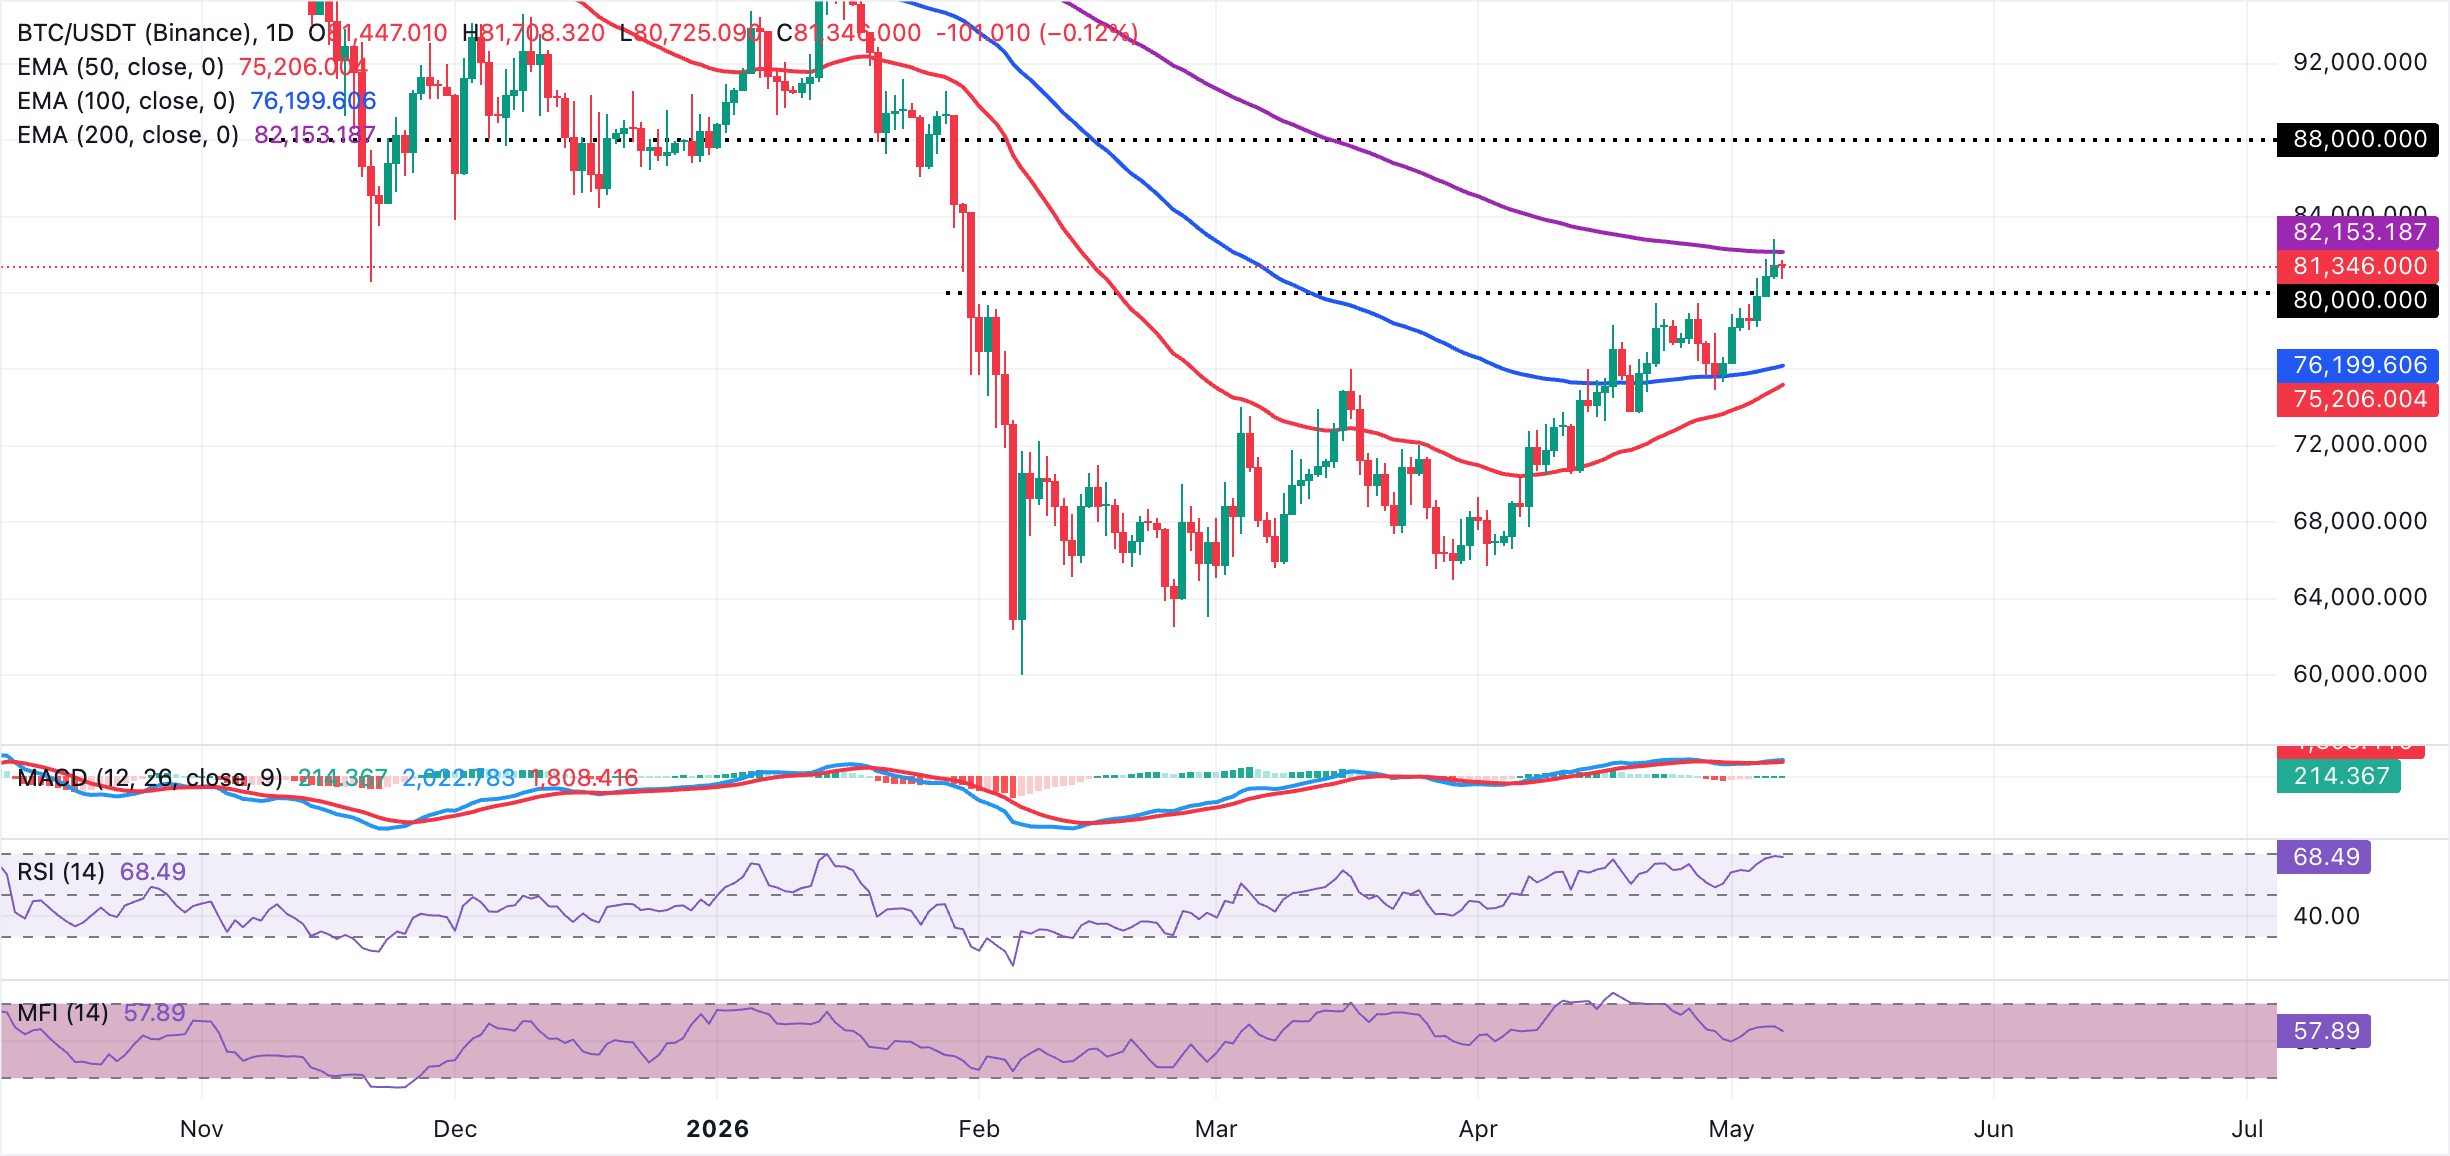
On the topside, immediate resistance is reinforced by the 200-day EMA at $82,153. A decisive daily close above this level would open the door to a continuation of the broader advance. On the downside, initial support is seen at the 100-day EMA near $76,200, with the 50-day EMA at $75,206 providing an additional bullish layer below. As long as bulls defend this EMA band on pullbacks, dips are likely to be treated as corrective within the prevailing uptrend.
Altcoins technical outlook: Ethereum and XRP pressured as further decline lingers
Ethereum trades at $2,338, holding a neutral-to-slightly-bullish stance as price consolidates above the 50-day EMA at $2,266 but remains capped beneath the 100-day EMA at $2,344 and the 200-day EMA near $2,546.
The smart contract is also tracking an upward support trend line, with the latest reaction area around $2,288, suggesting buyers are still defending higher lows even as the MACD histogram stays marginally negative on the daily chart and hints at waning upside momentum, while the RSI around 55 points to balanced, mildly positive pressure rather than a strong trend.
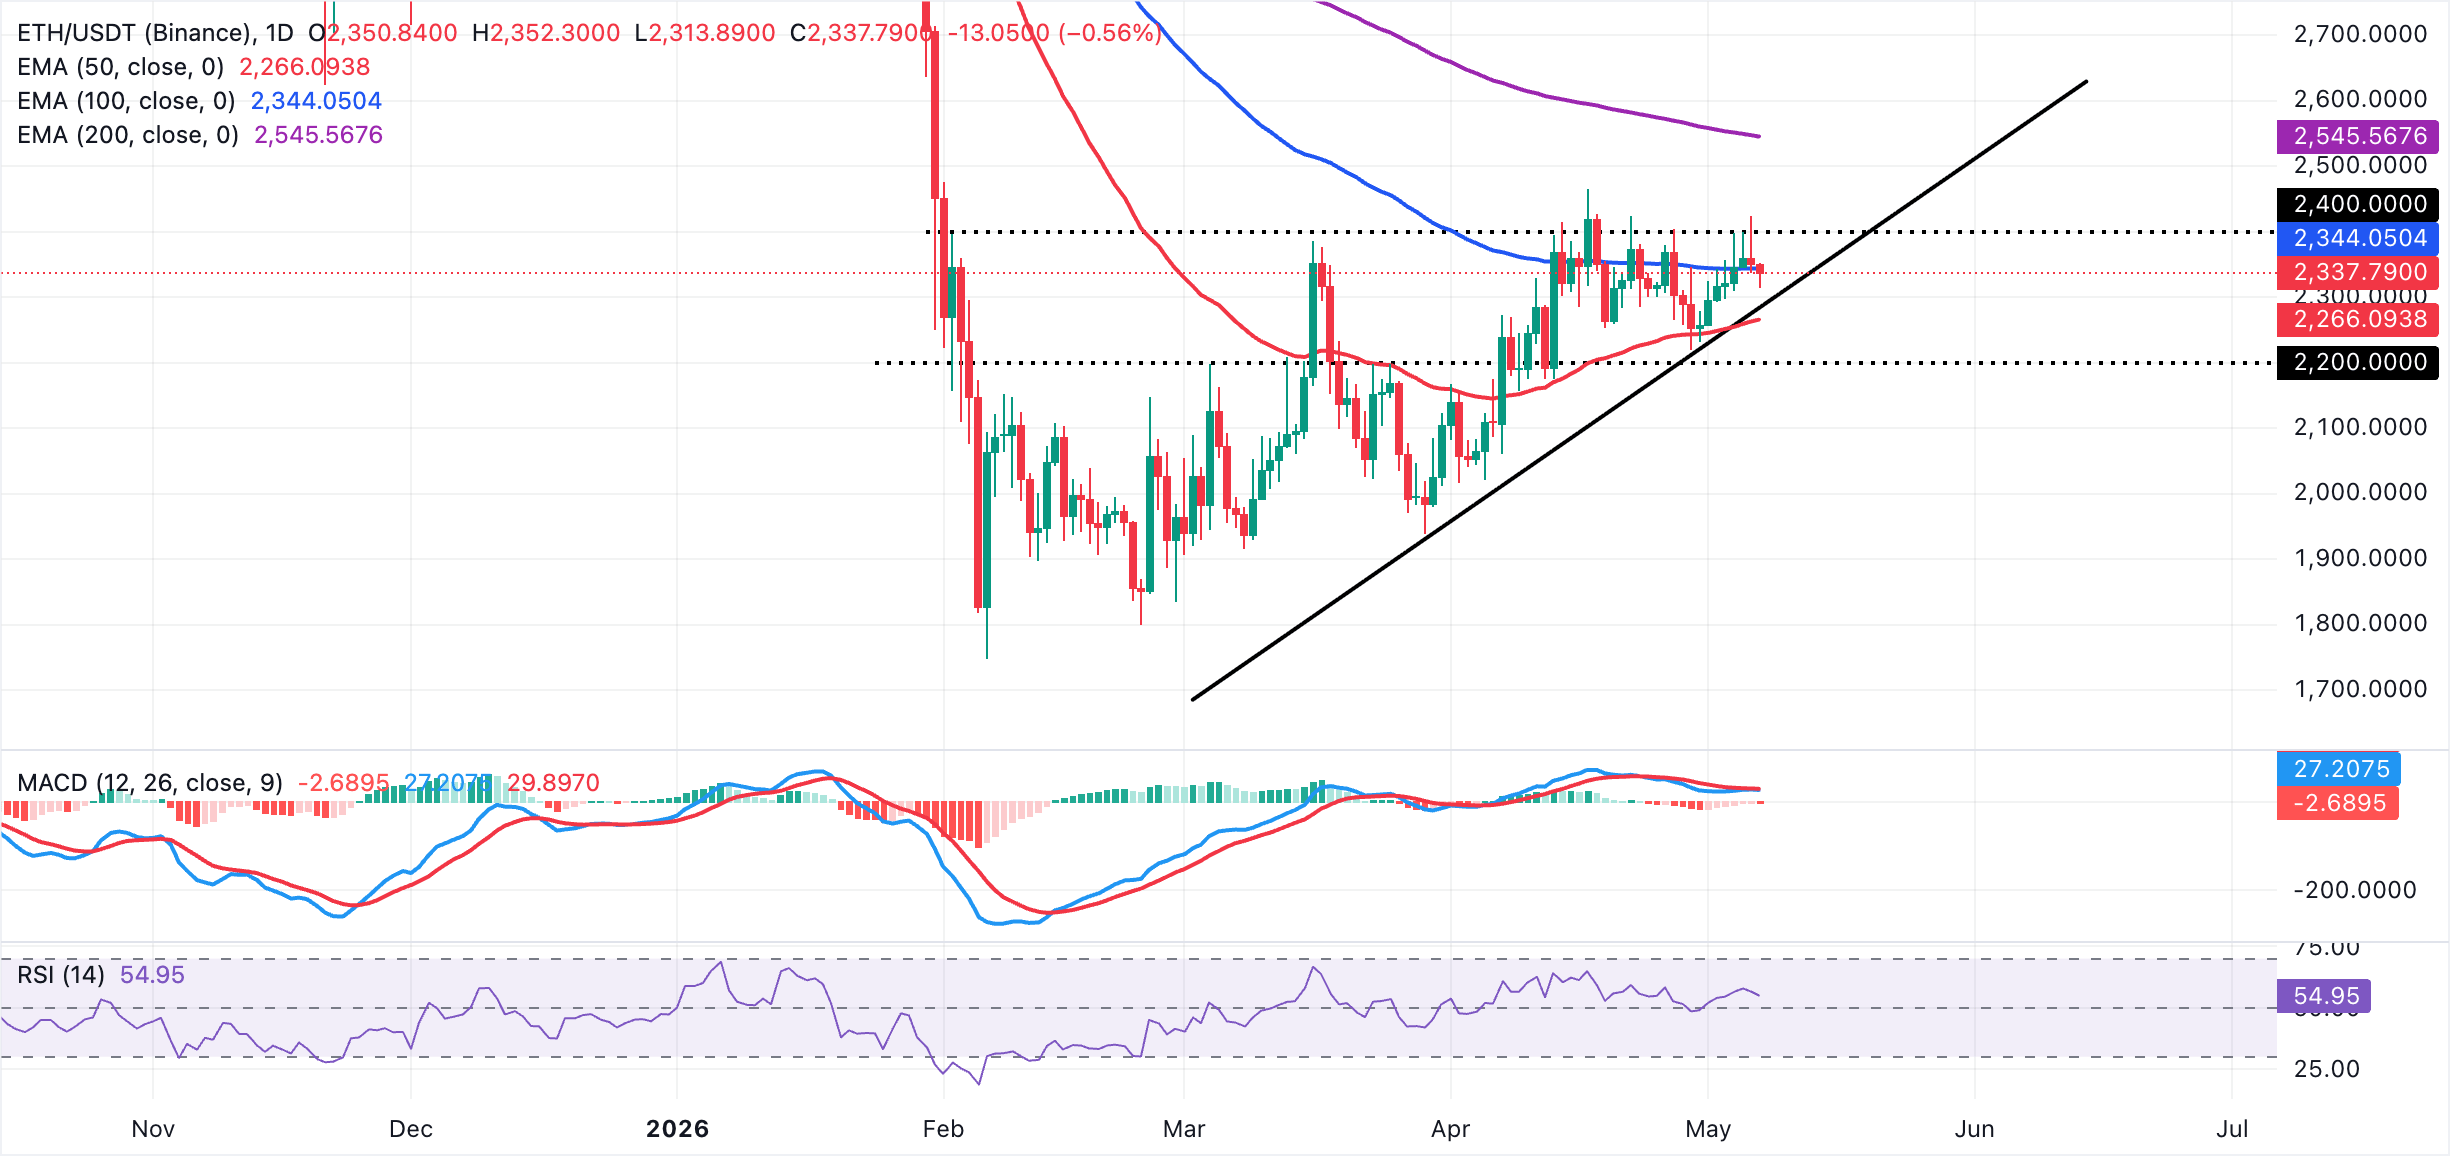
On the topside, immediate resistance lies at the 100-day EMA, roughly $2,344. A daily close above this pivot would expose the more substantial barrier at the 200-day EMA near $2,546, where the broader bearish supply zone is likely to reassert itself.
On the downside, initial support aligns with the nearby intraday pivot around the current price zone, followed by the rising trendline support at about $2,288, with the 50-day EMA at $2,266 providing a deeper floor. A decisive break below this clustered area would weaken the constructive bias and open the door to a more pronounced corrective phase.
XRP, on the other hand, trades at above $1.41, retaining a broadly bearish bias as price holds well below the 100-day and 200-day EMAs at $1.50 and $1.74, respectively. The remittance, however, remains slightly supported above the 50-day EMA at $1.41, hinting at a tentative attempt to stabilize after recent losses.
Momentum signals are mildly constructive, with the RSI hovering around 54 on the daily chart and the MACD histogram fractionally above the zero line, suggesting downside pressure is easing but not yet reversed, while major longer-term averages remain overhead.
On the topside, initial resistance is seen at the downward-sloping trendline break area near $1.46, where prior rallies have struggled, followed by the 100-day EMA at $1.50. A sustained move above these would be needed to ease the broader bearish tone. Further north, the 200-day EMA at $1.74 stands as a major medium-term barrier.
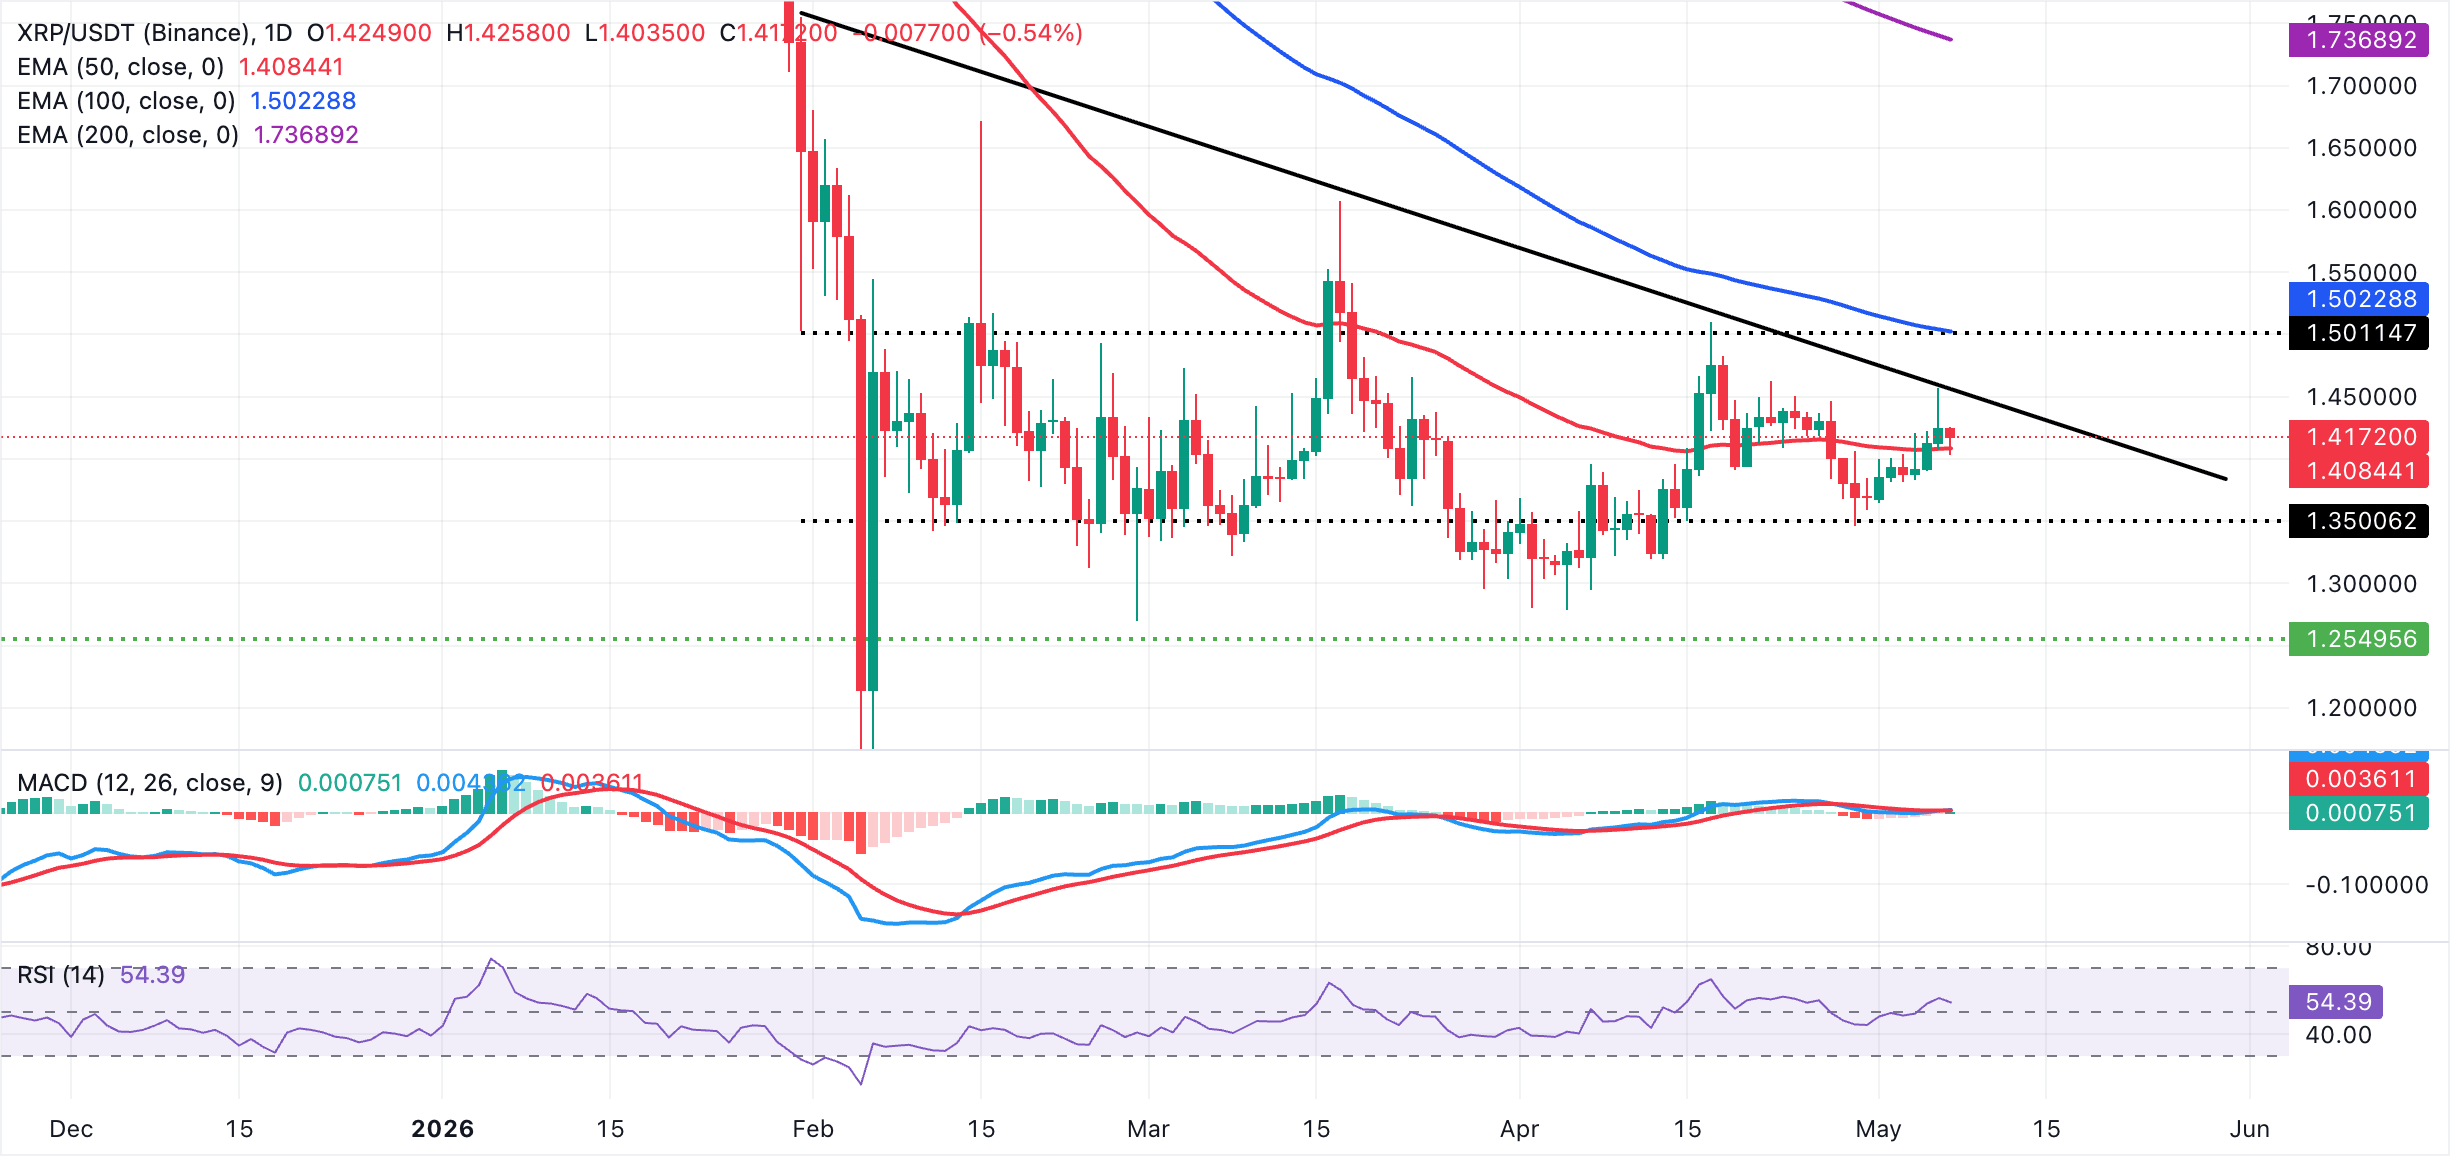
On the downside, immediate support is provided by the 50-day EMA at $1.41. A daily close below this level would reopen the path toward deeper retracements, while holding above it would keep short-term consolidation in play beneath the dominant overhead resistance zone.
(The technical analysis of this story was written with the help of an AI tool.)
Crypto ETF FAQs
An Exchange-Traded Fund (ETF) is an investment vehicle or an index that tracks the price of an underlying asset. ETFs can not only track a single asset, but a group of assets and sectors. For example, a Bitcoin ETF tracks Bitcoin’s price. ETF is a tool used by investors to gain exposure to a certain asset.
Yes. The first Bitcoin futures ETF in the US was approved by the US Securities & Exchange Commission in October 2021. A total of seven Bitcoin futures ETFs have been approved, with more than 20 still waiting for the regulator’s permission. The SEC says that the cryptocurrency industry is new and subject to manipulation, which is why it has been delaying crypto-related futures ETFs for the last few years.
Yes. The SEC approved in January 2024 the listing and trading of several Bitcoin spot Exchange-Traded Funds, opening the door to institutional capital and mainstream investors to trade the main crypto currency. The decision was hailed by the industry as a game changer.
The main advantage of crypto ETFs is the possibility of gaining exposure to a cryptocurrency without ownership, reducing the risk and cost of holding the asset. Other pros are a lower learning curve and higher security for investors since ETFs take charge of securing the underlying asset holdings. As for the main drawbacks, the main one is that as an investor you can’t have direct ownership of the asset, or, as they say in crypto, “not your keys, not your coins.” Other disadvantages are higher costs associated with holding crypto since ETFs charge fees for active management. Finally, even though investing in ETFs reduces the risk of holding an asset, price swings in the underlying cryptocurrency are likely to be reflected in the investment vehicle too.

Lebih sejuta pengguna bergantung pada FXStreet untuk data pasaran masa nyata, alat carta, pandangan pakar dan berita Forex. Kalendar ekonomi yang komprehensif dan webinar pendidikan mereka membantu pedagang kekal bermaklumat dan membuat keputusan yang dikira. FXStreet disokong oleh pasukan kira-kira 60 profesional di ibu pejabat Barcelona dan pelbagai wilayah global.
Baca Lagi


