
Dogecoin Price Forecast: Key trendline hinders recovery despite whale, retail support
Oleh Vishal Dixit
Dikemas kini: 24 Apr 2026


ARTIKEL POPULAR

Dogecoin (DOGE) extends gains for the third consecutive day, trading above $0.095 at press time on Friday and approaching a key resistance trendline.
- Dogecoin hovers below $0.10 on Friday, capped by an overhead resistance trendline.
- On-chain data show a divergence between whale count and price, suggesting that smart investors are buying the dip.
- Dogecoin is gaining retail support in the derivatives market as investors anticipate potential upside.
Dogecoin (DOGE) extends gains for the third consecutive day, trading above $0.095 at press time on Friday and approaching a key resistance trendline. Large wallet investors, commonly referred to as whales, are growing in numbers, while a surge in DOGE futures Open Interest reflects rising retail demand.
Whales acquire DOGE amid renewed demand in derivatives markets
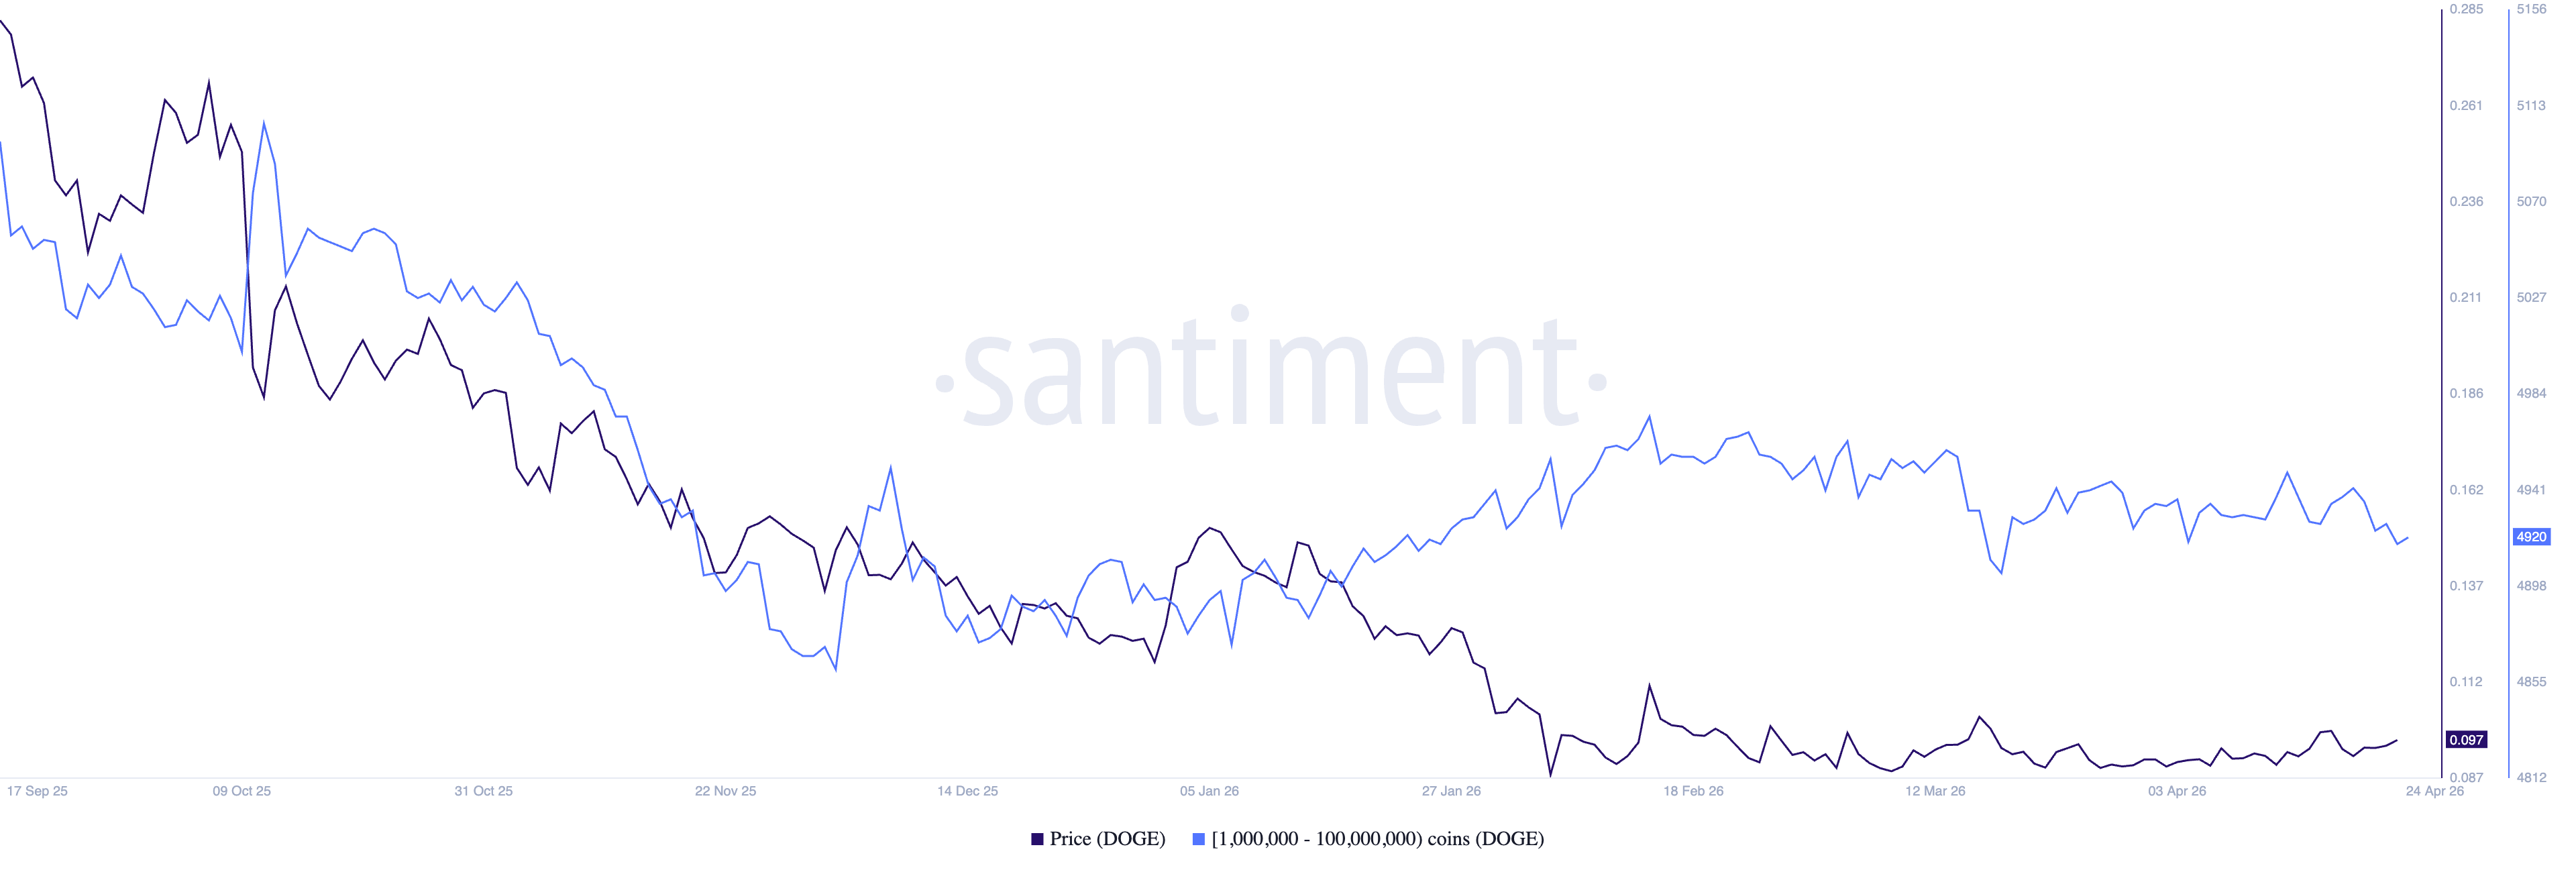
Dogecoin has plateaued after a roughly 60% decline since October, hitting a low at around $0.080 in early February, and has since traded sideways, capped by headwinds near $0.100. However, whale and retail interest in Dogecoin has held steady, anticipating a potential rebound with a key resistance trendline breakout.
Santiment data shows that 4,920 whale wallets hold between 1 million and 100 million DOGE tokens, up from 4,872 on January 7. The trend of these cohorts broadly mirrors the DOGE price, but the recent increase in the number of whale wallets highlights a divergence with the spot price, indicating that whales are growing confident to buy the dip as they anticipate potential upside.
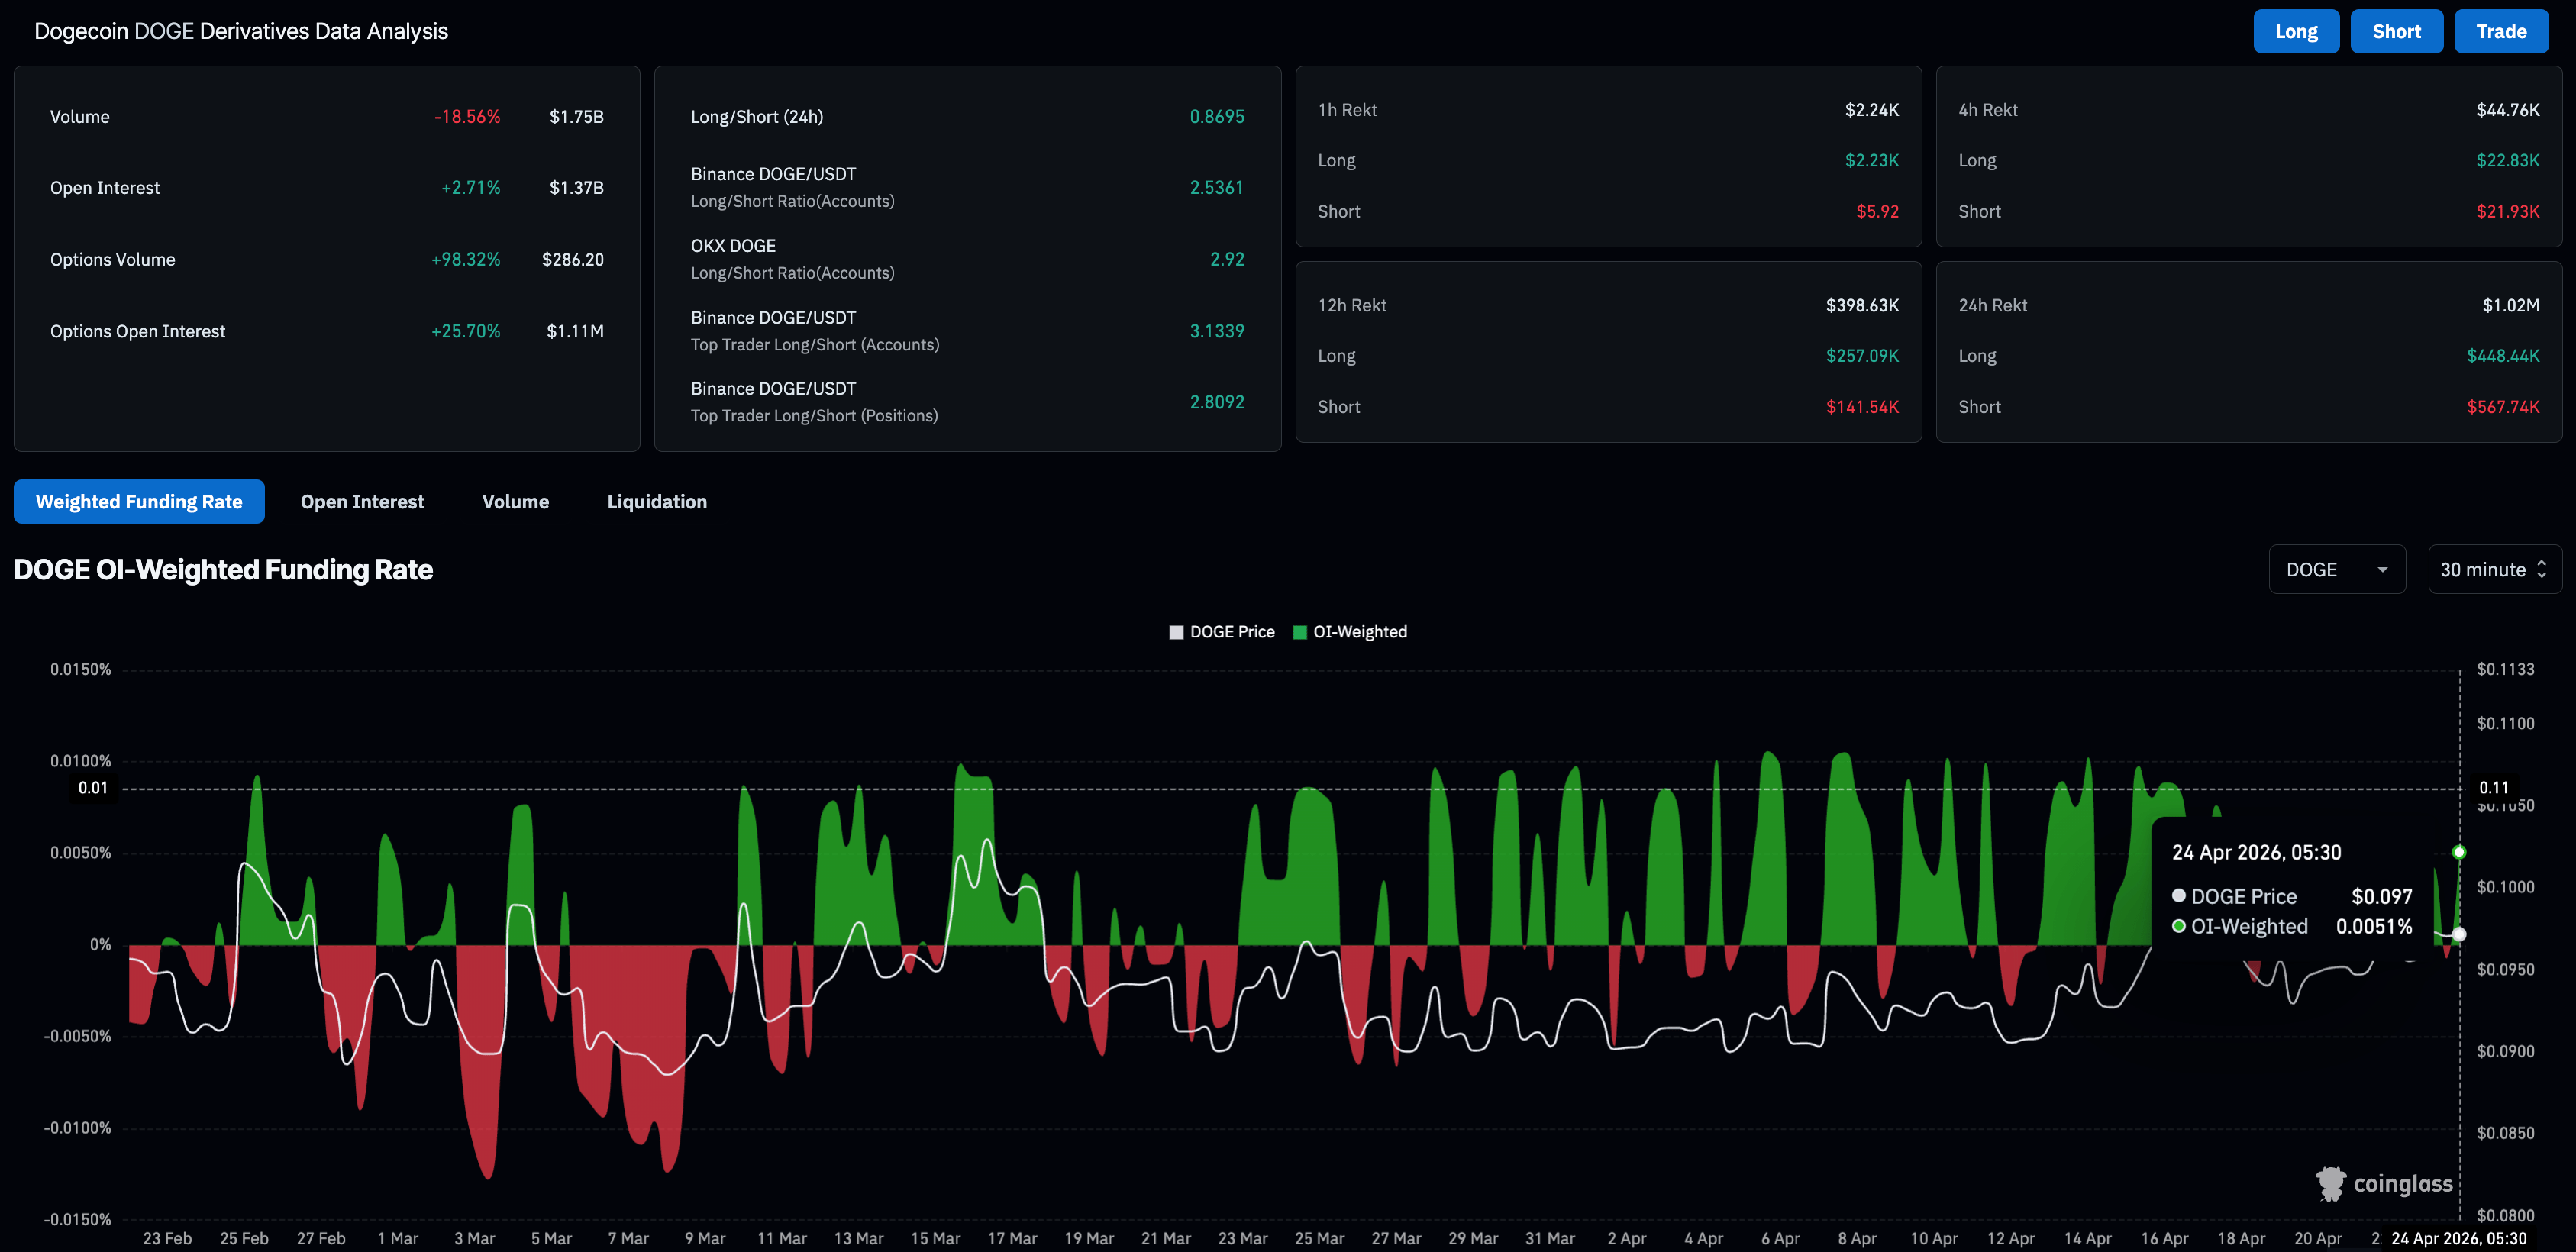
On the derivatives side, CoinGlass data shows the DOGE futures Open Interest (OI) is up roughly 3% over the last 24 hours to $1.37 billion, projecting renewed leverage-based activity. Meanwhile, the funding rate of 0.0051% suggests that buyers are willing to build long positions at a premium, paid to short positional holders.
Dogecoin nears crucial resistance amid rising momentum
Dogecoin is approaching the $0.100 psychological level, extending its rebound from the 50-day Exponential Moving Average (EMA) at $0.0958, tilting the near-term bias slightly bullish. However, DOGE remains capped by a downward resistance trendline connecting the January 6 and April 17 highs, near $0.100.
The 50-day EMA and the resistance trendline define the short-term upper boundary of the current recovery run. A break above $0.100 would expose the more distant $0.116 barrier, marked by the December 31 low, and the 200-day EMA at $0.128.
The Moving Average Convergence Divergence (MACD) holds marginally above its signal line on the daily chart, signalling that bulls retain control. Meanwhile, the Relative Strength Index (RSI) rises to 56, hinting at modest constructive momentum rather than overextension.
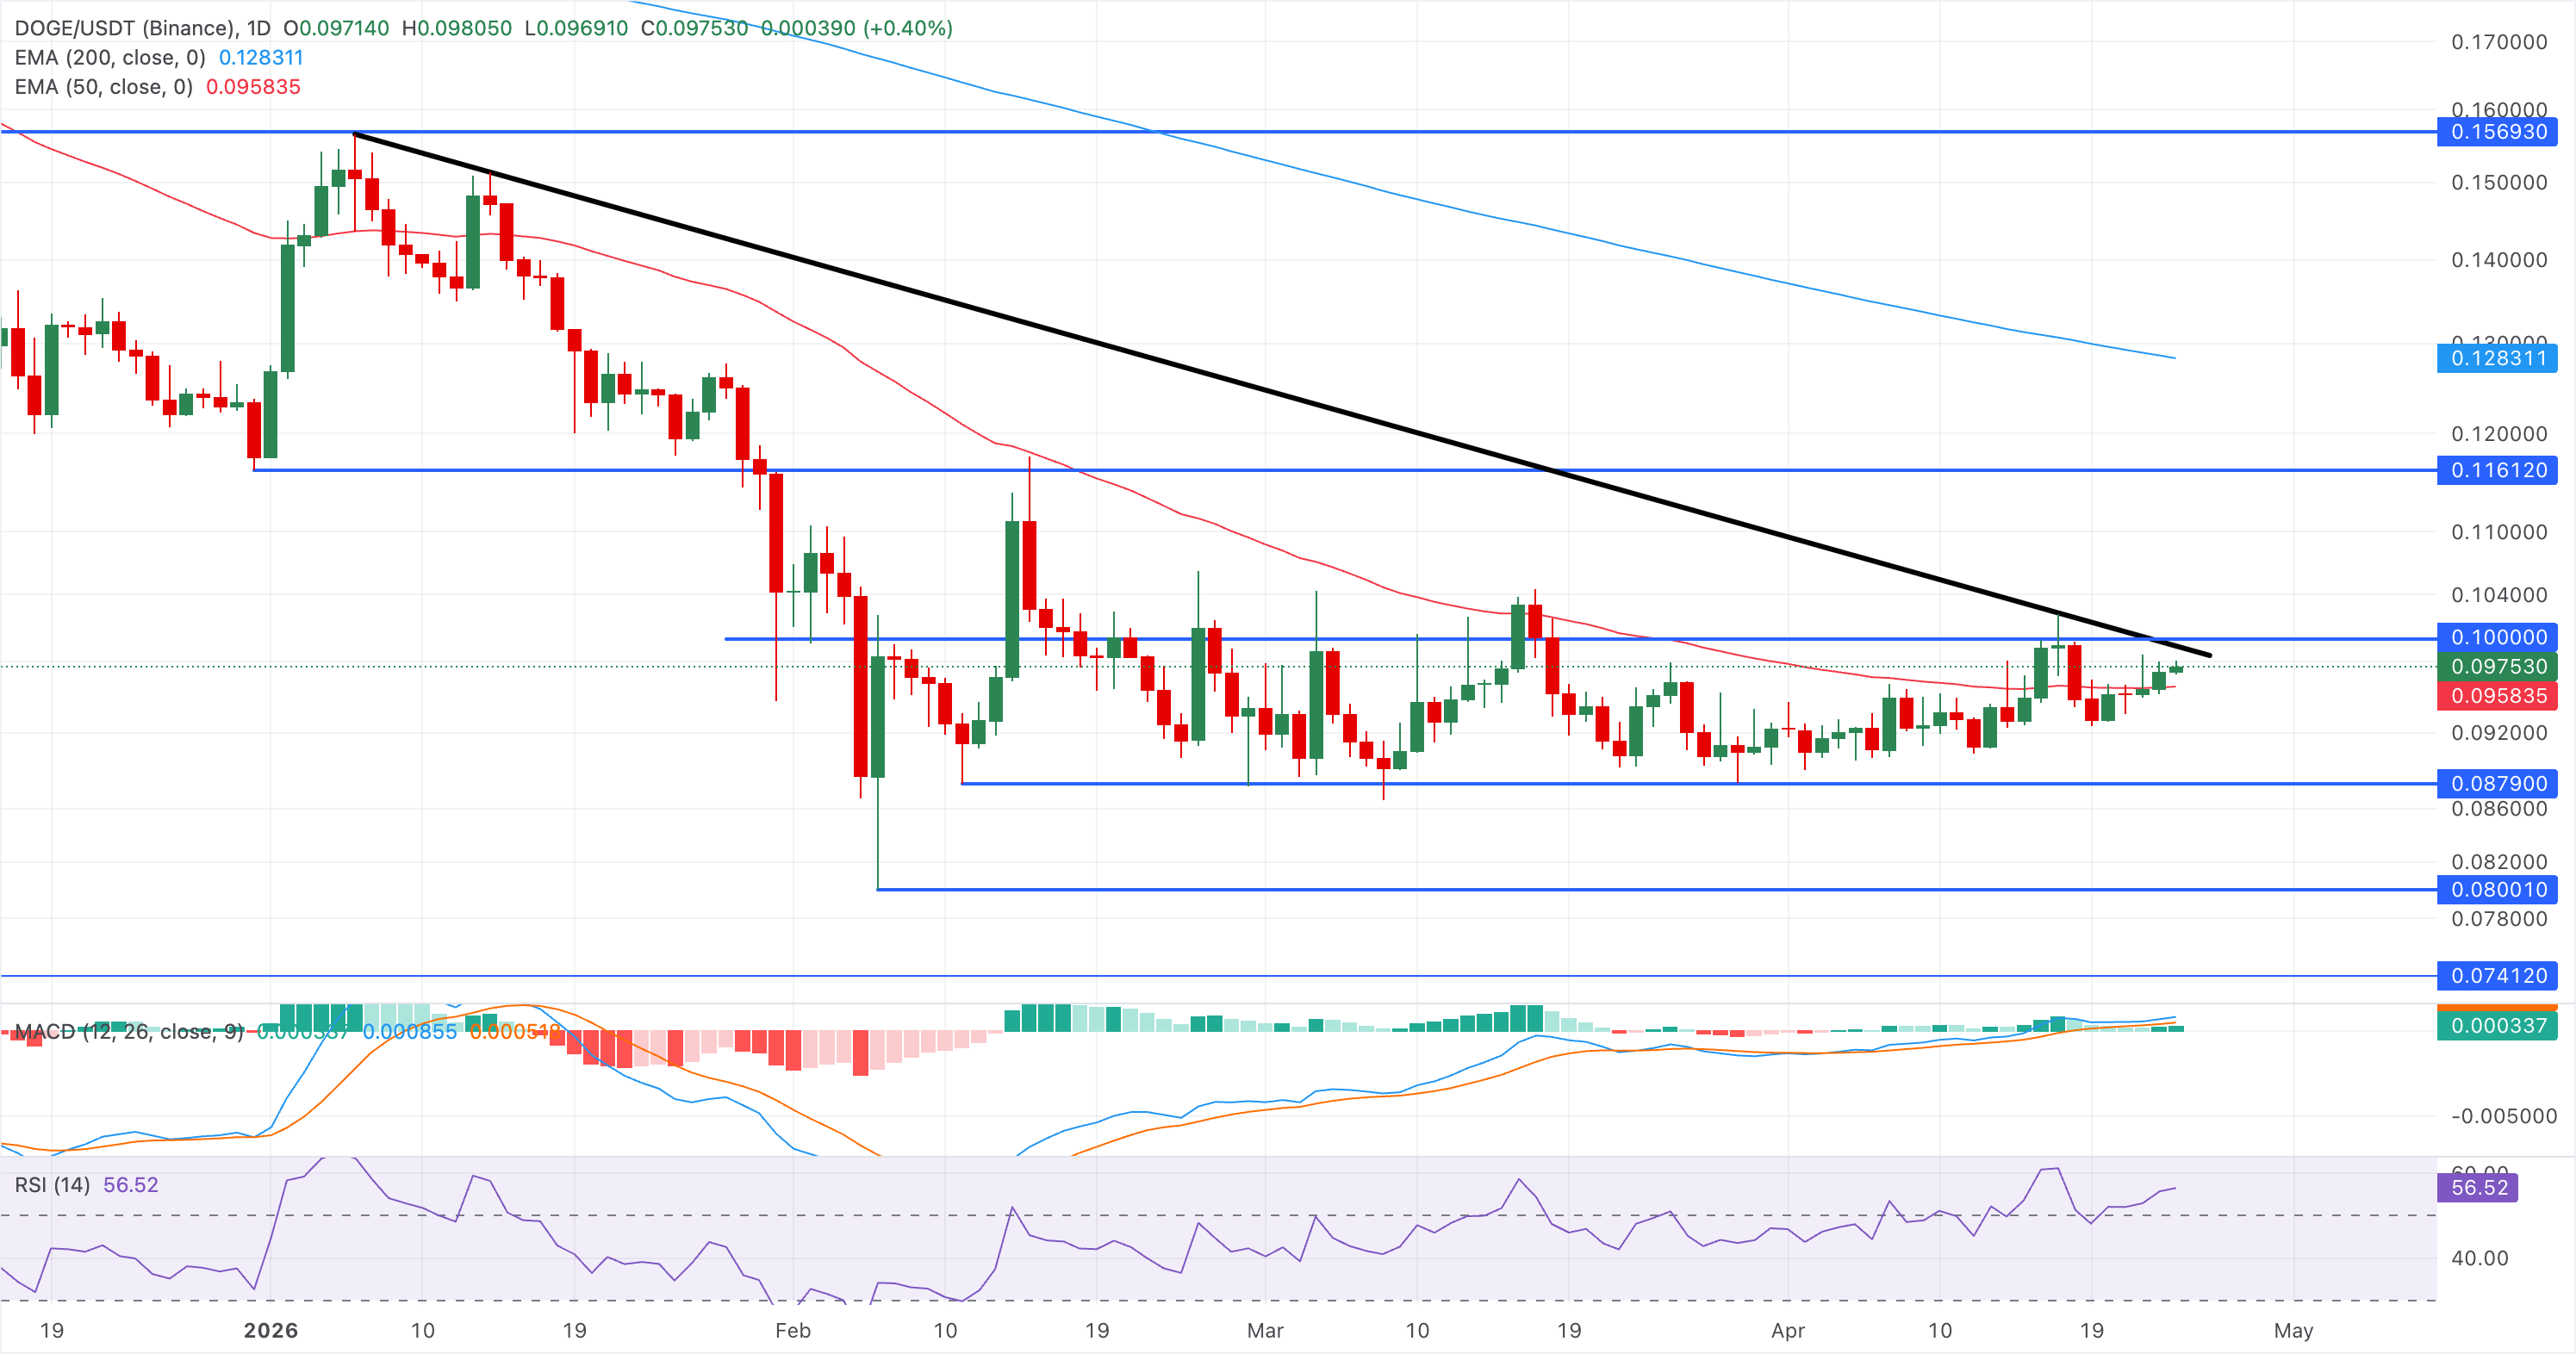
On the downside, the 50-day EMA at $0.095 offers immediate support. A daily close below this level would weaken the emerging upside bias and open the door to a deeper pullback toward the February 11 and 6 lows at $0.087 and $0.080, respectively.
(The technical analysis of this story was written with the help of an AI tool.)

Lebih sejuta pengguna bergantung pada FXStreet untuk data pasaran masa nyata, alat carta, pandangan pakar dan berita Forex. Kalendar ekonomi yang komprehensif dan webinar pendidikan mereka membantu pedagang kekal bermaklumat dan membuat keputusan yang dikira. FXStreet disokong oleh pasukan kira-kira 60 profesional di ibu pejabat Barcelona dan pelbagai wilayah global.
Baca Lagi


