

Dow Jones Industrial Average makes history, then thinks better of it
- DJIA set a fresh record high at Monday's opening bell and handed most of it back within the hour.
- The index lagged the S&P 500 and Nasdaq as chip stocks rebounded and last week's rotation ran in reverse.
- FOMC Minutes on Wednesday will show how seriously the committee is weighing a hike.
The Dow Jones Industrial Average (DJIA) finally crossed 53,000 on Monday, spiking to a record just above the handle in the opening minutes and holding it for roughly the length of the ceremony that produced it. President Trump rang the opening bell from the Oval Office in a first-of-its-kind joint event with both major exchanges. The index celebrated by tagging fresh all-time highs, and sellers removed close to 400 points inside half an hour.

By early afternoon in New York the Dow sat flat near 52,900 while the S&P 500 added 0.7% and the Nasdaq rose 1.1%. The fade and the lag share one explanation: Monday was a technology session, and the Dow's march into record territory was never a technology story.
Leadership on loan
The index climbed nearly 2% last week while the benchmark semiconductor fund shed more than 3% for its second straight losing week, as money rotated out of the chip trade into nearly everything else. On Monday the flow reversed, with chips bouncing roughly 3% on an expanded Broadcom supply deal with Apple, leaving the Dow holding a record it lacked the energy to extend.
Strategists frame the second half as a tug-of-war between the artificial intelligence trade and the broader market. The Dow sits on the broader-market side of that argument, which makes Monday's record both real and conditional.
Records with a hawkish soundtrack
The genuinely strange part of this rally is that it is happening while the market debates whether the next move from the Federal Reserve (Fed) is a hike, not a cut. Thursday's June Nonfarm Payrolls (NFP) report printed 57K against expectations above 100K, paring the hike chatter and letting stagflation worries fade into the long weekend.
Monday's Institute for Supply Management (ISM) Services Purchasing Managers Index (PMI) pushed back: the headline matched consensus at 54, but the employment gauge returned to expansion at 51.2 after months of contraction, and prices paid eased to 67.7, still miles above the growth threshold. A Fed governor's afternoon remarks leaned firmly hawkish and the tape barely blinked. Rate markets still assign roughly three-in-four odds to a hold at this month's meeting, with the residual risk tilted toward tightening rather than relief.
Housekeeping among the components
Microsoft, one of the index's heavyweights, slipped more than 1% after announcing 4.8K job cuts, about 2% of its workforce, with the Xbox unit absorbing an outsized share. Management framed the reductions as adapting to the artificial intelligence era, a polite way of saying the spending has to come from somewhere. Fellow component IBM went the other way as analysts lifted price expectations into its results later this month, a reminder that earnings will soon judge whether this record ages well.
Wednesday is the only date that counts
The calendar stays second-tier until Minutes from the June Federal Open Market Committee (FOMC) meeting land at 18:00 GMT on Wednesday. The committee held at 3.75% last month with an unmistakably hawkish lean, and updated projections showed a visible bloc open to tightening again this year; the Minutes will reveal how broad that appetite runs. Around it, a private payrolls update arrives Tuesday at 12:15 GMT, weekly jobless claims follow Thursday at 12:30 GMT with consensus near 220K against 215K prior, and the New York Fed president speaks later that day.
Levels to watch
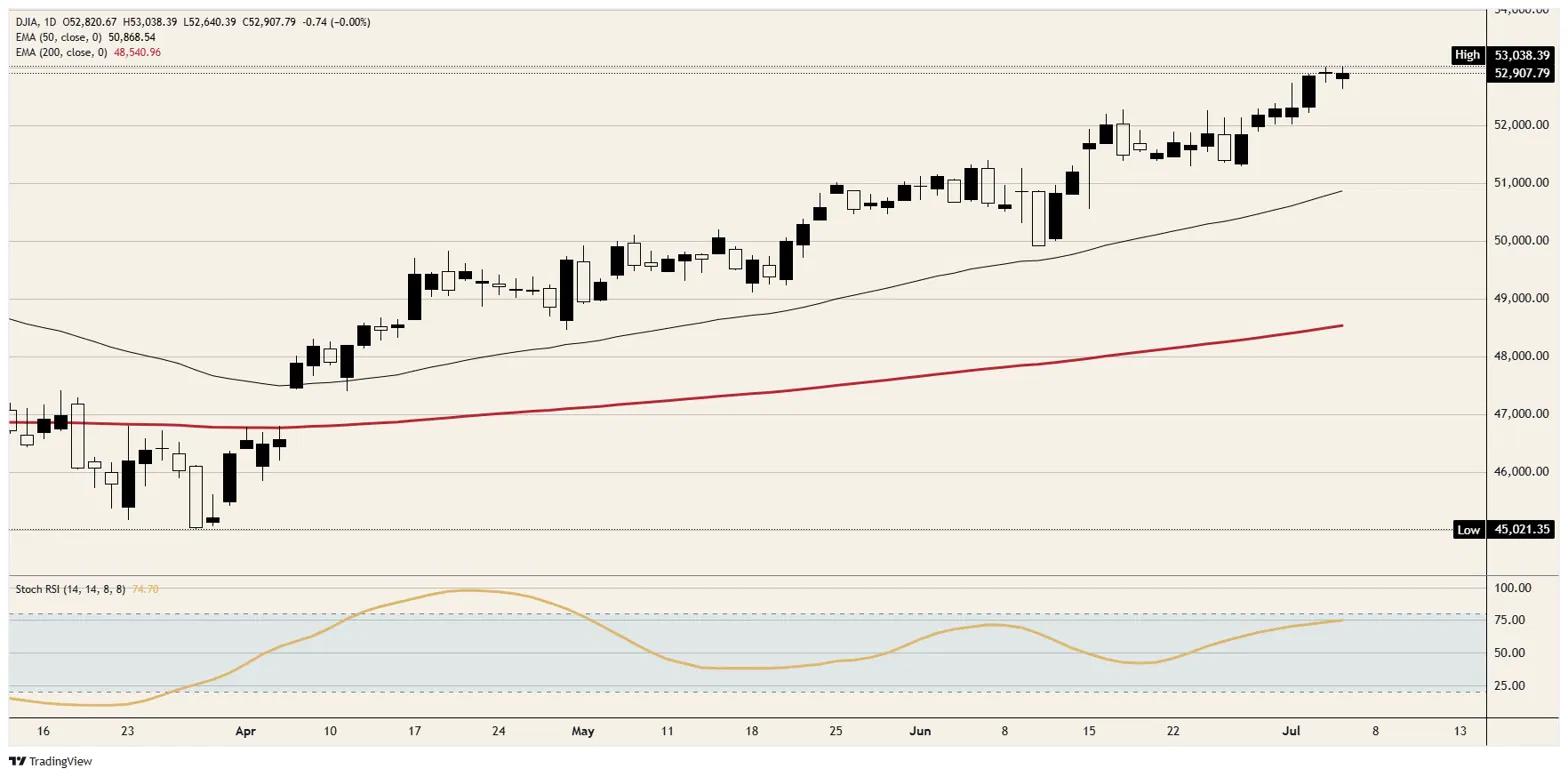
Resistance: The 53,000 handle is the number that matters, with Monday's record just above it near 53,050. Acceptance above the handle on a daily close turns the milestone from a headline into a floor.
Support: Initial demand rests around 52,750, the shelf that absorbed the morning washout, with Monday's spike low close to 52,650 beneath it and the round 52,500 area below that.
Bias: Bullish. The record fade was a rotation story rather than a rejection; buyers repaired most of a 400-point flush within two hours, and the uptrend off the April base near 45,000 is not in question. A hawkish shock in Wednesday's Minutes is the one item with the weight to change that; absent it, the path of least resistance still runs through 53,000.
Dow Jones daily chart
Dow Jones FAQs
The Dow Jones Industrial Average, one of the oldest stock market indices in the world, is compiled of the 30 most traded stocks in the US. The index is price-weighted rather than weighted by capitalization. It is calculated by summing the prices of the constituent stocks and dividing them by a factor, currently 0.152. The index was founded by Charles Dow, who also founded the Wall Street Journal. In later years it has been criticized for not being broadly representative enough because it only tracks 30 conglomerates, unlike broader indices such as the S&P 500.
Many different factors drive the Dow Jones Industrial Average (DJIA). The aggregate performance of the component companies revealed in quarterly company earnings reports is the main one. US and global macroeconomic data also contributes as it impacts on investor sentiment. The level of interest rates, set by the Federal Reserve (Fed), also influences the DJIA as it affects the cost of credit, on which many corporations are heavily reliant. Therefore, inflation can be a major driver as well as other metrics which impact the Fed decisions.
Dow Theory is a method for identifying the primary trend of the stock market developed by Charles Dow. A key step is to compare the direction of the Dow Jones Industrial Average (DJIA) and the Dow Jones Transportation Average (DJTA) and only follow trends where both are moving in the same direction. Volume is a confirmatory criteria. The theory uses elements of peak and trough analysis. Dow’s theory posits three trend phases: accumulation, when smart money starts buying or selling; public participation, when the wider public joins in; and distribution, when the smart money exits.
There are a number of ways to trade the DJIA. One is to use ETFs which allow investors to trade the DJIA as a single security, rather than having to buy shares in all 30 constituent companies. A leading example is the SPDR Dow Jones Industrial Average ETF (DIA). DJIA futures contracts enable traders to speculate on the future value of the index and Options provide the right, but not the obligation, to buy or sell the index at a predetermined price in the future. Mutual funds enable investors to buy a share of a diversified portfolio of DJIA stocks thus providing exposure to the overall index.













