
DUSK Price Forecast: DUSK rebounds after defending a key technical level
Oleh Manish Chhetri
Tarikh Diterbitkan: 3 Feb 2026 | Tarikh Diubah: 3 Feb 2026


ARTIKEL POPULAR

DUSK (DUSK) price is extending its recovery, trading above $0.108 at the time of writing on Tuesday, after finding support at the key level on the previous day. Derivatives data support the ongoing rebound, with growing long bets among traders.
- DUSK price extends recovery on Tuesday after rebounding from the 50-day EMA at $0.10 the previous day.
- Derivatives data indicate improving sentiment, as long bets among traders are rising.
- The technical outlook supports a potential recovery if the key support holds.
DUSK (DUSK) price is extending its recovery, trading above $0.108 at the time of writing on Tuesday, after finding support at the key level on the previous day. Derivatives data support the ongoing rebound, with growing long bets among traders. On the technical side, the outlook is slightly bullish if the key support holds.
DUSK’s derivatives data support improving sentiment
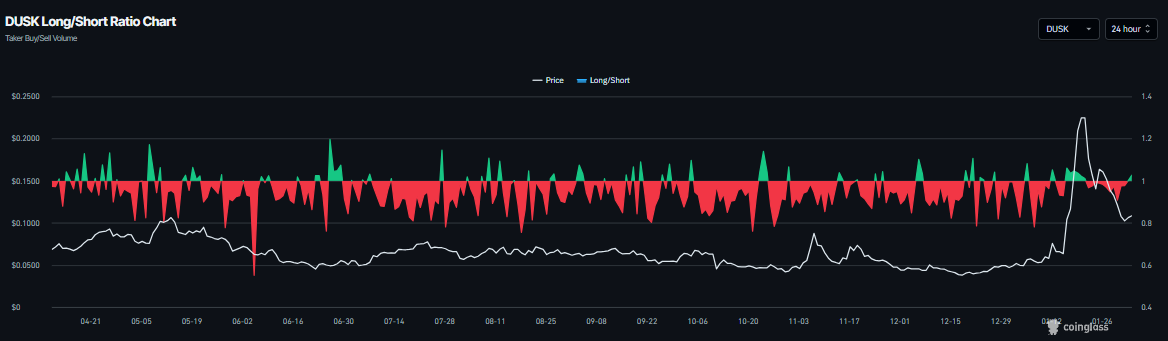
CoinGlass data show that DUSK's long-to-short ratio reads 1.02 on Tuesday and has been steadily rising. The ratio above one reflects bullish sentiment in the markets, as more traders are betting on the asset price to rally.
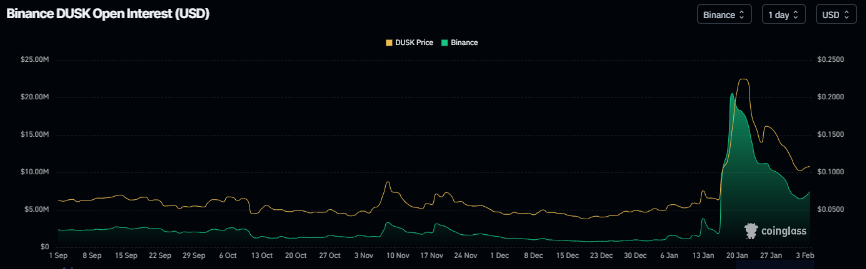
In addition, DUSK’s futures Open Interest (OI) at Binance exchange rose to $7.42 on Tuesday from $6.50 million the previous day, after a sharp fall since mid-January, as shown in the chart below. This mild recovery in OI reflects growing investor participation and points to a constructive outlook.
DUSK Price Forecast: DUSK finds support around key level
DUSK price was rejected around the December 2024 high of $0.338 on January 19 and has since declined by more than 58% over nearly two weeks, retesting the 50-day Exponential Moving Average (EMA) at $0.100 on Sunday. As of Monday, DUSK found support around the 50-day EMA and rebounded slightly. At the time of writing on Tuesday, DUSK is trading above $0.110.
If DUSK continues its recovery, it could extend the advance toward the 61.8% Fibonacci retracement (drawn from the October low of $0.025 to the January 2024 high of $0.329) at $0.148.
The Relative Strength Index (RSI) on the daily chart is 47, pointing upward toward the neutral 50 level, indicating fading bearish momentum. For the bullish momentum to be sustained, the RSI must move above the neutral level.
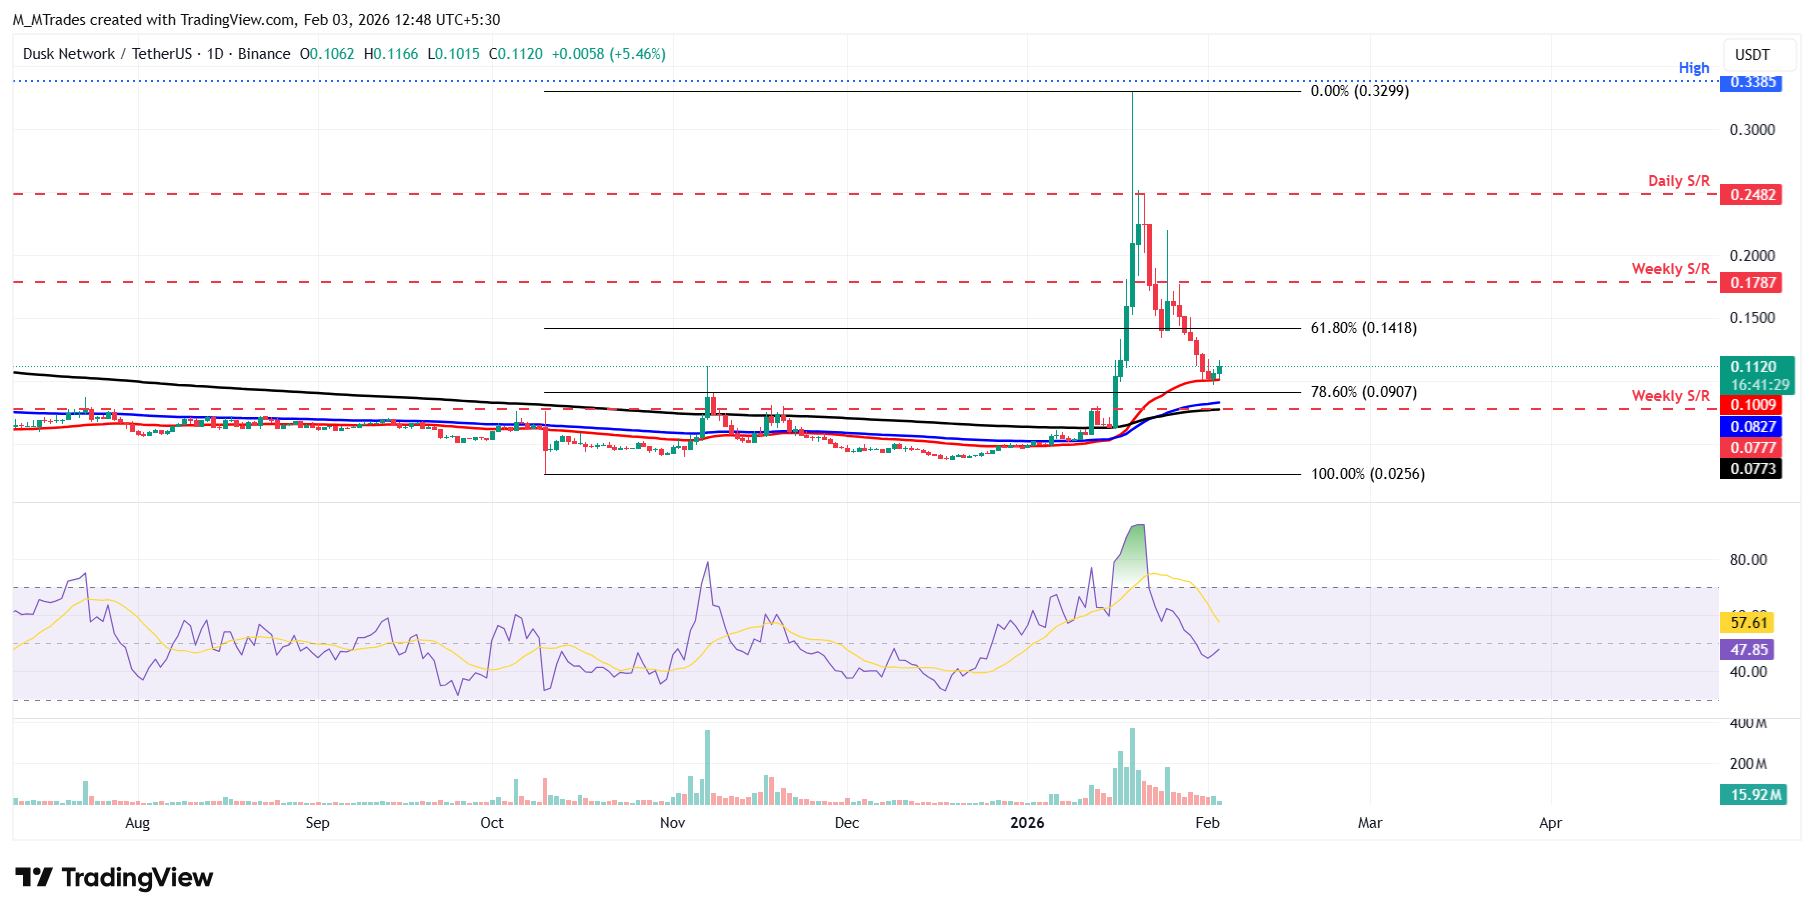
On the other hand, if DUSK closes below the 50-day EMA at $0.100 on a daily basis, it could extend the correction toward the 100-day EMA at $0.082.

Lebih sejuta pengguna bergantung pada FXStreet untuk data pasaran masa nyata, alat carta, pandangan pakar dan berita Forex. Kalendar ekonomi yang komprehensif dan webinar pendidikan mereka membantu pedagang kekal bermaklumat dan membuat keputusan yang dikira. FXStreet disokong oleh pasukan kira-kira 60 profesional di ibu pejabat Barcelona dan pelbagai wilayah global.
Baca Lagi


