
EUR/JPY Price Forecast: Falls to near 183.00 as bearish bias prevails
Oleh Akhtar Faruqui
Dikemas kini: 1 May 2026


ARTIKEL POPULAR

EUR/JPY loses ground for the second successive day, trading around 183.00 during early European hours on Friday.
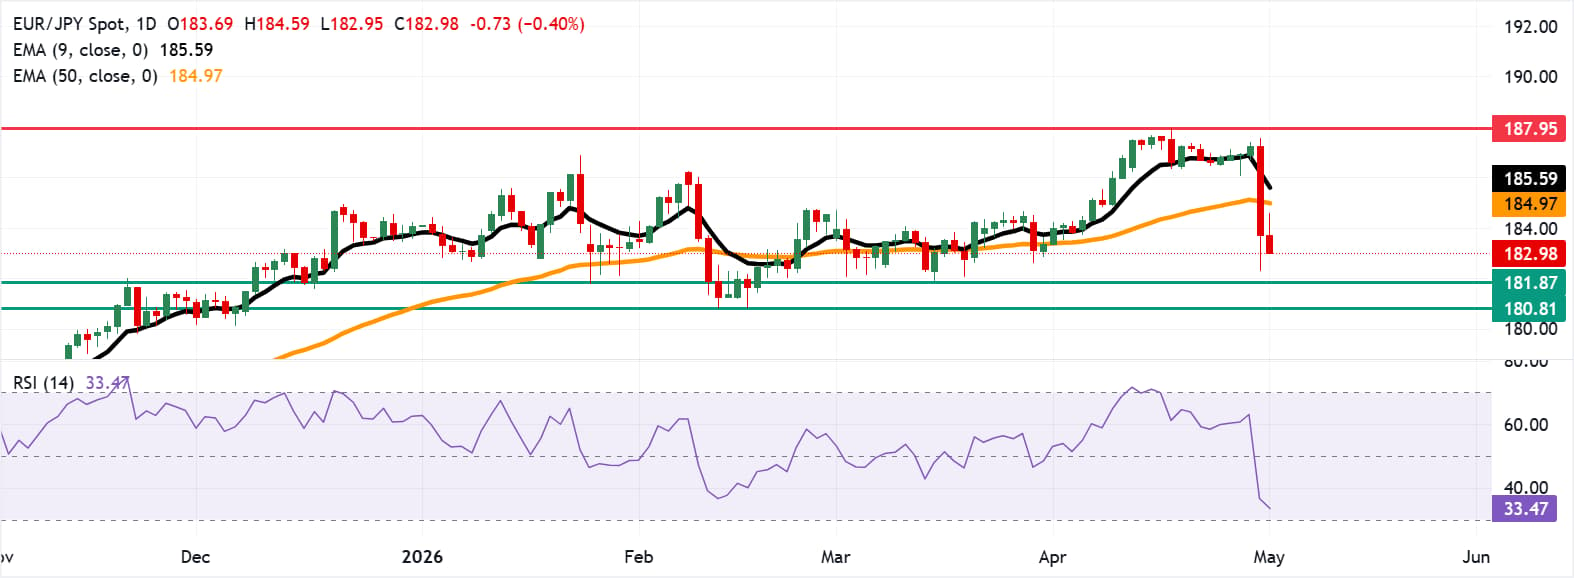
- EUR/JPY may further depreciate toward the 10-week low at 181.87.
- The 14-day Relative Strength Index at 40.9 has moved closer to neutral territory.
- The primary resistance lies at the 50-day EMA at 184.97.
EUR/JPY loses ground for the second successive day, trading around 183.00 during early European hours on Friday. The technical analysis of the daily chart indicates the currency cross holds a bearish near-term bias as spot remains capped beneath the nine-period and the 50-period Exponential Moving Averages (EMAs).
The EUR/JPY cross is retreating from recent highs, while the 14-day Relative Strength Index (RSI) at 40.9 has eased back toward neutral territory, hinting that downside pressure is present but not yet stretched into oversold conditions.
On the downside, the EUR/JPY cross may navigate the region around the initial support, around the 10-week low of 181.87, recorded on March 16, followed by nearly a five-month low of 180.81, which was reached on February 12.
The EUR/JPY cross may rebound toward the 50-day EMA at 184.97, followed by the nine-day EMA at 185.59. A sustained break above the medium- and short-term averages would cause the emergence of the bullish bias and support the currency cross to explore the region around the all-time high of 187.95, which was recorded on April 17.
(The technical analysis of this story was written with the help of an AI tool.)
Euro Price Today
The table below shows the percentage change of Euro (EUR) against listed major currencies today. Euro was the weakest against the Japanese Yen.
| USD | EUR | GBP | JPY | CAD | AUD | NZD | CHF | |
|---|---|---|---|---|---|---|---|---|
| USD | -0.05% | -0.06% | -0.33% | -0.01% | 0.03% | 0.20% | -0.03% | |
| EUR | 0.05% | -0.02% | -0.26% | 0.02% | 0.09% | 0.23% | 0.01% | |
| GBP | 0.06% | 0.02% | -0.23% | 0.05% | 0.10% | 0.27% | 0.05% | |
| JPY | 0.33% | 0.26% | 0.23% | 0.27% | 0.31% | 0.44% | 0.25% | |
| CAD | 0.00% | -0.02% | -0.05% | -0.27% | 0.03% | 0.19% | 0.00% | |
| AUD | -0.03% | -0.09% | -0.10% | -0.31% | -0.03% | 0.15% | -0.05% | |
| NZD | -0.20% | -0.23% | -0.27% | -0.44% | -0.19% | -0.15% | -0.20% | |
| CHF | 0.03% | -0.01% | -0.05% | -0.25% | -0.00% | 0.05% | 0.20% |
The heat map shows percentage changes of major currencies against each other. The base currency is picked from the left column, while the quote currency is picked from the top row. For example, if you pick the Euro from the left column and move along the horizontal line to the US Dollar, the percentage change displayed in the box will represent EUR (base)/USD (quote).

Lebih sejuta pengguna bergantung pada FXStreet untuk data pasaran masa nyata, alat carta, pandangan pakar dan berita Forex. Kalendar ekonomi yang komprehensif dan webinar pendidikan mereka membantu pedagang kekal bermaklumat dan membuat keputusan yang dikira. FXStreet disokong oleh pasukan kira-kira 60 profesional di ibu pejabat Barcelona dan pelbagai wilayah global.
Baca Lagi


