
GBP/JPY Price Forecast: Rejected at 216.00, risks deepen below 215.00
Oleh Christian Borjon Valencia
Dikemas kini: 23 Apr 2026


ARTIKEL POPULAR

GBP/JPY advance stalls around 215.70, then retreats to 215.00 as risk appetite deteriorates amid Middle East headlines, leaving traders uncertain about the conflict's outcome. The cross trades at 215.06 at the time of writing.
- GBP/JPY fails near 216, as repeated rejection pushes the cross lower.
- RSI drifts toward 50, indicating weakening bullish momentum strength.
- Break below 215 exposes 214.00 and 213.35 support levels.
GBP/JPY advance stalls around 215.70, then retreats to 215.00 as risk appetite deteriorates amid Middle East headlines, leaving traders uncertain about the conflict's outcome. The cross trades at 215.06 at the time of writing.
GBP/JPY Price Forecast: Technical Outlook
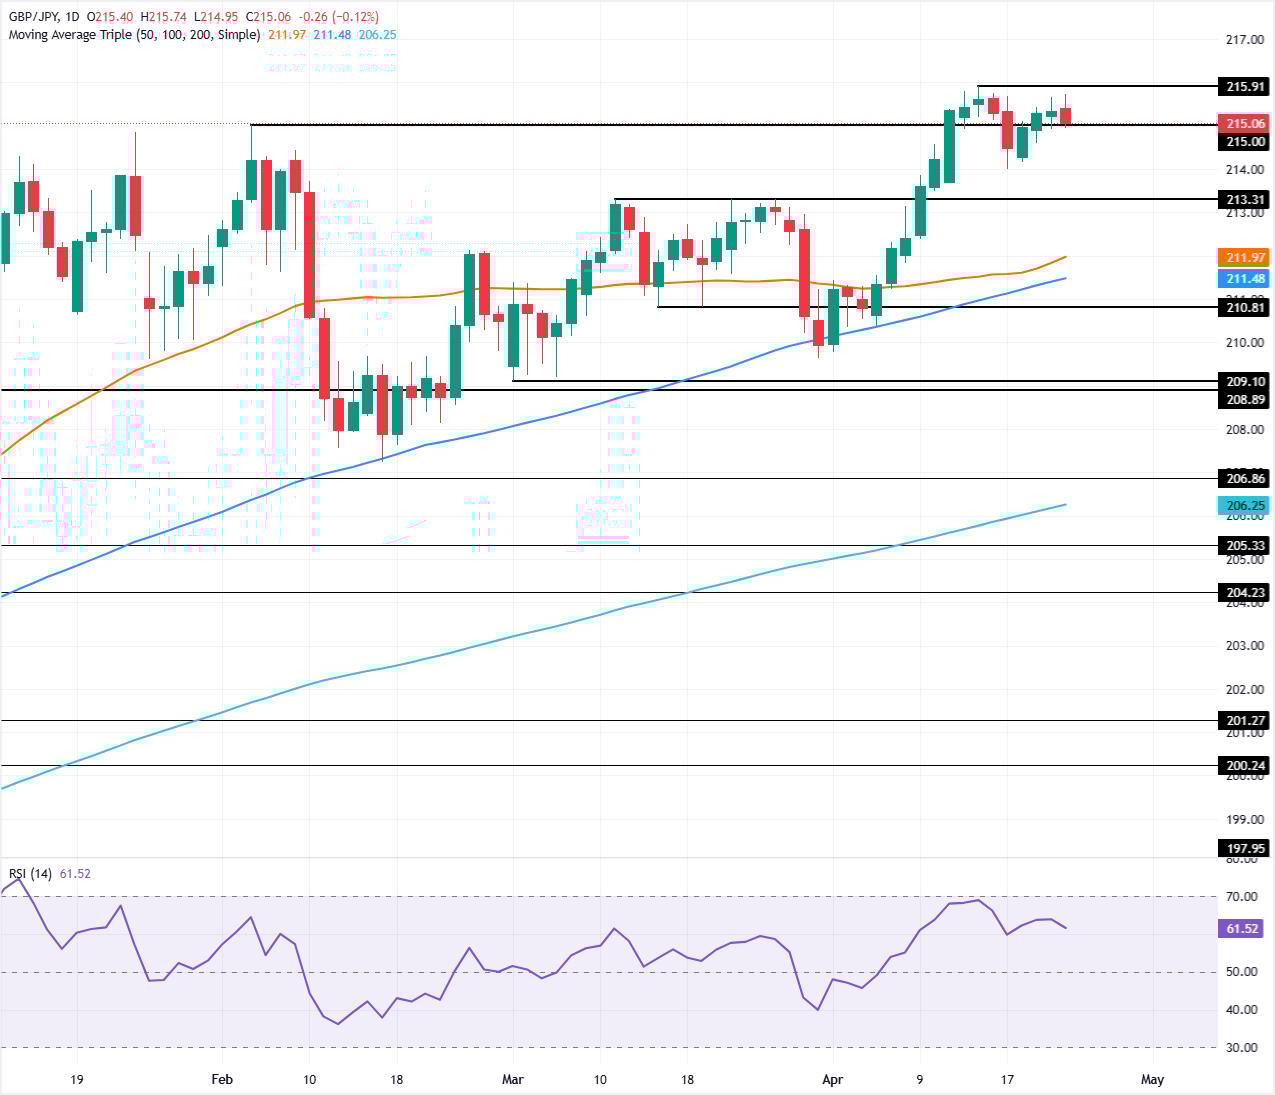
The GBP/JPY is consolidating for the second straight day, suggesting that further gains are off the table, with the psychological 216.00 level not yet tested. Worth noting that every upside move towards the latter was rejected, with the 214.00 figure capping downward moves.
Momentum is bullish, as depicted by the Relative Strength Index (RSI), though moving gradually towards its 50 neutral level.
If GBP/JPY closes daily below 215.00, the potential to test the April 17 swing low of 214.00 increases. On further weakness, the next support would be the 20-day Simple Moving Average (SMA) at 213.35, followed by the 50-day SMA at 211.98.
On the other hand, if GBP/JPY registers a new yearly high above 215.91, the chance of clearing 216.00 increases.
GBP/JPY Price Chart – Daily
Japanese Yen Price This week
The table below shows the percentage change of Japanese Yen (JPY) against listed major currencies this week. Japanese Yen was the strongest against the Swiss Franc.
| USD | EUR | GBP | JPY | CAD | AUD | NZD | CHF | |
|---|---|---|---|---|---|---|---|---|
| USD | 0.50% | 0.17% | 0.59% | 0.09% | -0.05% | 0.15% | 0.64% | |
| EUR | -0.50% | -0.32% | 0.07% | -0.39% | -0.52% | -0.39% | 0.14% | |
| GBP | -0.17% | 0.32% | 0.41% | -0.06% | -0.19% | -0.06% | 0.47% | |
| JPY | -0.59% | -0.07% | -0.41% | -0.51% | -0.58% | -0.45% | 0.07% | |
| CAD | -0.09% | 0.39% | 0.06% | 0.51% | -0.03% | 0.05% | 0.53% | |
| AUD | 0.05% | 0.52% | 0.19% | 0.58% | 0.03% | 0.20% | 0.70% | |
| NZD | -0.15% | 0.39% | 0.06% | 0.45% | -0.05% | -0.20% | 0.50% | |
| CHF | -0.64% | -0.14% | -0.47% | -0.07% | -0.53% | -0.70% | -0.50% |
The heat map shows percentage changes of major currencies against each other. The base currency is picked from the left column, while the quote currency is picked from the top row. For example, if you pick the Japanese Yen from the left column and move along the horizontal line to the US Dollar, the percentage change displayed in the box will represent JPY (base)/USD (quote).

Lebih sejuta pengguna bergantung pada FXStreet untuk data pasaran masa nyata, alat carta, pandangan pakar dan berita Forex. Kalendar ekonomi yang komprehensif dan webinar pendidikan mereka membantu pedagang kekal bermaklumat dan membuat keputusan yang dikira. FXStreet disokong oleh pasukan kira-kira 60 profesional di ibu pejabat Barcelona dan pelbagai wilayah global.
Baca Lagi


