
GBP/USD tops 1.3400 as fragile truce keeps Sterling bid aloft now
Oleh Christian Borjon Valencia
Dikemas kini: 9 Apr 2026


ARTIKEL POPULAR

The GBP/USD advances past the 1.3400 figure as risk appetite deteriorates, as the Middle East conflict seems fragile, as Israel strikes Lebanon, and as they prolong its conflict with Hezbollah. At the time of writing, the pair trades at 1.3441, up 0.36%.
- Fragile ceasefire hopes and regional attacks kept geopolitical risks in focus.
- US PCE inflation stayed firm, while labor market data remained resilient.
- BoE hike expectations and a softer Dollar helped Sterling stay supported.
The GBP/USD advances past the 1.3400 figure as risk appetite deteriorates, as the Middle East conflict seems fragile, as Israel strikes Lebanon, and as they prolong its conflict with Hezbollah. At the time of writing, the pair trades at 1.3441, up 0.36%.
Pound gains as Mideast tensions persist and Fed bets hold firm
Wall Street trades barely unchanged, while the Greenback shows signs of life, trimming some of its earlier losses according to the US Dollar Index (DXY). The DXY, which measures the buck’s performance against six currencies, is up 0.01% at 99.01, after a 1% decline over the last two days.
Geopolitics continued to drive the markets, as there are no signs that Iran will open the Strait of Hormuz, as Tehran demands that the ceasefire deal include Lebanon. Meanwhile, Israel intensified its attacks, which had killed more than 250 people, threatening an escalation of the conflict in the region.
US data showed that inflation in February rose by 0.4% MoM, above the prior month’s 0.3%. In the twelve months to February, the Personal Consumption Expenditures (PCE) Price Index expanded 2.8%, as in January. Core figures, which the Fed considers the preferred inflation gauge, were 0.4% MoM for the same period, as expected and unchanged from January, while for the whole year, prices dipped from 3.1% to 3% as estimated.
Traders' expectations for Fed rate cuts remained unchanged, as shown by money markets, which estimated six basis points of easing towards the end of the year, according to the CME FedWatch Tool.
Jobs data was also solid, even though Initial Jobless Claims for the week ending April 4 jumped from the 210K expected to 219K, exceeding the previous reading of 203K. The print was slightly above the 4-week average of jobless claims at 210K, but Continuing Claims decreased by 38K to 1.794K, its lowest level since May 2024.
Sterling boosted by BoE rate hike expectations
In the UK, the economic docket remains scarce, yet the British Pound extended its gains amid improved risk appetite and expectations of further rate hikes by the Bank of England.
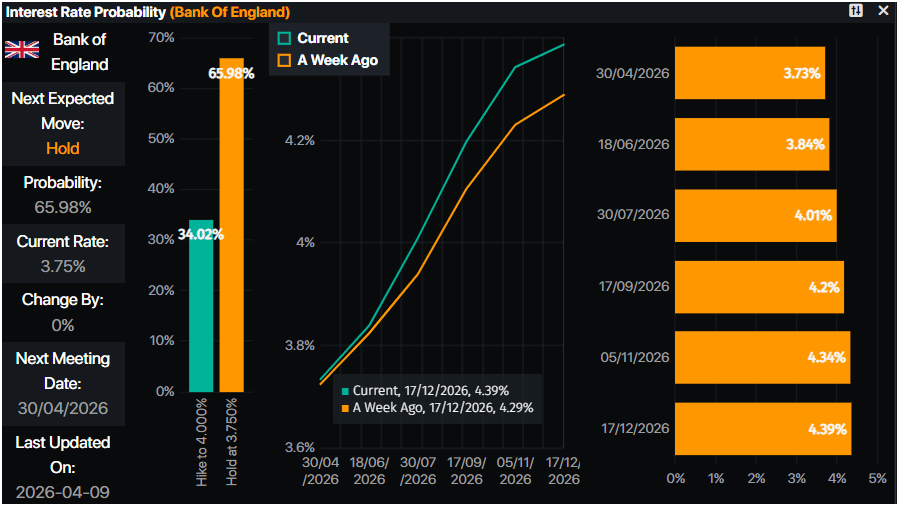
Data from Prime Market Terminal (PMT) revealed that markets expect the BoE to hike at the June 18 meeting, with a slim 21% chance of a rate hike on April 30. For the whole year, investors expect 39 basis points of tightening.
BoE interest rate probabilities
Ahead, GBP/USD traders will eye the US Consumer Price Index (CPI) report for March, which is projected to show a substantial increase, mostly in the headline print, rising from 2.4% to 3.3%. Core CPI is expected to rise from 2.5% to 2.7%.
GBP/USD Price Analysis: Technical outlook
In the daily chart, GBP/USD trades at 1.3437. The pair holds just under the latest simple Moving Average Triple reading at 1.3439, leaving price capped by this cluster of medium-term averages and maintaining a mildly bearish bias while it remains below that area. The previously resisted downtrend line, referenced around 1.3137, now sits well beneath spot and hints that the broader structure still guards the downside even as topside attempts stall under moving-average pressure.
On the topside, immediate resistance is located at the simple Moving Average Triple around 1.3439, and a sustained break above it would be needed to ease the current cap and expose the higher reference area near the former uptrend support line around 1.3785. On the downside, initial support is inferred from the reclaimed downtrend line region near 1.3137, where a break lower would reopen deeper losses within the broader bearish structure.
(The technical analysis of this story was written with the help of an AI tool.)
Pound Sterling Price This week
The table below shows the percentage change of British Pound (GBP) against listed major currencies this week. British Pound was the strongest against the US Dollar.
| USD | EUR | GBP | JPY | CAD | AUD | NZD | CHF | |
|---|---|---|---|---|---|---|---|---|
| USD | -1.55% | -1.85% | -0.48% | -0.91% | -2.72% | -2.92% | -1.40% | |
| EUR | 1.55% | -0.30% | 1.10% | 0.65% | -1.19% | -1.39% | 0.13% | |
| GBP | 1.85% | 0.30% | 1.32% | 0.95% | -0.89% | -1.10% | 0.45% | |
| JPY | 0.48% | -1.10% | -1.32% | -0.44% | -2.24% | -2.42% | -0.95% | |
| CAD | 0.91% | -0.65% | -0.95% | 0.44% | -1.82% | -2.00% | -0.50% | |
| AUD | 2.72% | 1.19% | 0.89% | 2.24% | 1.82% | -0.21% | 1.35% | |
| NZD | 2.92% | 1.39% | 1.10% | 2.42% | 2.00% | 0.21% | 1.56% | |
| CHF | 1.40% | -0.13% | -0.45% | 0.95% | 0.50% | -1.35% | -1.56% |
The heat map shows percentage changes of major currencies against each other. The base currency is picked from the left column, while the quote currency is picked from the top row. For example, if you pick the British Pound from the left column and move along the horizontal line to the US Dollar, the percentage change displayed in the box will represent GBP (base)/USD (quote).

Lebih sejuta pengguna bergantung pada FXStreet untuk data pasaran masa nyata, alat carta, pandangan pakar dan berita Forex. Kalendar ekonomi yang komprehensif dan webinar pendidikan mereka membantu pedagang kekal bermaklumat dan membuat keputusan yang dikira. FXStreet disokong oleh pasukan kira-kira 60 profesional di ibu pejabat Barcelona dan pelbagai wilayah global.
Baca Lagi


