
Gold slides over 2% as Trump extends Iran operation, lifts USD bids
Oleh Christian Borjon Valencia
Dikemas kini: 2 Apr 2026


ARTIKEL POPULAR

Gold price recoils by some 2% as the US Dollar rises after US President Donald Trump revealed that the war on Iran would last from two to three weeks, pouring cold water on hopes for a quick resolution to the Middle East conflict.
- Gold drops as Trump’s remarks dampen hopes for a quick de-escalation.
- Firmer US Dollar and steady Treasury yields weigh on bullion prices.
- Traders now shift focus to Friday’s US Nonfarm Payrolls report.
Gold price recoils by some 2% as the US Dollar rises after US President Donald Trump revealed that the war on Iran would last from two to three weeks, pouring cold water on hopes for a quick resolution to the Middle East conflict. The XAU/USD trades at $4,659, after sliding from a daily peak of $4,800.
Bullion retreats as risk hopes fade and payrolls move into view
The US Dollar Index (DXY), which tracks the buck’s value versus six currencies, is up 0.40% up at 99.95, a tailwind for Bullion prices, which are US Dollar-denominated.
Late Wednesday, Trump signaled a quick end to the Iran operation but warned that, absent a deal, Washington could target Iran’s energy and oil infrastructure. Recently, on a post in his Truth Social network, he posted a video of a blasted bridge in Iran, which said, “The biggest bridge in Iran comes tumbling down, never to be used again — Much more to follow! IT IS TIME FOR IRAN TO MAKE A DEAL BEFORE IT IS TOO LATE, AND THERE IS NOTHING LEFT OF WHAT STILL COULD BECOME A GREAT COUNTRY! President DONALD J. TRUMP.”
According to a US official, telling Axios that the bridge was used by the Iranian armed forces to try and secretly move missiles and missile parts from Tehran to launch sites in Western Iran.
In the meantime, hostilities continued, with newswires reporting explosions in Baghdad. Iran’s President Pezeshkian said that Iran is not seeking to expand the scope of tension and war in the region, via Iraq State News Agency.
On the data front, the US trade deficit widened in February, as a major rebound in imports outpaced exports. Earlier, US jobs data revealed that Initial Jobless Claims for the week ending March 28 dipped from the previous print of 215K to 202K, beneath forecasts of 212K.
Earlier, the US Challenger Grey & Christmas report revealed that companies laid off 60.62K jobs in March, up more than 24% from 2025 figures.
The yield in the US 10-year Treasury note remained steady after dropping nearly four basis points earlier before settling at around 4.311%, barely unchanged.
Dallas Fed’s Lorie Logan noted that policy remains appropriately calibrated to address uncertainty, stressing that the Fed is prepared to tweak rates if required. She cautioned that tensions in the Middle East are clouding the economic outlook.
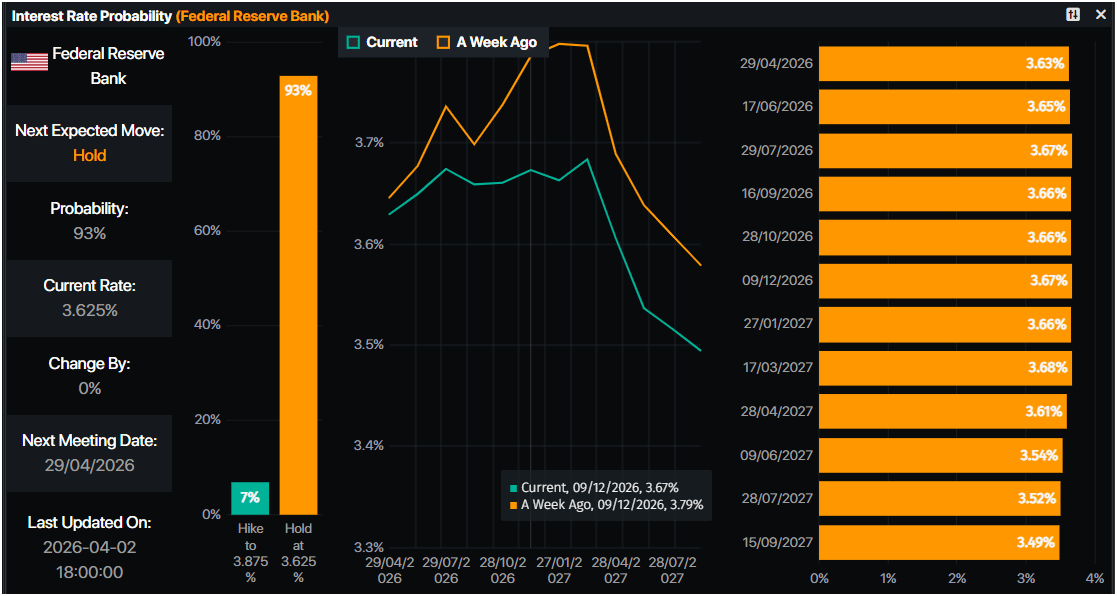
Meanwhile, the swaps market has priced in the Federal Reserve (Fed) holding rates unchanged throughout 2026, according to Prime Market Terminal data.
Fed interest rate probabilities
Friday’s economic docket in the US
Focus shifts to March Nonfarm Payroll figures, expected at 60K, an improvement following February’s dismal -92K drop. The Unemployment Rate is projected at 4.4%, unchanged from the previous month.
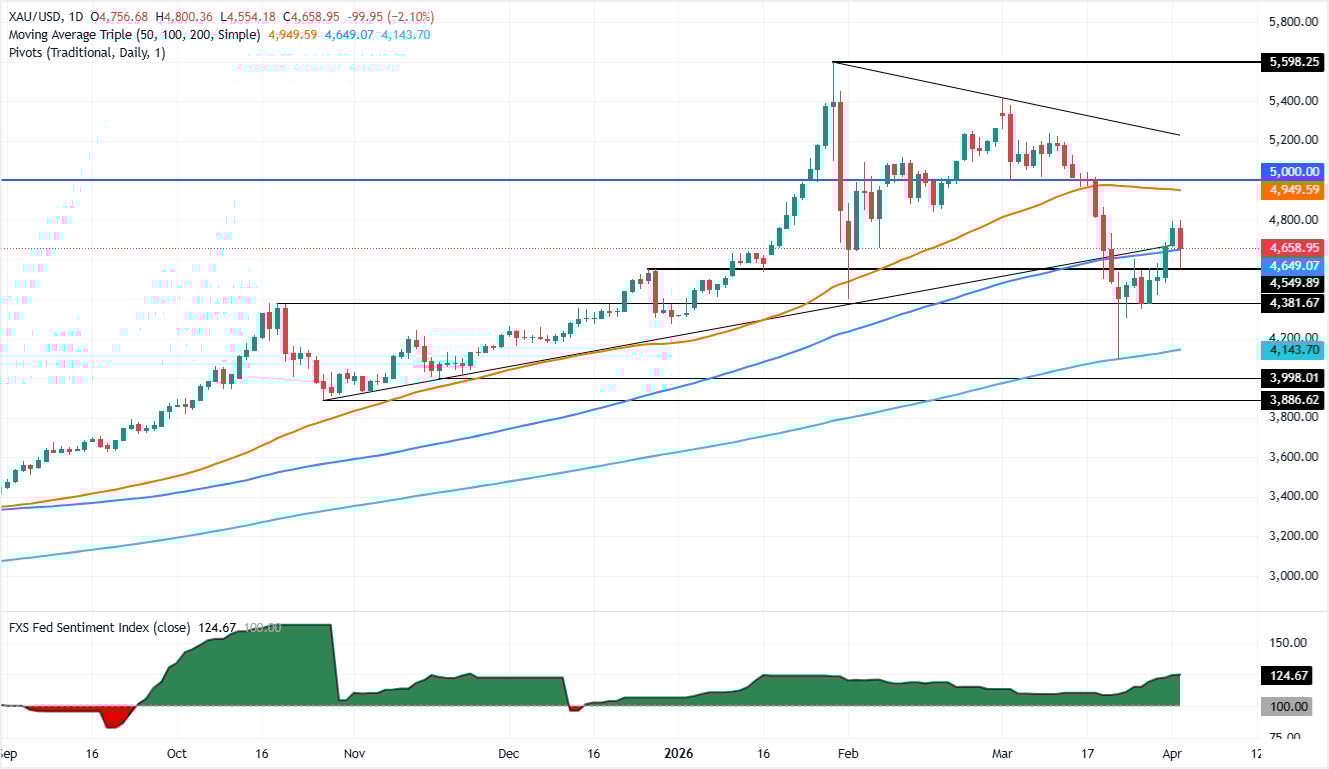
XAU/USD technical outlook: Gold to remain sideways between the 20 and 100-day SMAs
From a technical perspective, Gold is poised to consolidate further, capped on the upside by the 20-day Simple Moving Average (SMA) at $4,780, and on the downside by the 100-day SMA at $4,632. Momentum seems poised to the downside as the Relative Strength Index (RSI) slope points downward below its 50-neutral level.
Still, XAU/USD bounced off daily lows of $4,553, climbing past the 100-day SMA, but for a bullish continuation it needs to clear the 20-day SMA. In that outcome, this clears the path toward $4,900 ahead of the 50-day SMA at $4,948.
On the flip side, on further weakness, the first support is the 100-day SMA, followed by the day’s low. Once breached, the next stop would be $4,500, exposing the most recent cycle low of $4,351, the March 26 low.
Gold FAQs
Gold has played a key role in human’s history as it has been widely used as a store of value and medium of exchange. Currently, apart from its shine and usage for jewelry, the precious metal is widely seen as a safe-haven asset, meaning that it is considered a good investment during turbulent times. Gold is also widely seen as a hedge against inflation and against depreciating currencies as it doesn’t rely on any specific issuer or government.
Central banks are the biggest Gold holders. In their aim to support their currencies in turbulent times, central banks tend to diversify their reserves and buy Gold to improve the perceived strength of the economy and the currency. High Gold reserves can be a source of trust for a country’s solvency. Central banks added 1,136 tonnes of Gold worth around $70 billion to their reserves in 2022, according to data from the World Gold Council. This is the highest yearly purchase since records began. Central banks from emerging economies such as China, India and Turkey are quickly increasing their Gold reserves.
Gold has an inverse correlation with the US Dollar and US Treasuries, which are both major reserve and safe-haven assets. When the Dollar depreciates, Gold tends to rise, enabling investors and central banks to diversify their assets in turbulent times. Gold is also inversely correlated with risk assets. A rally in the stock market tends to weaken Gold price, while sell-offs in riskier markets tend to favor the precious metal.
The price can move due to a wide range of factors. Geopolitical instability or fears of a deep recession can quickly make Gold price escalate due to its safe-haven status. As a yield-less asset, Gold tends to rise with lower interest rates, while higher cost of money usually weighs down on the yellow metal. Still, most moves depend on how the US Dollar (USD) behaves as the asset is priced in dollars (XAU/USD). A strong Dollar tends to keep the price of Gold controlled, whereas a weaker Dollar is likely to push Gold prices up.

Lebih sejuta pengguna bergantung pada FXStreet untuk data pasaran masa nyata, alat carta, pandangan pakar dan berita Forex. Kalendar ekonomi yang komprehensif dan webinar pendidikan mereka membantu pedagang kekal bermaklumat dan membuat keputusan yang dikira. FXStreet disokong oleh pasukan kira-kira 60 profesional di ibu pejabat Barcelona dan pelbagai wilayah global.
Baca Lagi


