
Hyperliquid Price Forecast: HYPE tests key support as sell-side pressure intensifies
Oleh Vishal Dixit
Tarikh Diterbitkan: 11 Feb 2026 | Tarikh Diubah: 11 Feb 2026


ARTIKEL POPULAR

Hyerliquid (HYPE) drops to its 50-day Exponential Moving Average (EMA) at $28.85 at the time of writing on Wednesday, extending a decline of roughly 10% so far this week. The declining bullish interest in HYPE derivatives results in a short-side-dominant positional build-up.
- Hyperliquid tests the 50-day EMA on Wednesday following an 8% decline the previous day.
- Derivatives data show a sell-side inclination among traders amid falling Open Interest and short positional build-up.
- The technical outlook for Hyperliquid indicates downside risk if the 50-day EMA fails to absorb the selling pressure.
Hyerliquid (HYPE) drops to its 50-day Exponential Moving Average (EMA) at $28.85 at the time of writing on Wednesday, extending a decline of roughly 10% so far this week. The declining bullish interest in HYPE derivatives results in a short-side-dominant positional build-up. The technical outlook for Hyperliquid focuses on the 50-day EMA as the short-term moat amid rising selling pressure.
Bears tighten grip over HYPE retail sentiment
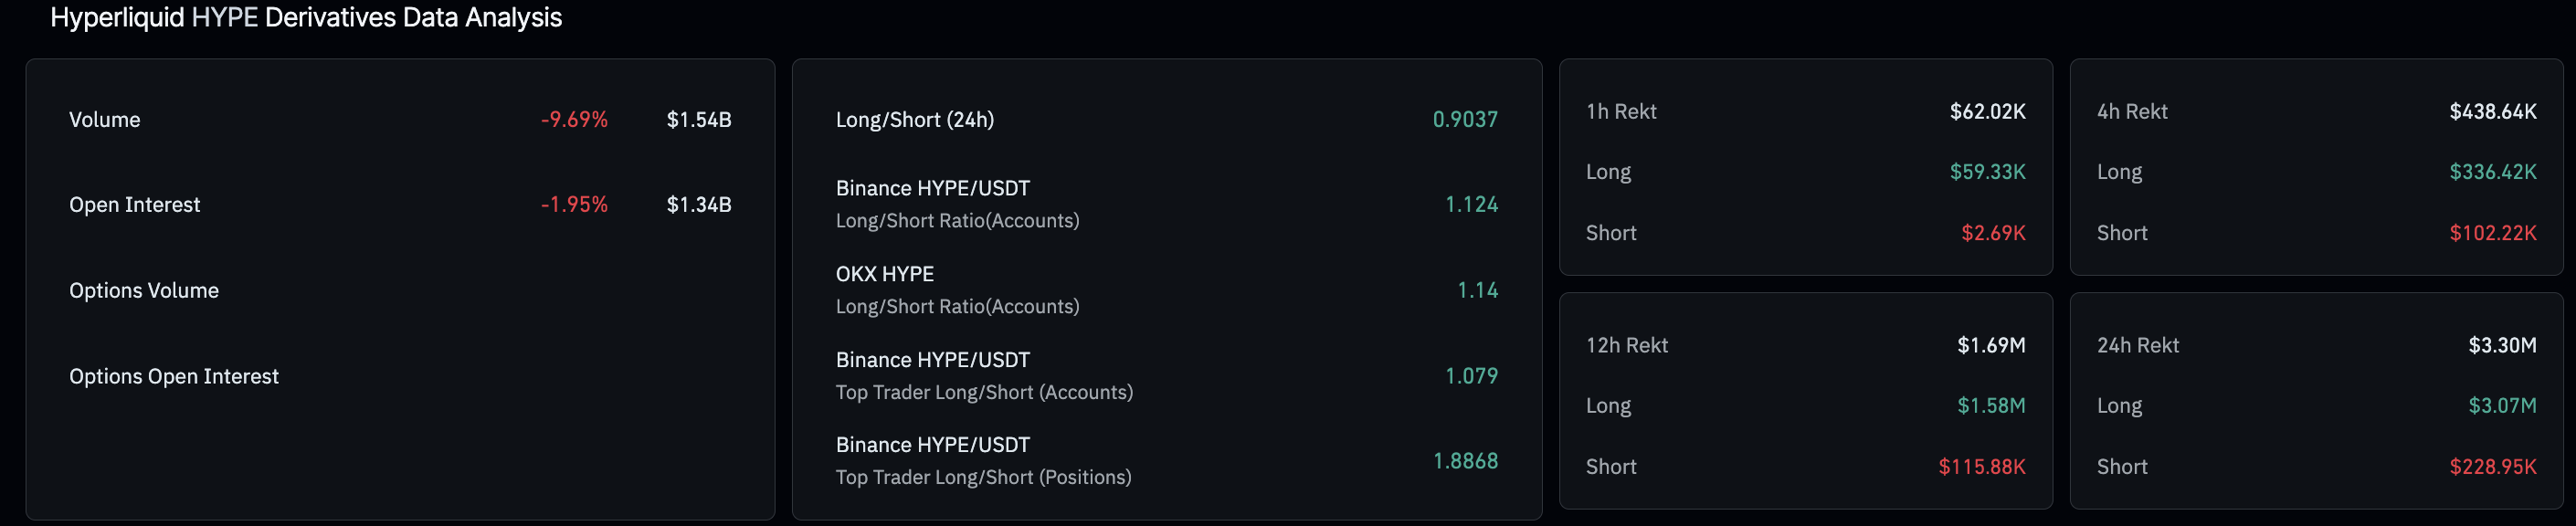
Hyperliquid, the perpetuals-focused Decentralized Exchange (DEX) token, is struggling to retain its retail demand. CoinGlass data indicate that the HYPE futures Open Interest (OI) has declined by approximately 2% over the last 24 hours to $1.34 billion, suggesting that traders are either closing positions (possibly forced liquidation) or reducing leverage.
Consistent with the OI drop, long liquidations over the same period totaled $3.07 million, significantly higher than short liquidations of $228,950, reflecting the bullish hunt in HYPE derivatives. This long-biased liquidation has dropped the long-to-short ratio to 0.9037, which is below 1, indicating that more short positions are active in the market.
Will HYPE hold the 50-day EMA ground?
Hyperliquid slips below the 50-day EMA at $28.85 at press time on Wednesday, recording nearly 1% drop so far in the day. HYPE price crossing under the short-term moving average, which rests below the 200-day EMA at $32.75, reflects a strengthening bearish narrative.
A daily close below $28.85 would confirm the breakout, extending downside risk to the $23.58 support, which aligns with the December 21 low. Beyond this, a deeper support lies at $20.82, marked by the October 10 low.
The Moving Average Convergence Divergence (MACD) indicator has moved downward on the daily chart, showing a bearish crossover on Monday, with the negative histogram widening and suggesting increased bearish momentum. The Relative Strength Index (RSI) is at 48 on the same chart, extending the decline below the midline after being overbought last week. This indicates increased selling pressure with further room on the downside before reaching the oversold zone.
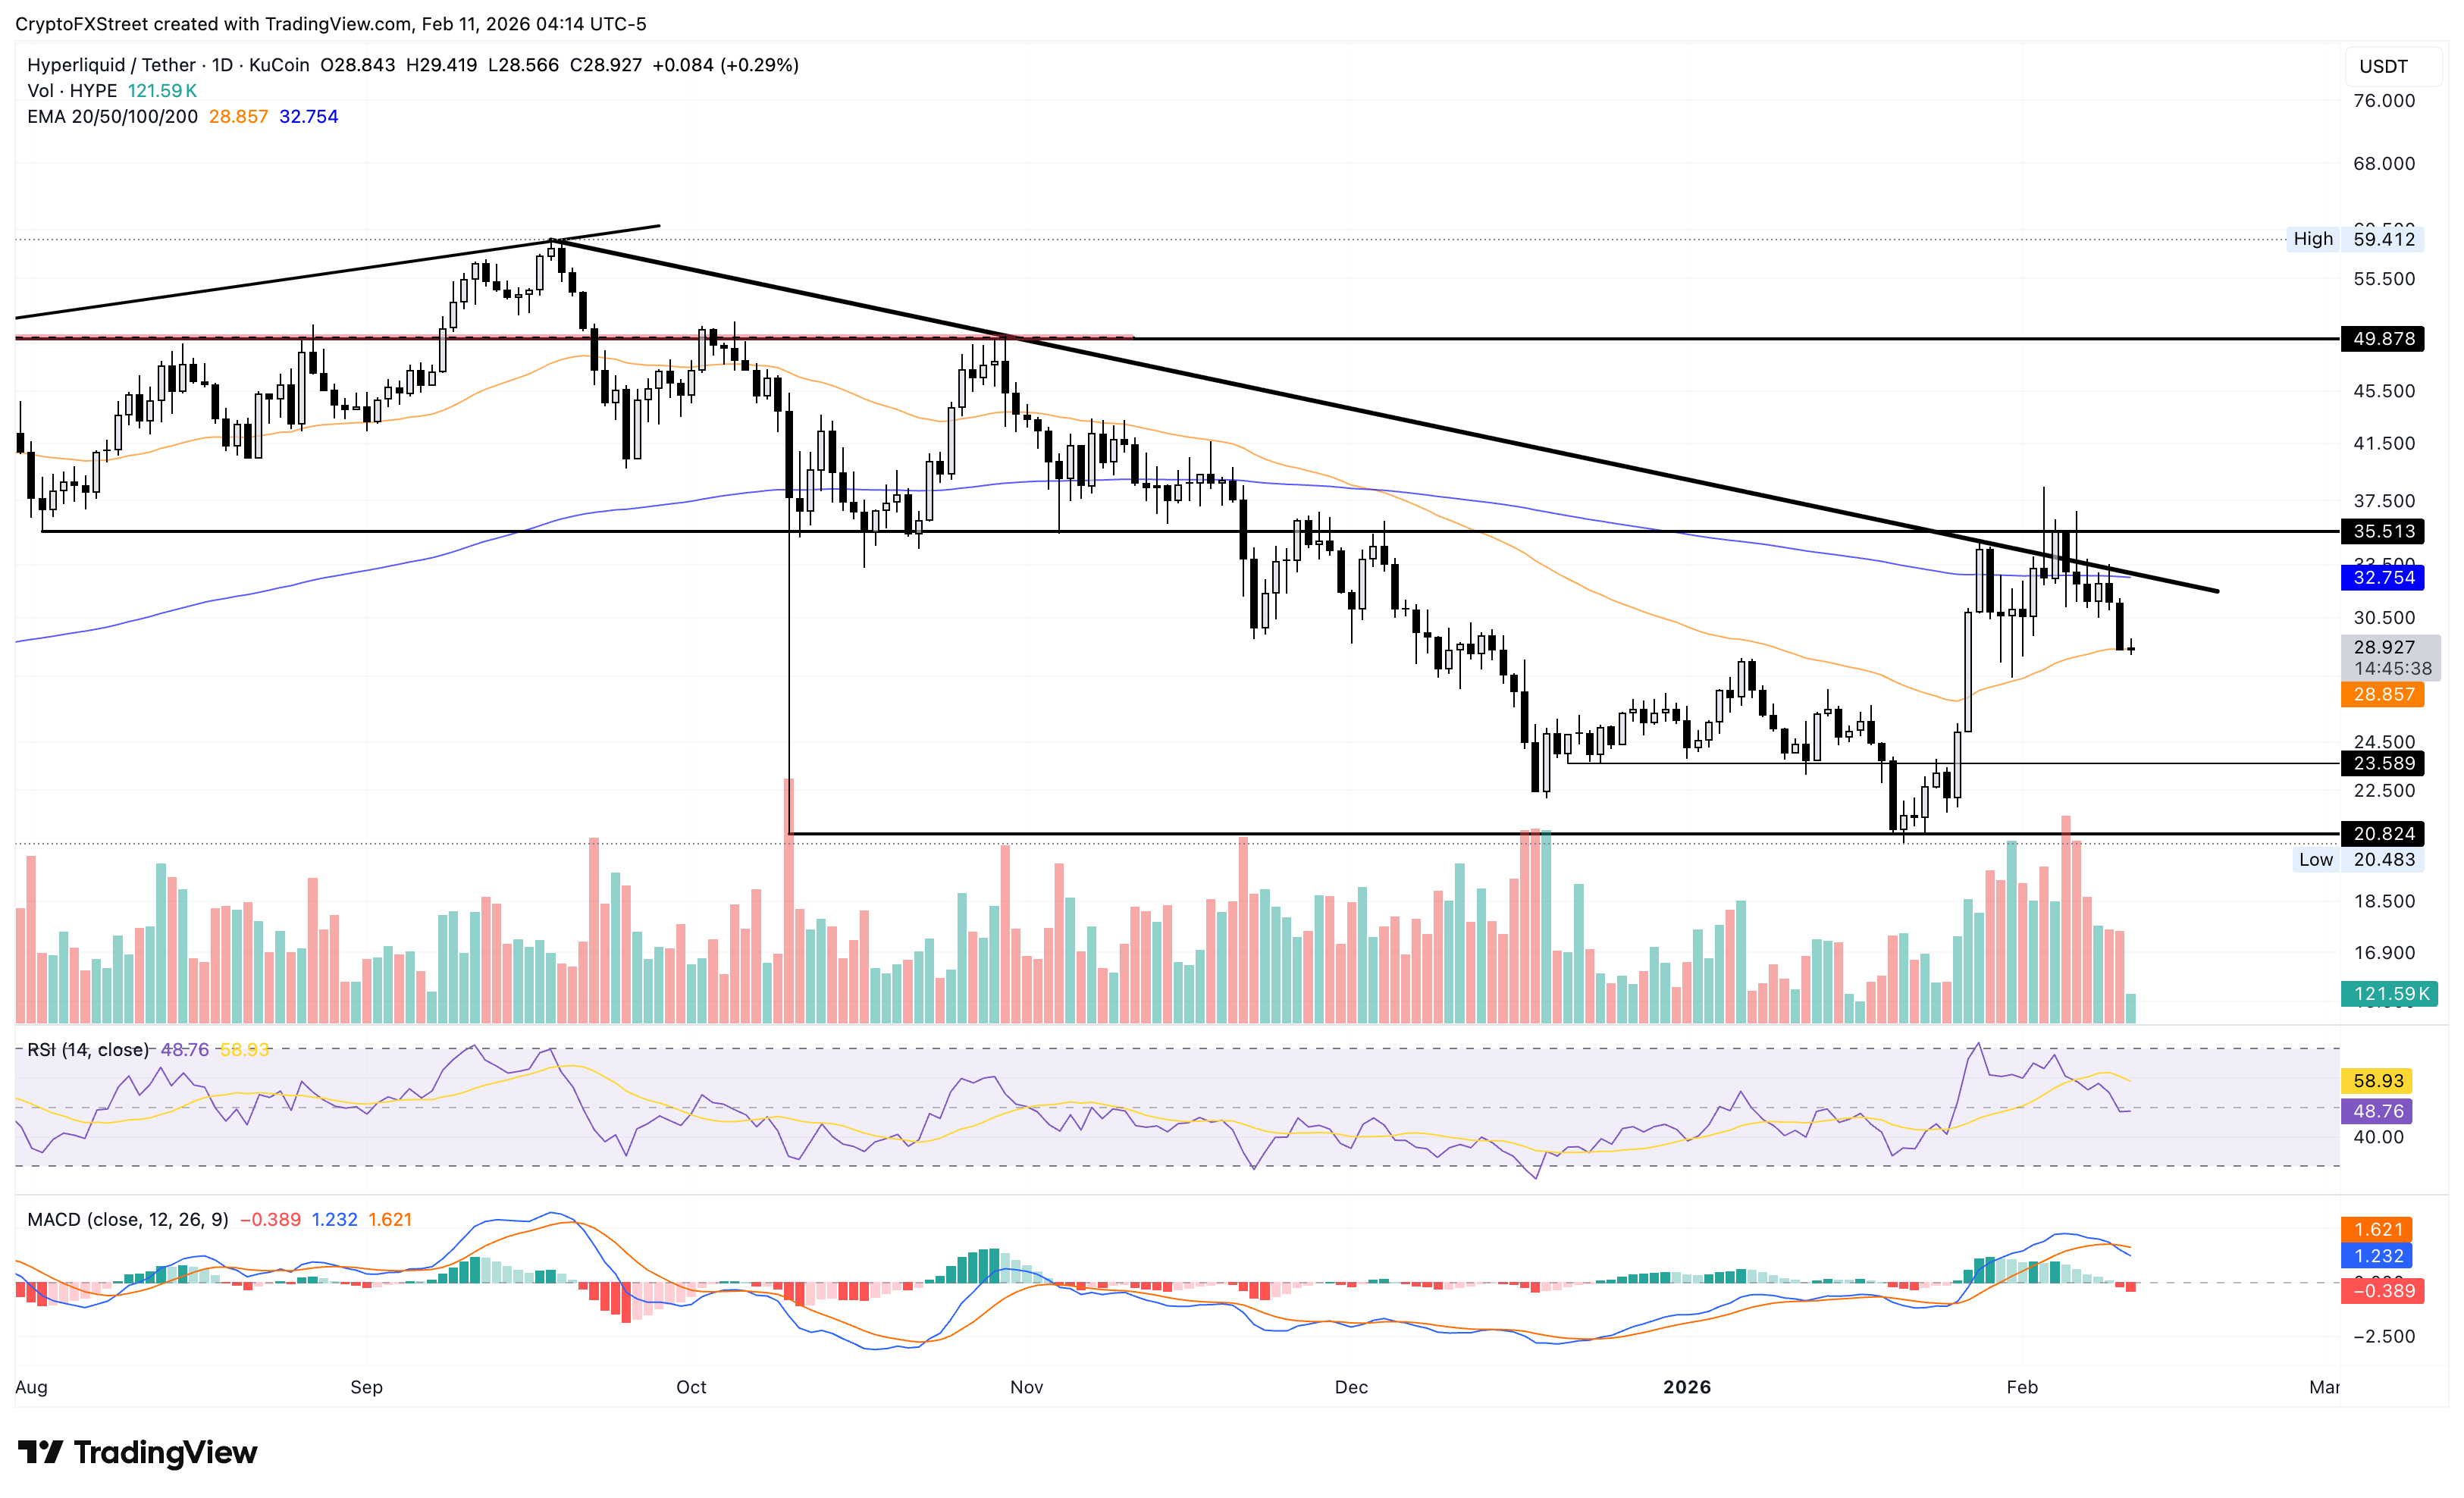
However, if HYPE secures a daily close above the 50-day EMA at $28.85, it would ease immediate pressure and could open a push toward the 200-day EMA at $32.75.

Lebih sejuta pengguna bergantung pada FXStreet untuk data pasaran masa nyata, alat carta, pandangan pakar dan berita Forex. Kalendar ekonomi yang komprehensif dan webinar pendidikan mereka membantu pedagang kekal bermaklumat dan membuat keputusan yang dikira. FXStreet disokong oleh pasukan kira-kira 60 profesional di ibu pejabat Barcelona dan pelbagai wilayah global.
Baca Lagi


