
Lido DAO Price Forecast: LDO tests breakout potential amid robust momentum indicators
Oleh John Isige
Dikemas kini: 15 Apr 2026


ARTIKEL POPULAR

Lido DAO (LDO) edges up above $0.37 at the time of writing on Wednesday, as crypto prices broadly recover. The liquid staking token (LST) is up over 8% on the day, supported by strong momentum indicators. Reclaiming the supply zone around $0.40 could increase the odds of a sustained recovery.
- Lido DAO extends its recovery above $0.37, aligning with the broader crypto market’s modest gains.
- LDO momentum steadies above the 50-day EMA with the MACD maintaining a buy signal and the RSI nearing overbought territory.
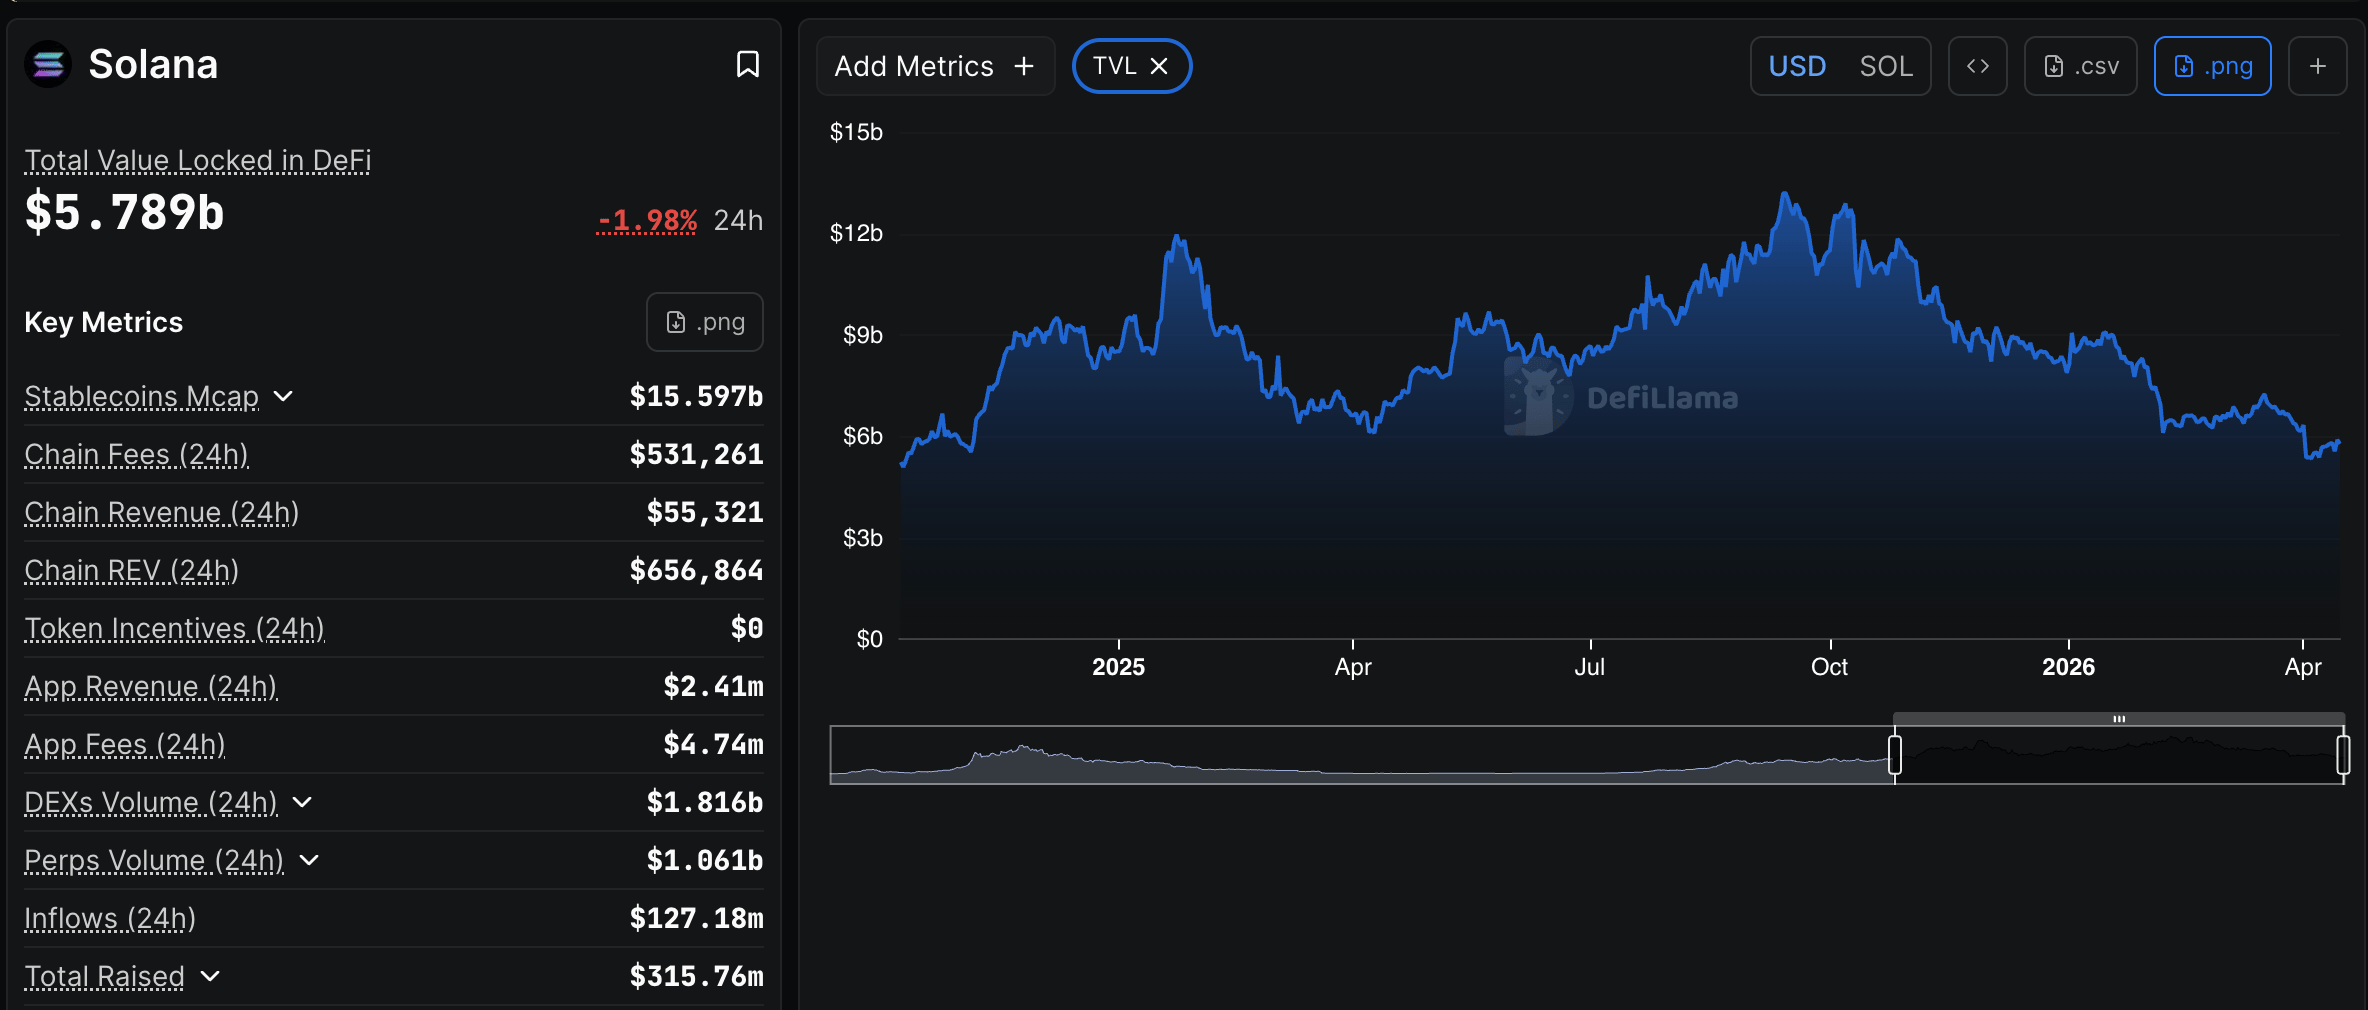
- Lido DAO’s DeFi TVL steadies at $22 billion, suggesting a cautious outlook among key holders.
Lido DAO (LDO) edges up above $0.37 at the time of writing on Wednesday, as crypto prices broadly recover. The liquid staking token (LST) is up over 8% on the day, supported by strong momentum indicators. Reclaiming the supply zone around $0.40 could increase the odds of a sustained recovery.
Lido DAO staking holds steady at $22 billion
Lido DAO’s Decentralized Finance (DeFi) total value locked (TVL), which tracks the notional value of all tokens locked across the protocol's smart contracts, remains above $22 billion on Wednesday. Prior to the current stability, DeFi Llama data shows that staking has gradually increased over the last two weeks, from $19.39 billion recorded on April 1.
The increase in DeFi TVL reflects protocol growth, which in turn boosts ecosystem liquidity, security and even revenue. It is fundamentally bullish, as investors lock their holdings into smart contracts, confirming high risk appetite and investor optimism for medium- to long-term price increases. Still, it's worth noting that the actual impact often lags TVL growth.
Technical outlook: Lido DAO breakout in focus
Lido DAO trades around $0.37, extending its rebound above the 50-day Exponential Moving Average (EMA) at $0.33 and shifting the near-term tone from neutral toward bullish. The staking token is pressing into the 61.8% Fibonacci retracement at $0.3771, which has been applied between the February high of $0.43 and the February 6 low of $0.29, where initial supply emerges.
Still, LDO trades well beneath the 100-day EMA at $0.40 and the higher Fibonacci retracements up to $0.43, which collectively cap the broader recovery. The Relative Strength Index near 66 on the daily chart hints at firm bullish momentum edging toward overbought conditions. A positive Moving Average Convergence Divergence (MACD) reading reinforces the upside bias as long as the price holds above reclaimed trend supports.
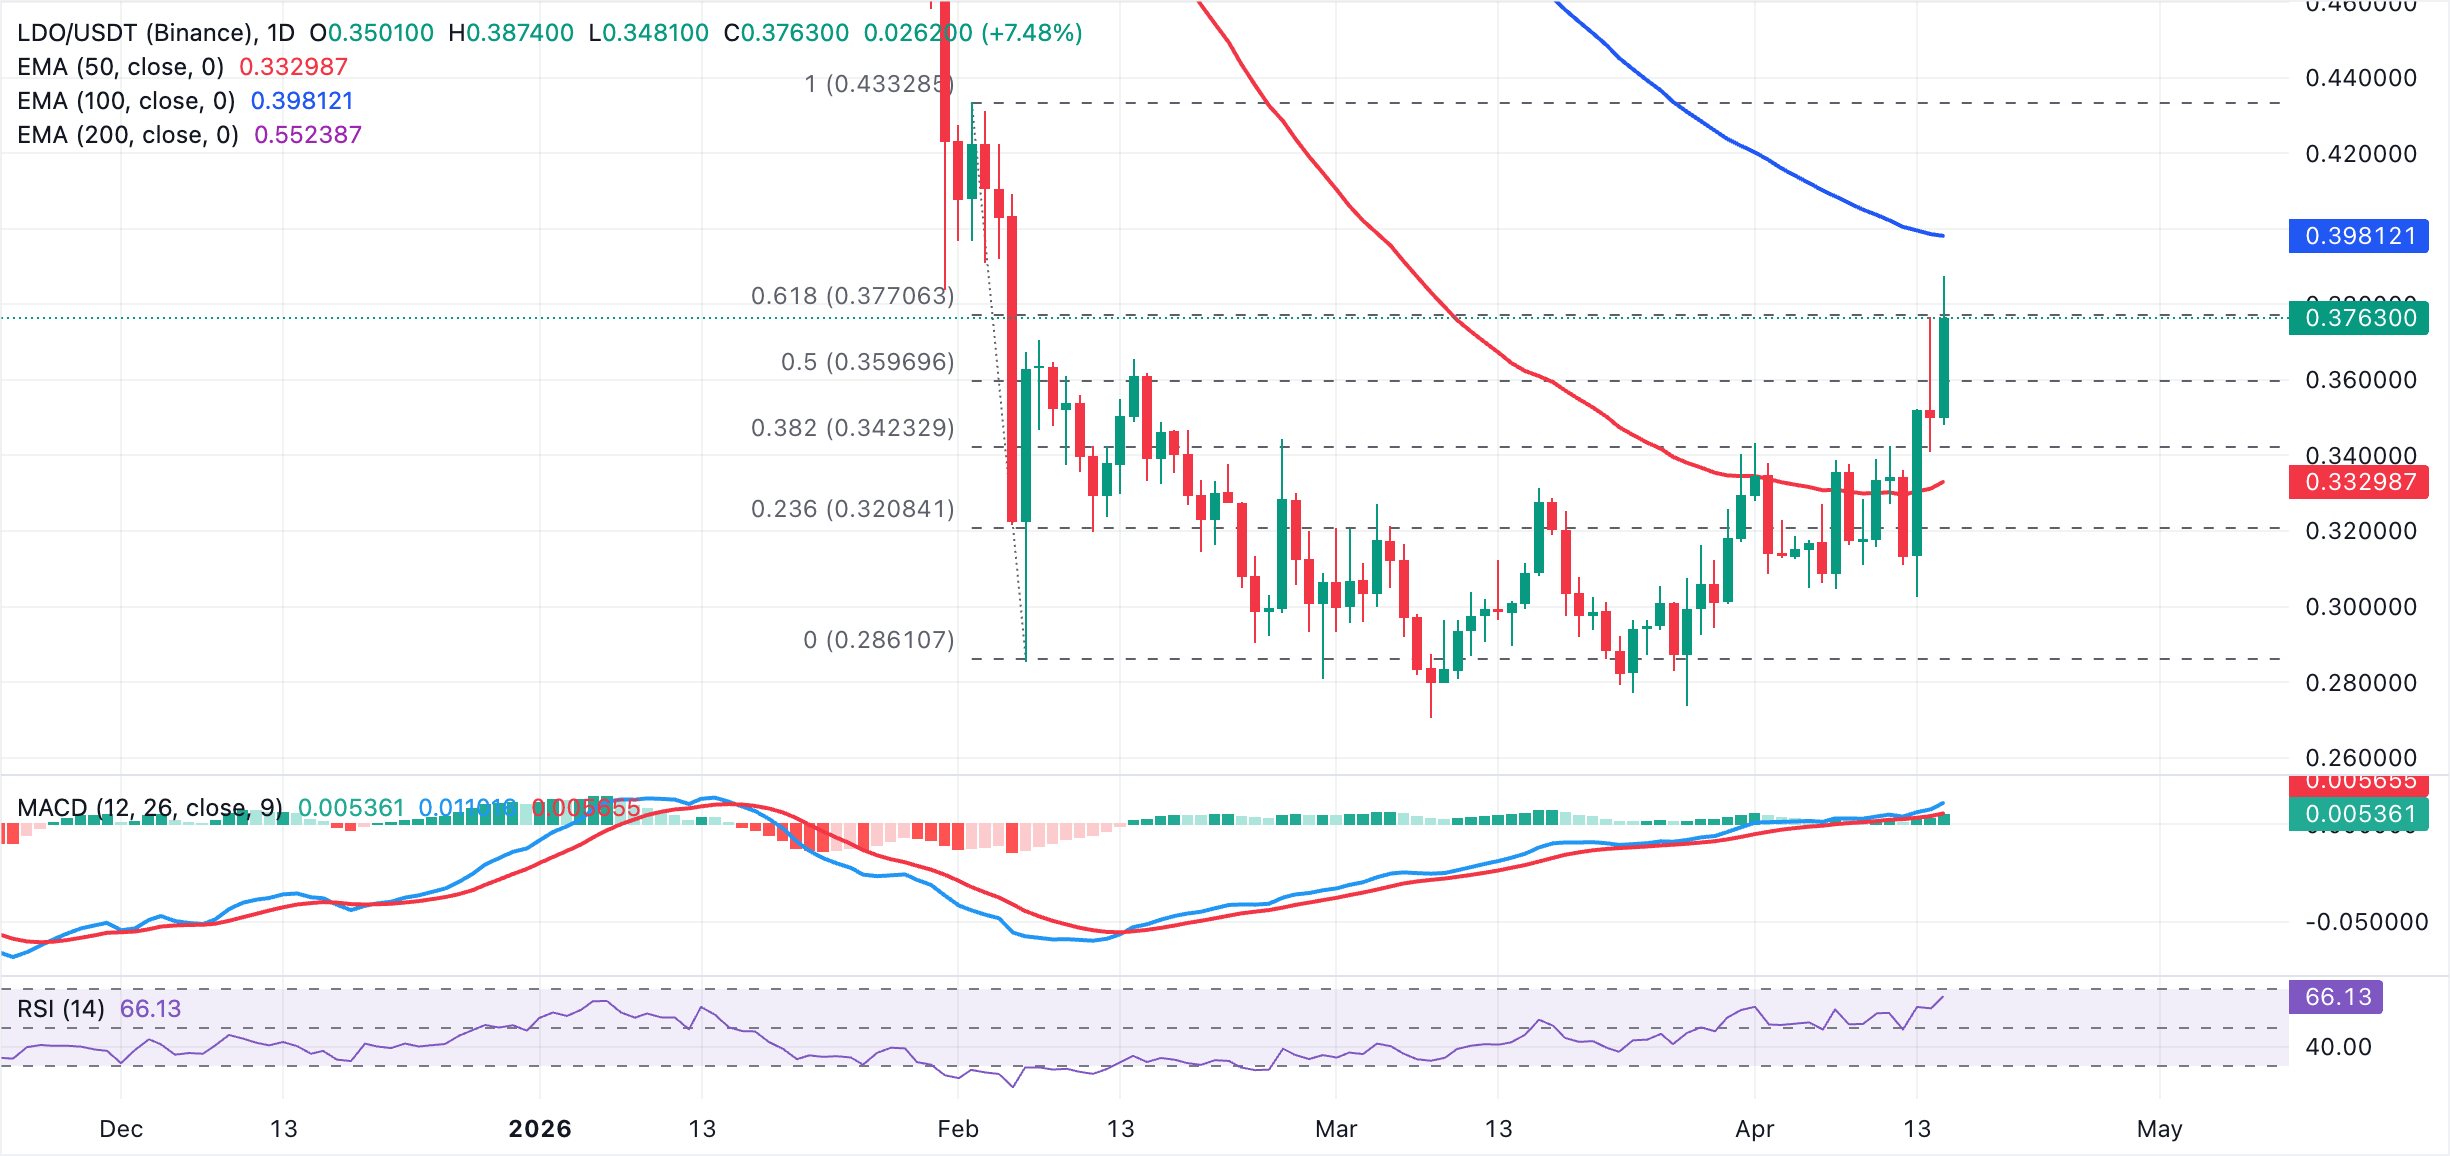
On the downside, first support is seen at the 50% Fibonacci retracement at $0.36, followed by the 38.2% retracement at $0.34 and the 50-day EMA at $0.33, which together define a key demand band before deeper support at $0.3208 and $0.2861. On the topside, a daily close above the nearby 61.8% Fibonacci level at $0.38 would open the way toward the 100-day EMA at $0.40, with the prior swing area around the 100% retracement at $0.43 as the next resistance objective.
Cryptocurrency metrics FAQs
The developer or creator of each cryptocurrency decides on the total number of tokens that can be minted or issued. Only a certain number of these assets can be minted by mining, staking or other mechanisms. This is defined by the algorithm of the underlying blockchain technology. On the other hand, circulating supply can also be decreased via actions such as burning tokens, or mistakenly sending assets to addresses of other incompatible blockchains.
Market capitalization is the result of multiplying the circulating supply of a certain asset by the asset’s current market value.
Trading volume refers to the total number of tokens for a specific asset that has been transacted or exchanged between buyers and sellers within set trading hours, for example, 24 hours. It is used to gauge market sentiment, this metric combines all volumes on centralized exchanges and decentralized exchanges. Increasing trading volume often denotes the demand for a certain asset as more people are buying and selling the cryptocurrency.
Funding rates are a concept designed to encourage traders to take positions and ensure perpetual contract prices match spot markets. It defines a mechanism by exchanges to ensure that future prices and index prices periodic payments regularly converge. When the funding rate is positive, the price of the perpetual contract is higher than the mark price. This means traders who are bullish and have opened long positions pay traders who are in short positions. On the other hand, a negative funding rate means perpetual prices are below the mark price, and hence traders with short positions pay traders who have opened long positions.
(The technical analysis of this story was written with the help of an AI tool.)

Lebih sejuta pengguna bergantung pada FXStreet untuk data pasaran masa nyata, alat carta, pandangan pakar dan berita Forex. Kalendar ekonomi yang komprehensif dan webinar pendidikan mereka membantu pedagang kekal bermaklumat dan membuat keputusan yang dikira. FXStreet disokong oleh pasukan kira-kira 60 profesional di ibu pejabat Barcelona dan pelbagai wilayah global.
Baca Lagi


