
NZD/USD Price Forecast: Holds losses near 0.5700, four-month lows
Oleh Akhtar Faruqui
Dikemas kini: 2 Apr 2026


ARTIKEL POPULAR

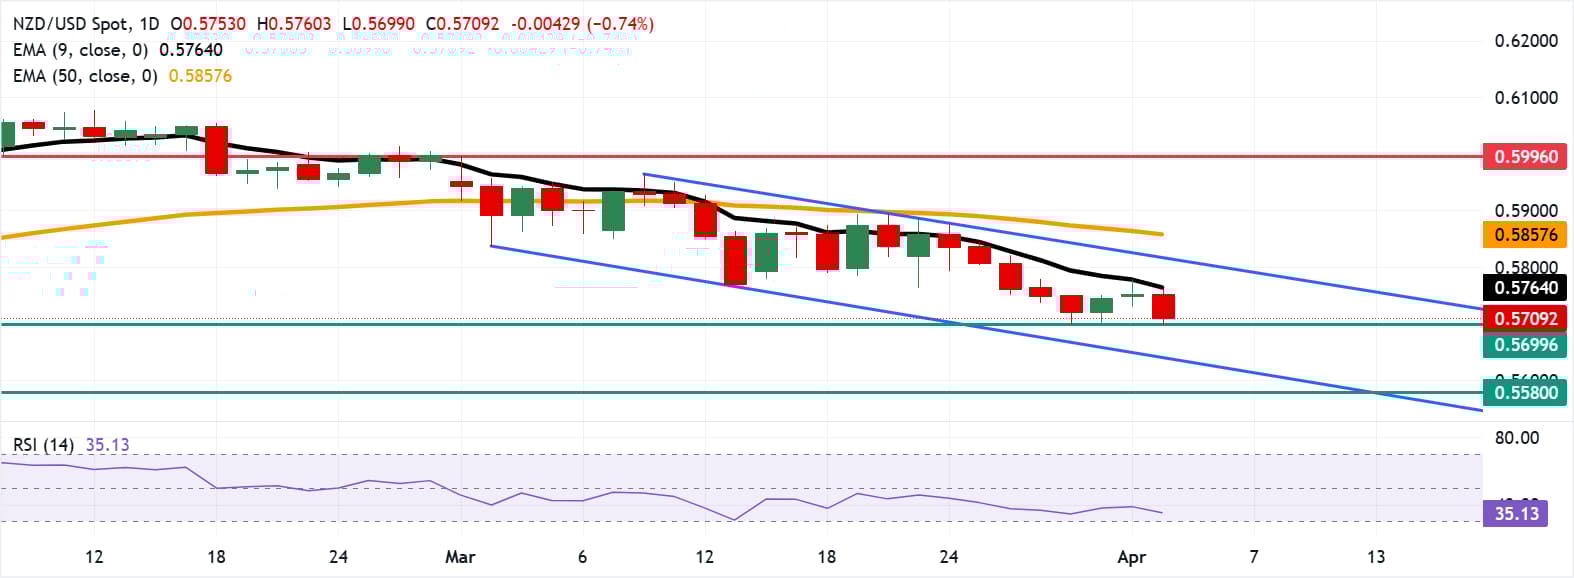
NZD/USD depreciates nearly 0.8% after two days of gains, trading around 0.5710 during the European hours on Thursday. The technical analysis of the daily chart signals a persistent bearish bias as the pair remains within a descending channel pattern.
- NZD/USD tests the immediate support at the four-month low of 0.5699.
- The 14-day Relative Strength Index at 35 remains below midline, indicating weak momentum.
- The immediate resistance lies at the nine-day EMA near 0.5764.
NZD/USD depreciates nearly 0.8% after two days of gains, trading around 0.5710 during the European hours on Thursday. The technical analysis of the daily chart signals a persistent bearish bias as the pair remains within a descending channel pattern.
The near-term bias is mildly bearish as the NZD/USD pair trades beneath the nine-day Exponential Moving Average (EMA), and the 50-day EMA has slipped, reinforcing a downside tilt after the recent sequence of lower closes.
The 14-day Relative Strength Index (RSI) at 35 stays below the midline and tracks a downbeat momentum backdrop, suggesting sellers retain control unless price can reclaim the short-term average on a daily close.
The NZD/USD pair is testing the immediate support at the four-month low of 0.5699, recorded on March 31, with additional downside support located near the lower boundary of the descending channel around 0.5640. A sustained move below the channel may expose the pair to further losses toward the region of the 11-month low near 0.5580, which was last seen in November 2025.
On the upside, immediate resistance is seen at the nine-day EMA near 0.5764, followed by the upper boundary of the descending channel around 0.5820, along with the 50-day moving average at 0.5857. A decisive break above this confluence resistance zone would shift the bias toward the upside and potentially open the door for a move toward the monthly high of 0.5996, recorded on March 2.
(The technical analysis of this story was written with the help of an AI tool.)
New Zealand Dollar Price Today
The table below shows the percentage change of New Zealand Dollar (NZD) against listed major currencies today. New Zealand Dollar was the weakest against the US Dollar.
| USD | EUR | GBP | JPY | CAD | AUD | NZD | CHF | |
|---|---|---|---|---|---|---|---|---|
| USD | 0.54% | 0.70% | 0.56% | 0.23% | 0.70% | 0.67% | 0.65% | |
| EUR | -0.54% | 0.16% | 0.00% | -0.32% | 0.17% | 0.15% | 0.10% | |
| GBP | -0.70% | -0.16% | -0.15% | -0.46% | 0.01% | 0.00% | -0.06% | |
| JPY | -0.56% | 0.00% | 0.15% | -0.33% | 0.14% | 0.11% | 0.07% | |
| CAD | -0.23% | 0.32% | 0.46% | 0.33% | 0.46% | 0.43% | 0.39% | |
| AUD | -0.70% | -0.17% | -0.01% | -0.14% | -0.46% | -0.03% | -0.10% | |
| NZD | -0.67% | -0.15% | -0.01% | -0.11% | -0.43% | 0.03% | -0.05% | |
| CHF | -0.65% | -0.10% | 0.06% | -0.07% | -0.39% | 0.10% | 0.05% |
The heat map shows percentage changes of major currencies against each other. The base currency is picked from the left column, while the quote currency is picked from the top row. For example, if you pick the New Zealand Dollar from the left column and move along the horizontal line to the US Dollar, the percentage change displayed in the box will represent NZD (base)/USD (quote).

Lebih sejuta pengguna bergantung pada FXStreet untuk data pasaran masa nyata, alat carta, pandangan pakar dan berita Forex. Kalendar ekonomi yang komprehensif dan webinar pendidikan mereka membantu pedagang kekal bermaklumat dan membuat keputusan yang dikira. FXStreet disokong oleh pasukan kira-kira 60 profesional di ibu pejabat Barcelona dan pelbagai wilayah global.
Baca Lagi


