
NZD/USD Price Forecast: Sinks towards the 200-day SMA, eyes on 0.5800
Oleh Christian Borjon Valencia
Tarikh Diterbitkan: 6 Mar 2026 | Tarikh Diubah: 6 Mar 2026


ARTIKEL POPULAR

The New Zealand Dollar (NZD) plummets during the North American session on Thursday as high US Treasury yields underpin the Greenback, which is registering a new two-day high as the Middle East conflict escalates.
- NZD/USD drops to 0.5878 as the US Dollar hits a two-day high.
- A daily close below 200-day SMA could expose 0.5815 and 0.5800.
- RSI turning bearish signals risk of deeper pullback toward 0.5737.
The New Zealand Dollar (NZD) plummets during the North American session on Thursday as high US Treasury yields underpin the Greenback, which is registering a new two-day high as the Middle East conflict escalates. NZD/USD trades at 0.588, down nearly 1% and slightly above the 200-day Simple Moving Average (SMA) at the time of writing.
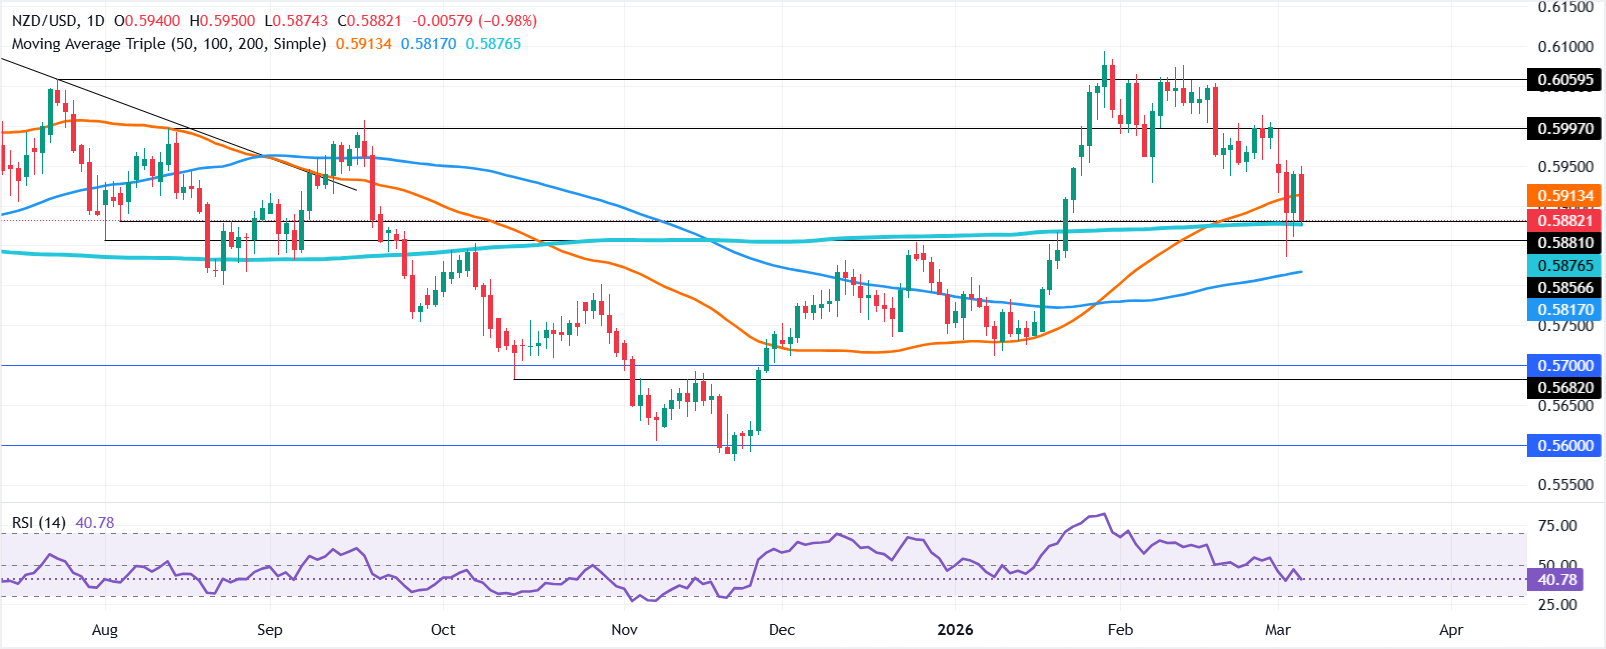
NZD/USD Price Forecast: Technical outlook
The technical picture shows some Kiwi Dollar weakness with the NZD/USD pair about to turn bearish if it ends daily below the 200-day SMA at 0.5876. In the last two days, the spot price has hovered around the latter. Still, buyers prevented sellers from winning the battle, which would open the door to test lower prices.
If NZD/USD finishes the day below the 200-day SMA, look for a test of the 100-day SMA at 0.5817. On further weakness, the next stop would be 0.5800, ahead of falling towards the January 19 swing low of 0.5741.
With the price action structure and momentum turning bearish, as indicated by the Relative Strength Index (RSI), it is important to closely monitor the NZD/USD daily close below the 200-day SMA.
NZD/USD Price Chart – Daily
New Zealand Dollar Price This week
The table below shows the percentage change of New Zealand Dollar (NZD) against listed major currencies this week. New Zealand Dollar was the strongest against the Swiss Franc.
| USD | EUR | GBP | JPY | CAD | AUD | NZD | CHF | |
|---|---|---|---|---|---|---|---|---|
| USD | 1.56% | 0.67% | 1.06% | 0.35% | 0.90% | 1.18% | 1.92% | |
| EUR | -1.56% | -0.88% | -0.49% | -1.19% | -0.66% | -0.36% | 0.35% | |
| GBP | -0.67% | 0.88% | 0.19% | -0.31% | 0.22% | 0.51% | 1.24% | |
| JPY | -1.06% | 0.49% | -0.19% | -0.65% | -0.10% | 0.24% | 0.89% | |
| CAD | -0.35% | 1.19% | 0.31% | 0.65% | 0.52% | 0.90% | 1.56% | |
| AUD | -0.90% | 0.66% | -0.22% | 0.10% | -0.52% | 0.29% | 1.02% | |
| NZD | -1.18% | 0.36% | -0.51% | -0.24% | -0.90% | -0.29% | 0.73% | |
| CHF | -1.92% | -0.35% | -1.24% | -0.89% | -1.56% | -1.02% | -0.73% |
The heat map shows percentage changes of major currencies against each other. The base currency is picked from the left column, while the quote currency is picked from the top row. For example, if you pick the New Zealand Dollar from the left column and move along the horizontal line to the US Dollar, the percentage change displayed in the box will represent NZD (base)/USD (quote).

Lebih sejuta pengguna bergantung pada FXStreet untuk data pasaran masa nyata, alat carta, pandangan pakar dan berita Forex. Kalendar ekonomi yang komprehensif dan webinar pendidikan mereka membantu pedagang kekal bermaklumat dan membuat keputusan yang dikira. FXStreet disokong oleh pasukan kira-kira 60 profesional di ibu pejabat Barcelona dan pelbagai wilayah global.
Baca Lagi


