
Pi Network Price Forecast: PI hits record low as market-wide risk-off sentiment weighs
- Pi Network is down 5% on Thursday, hitting a record low of $0.1186.
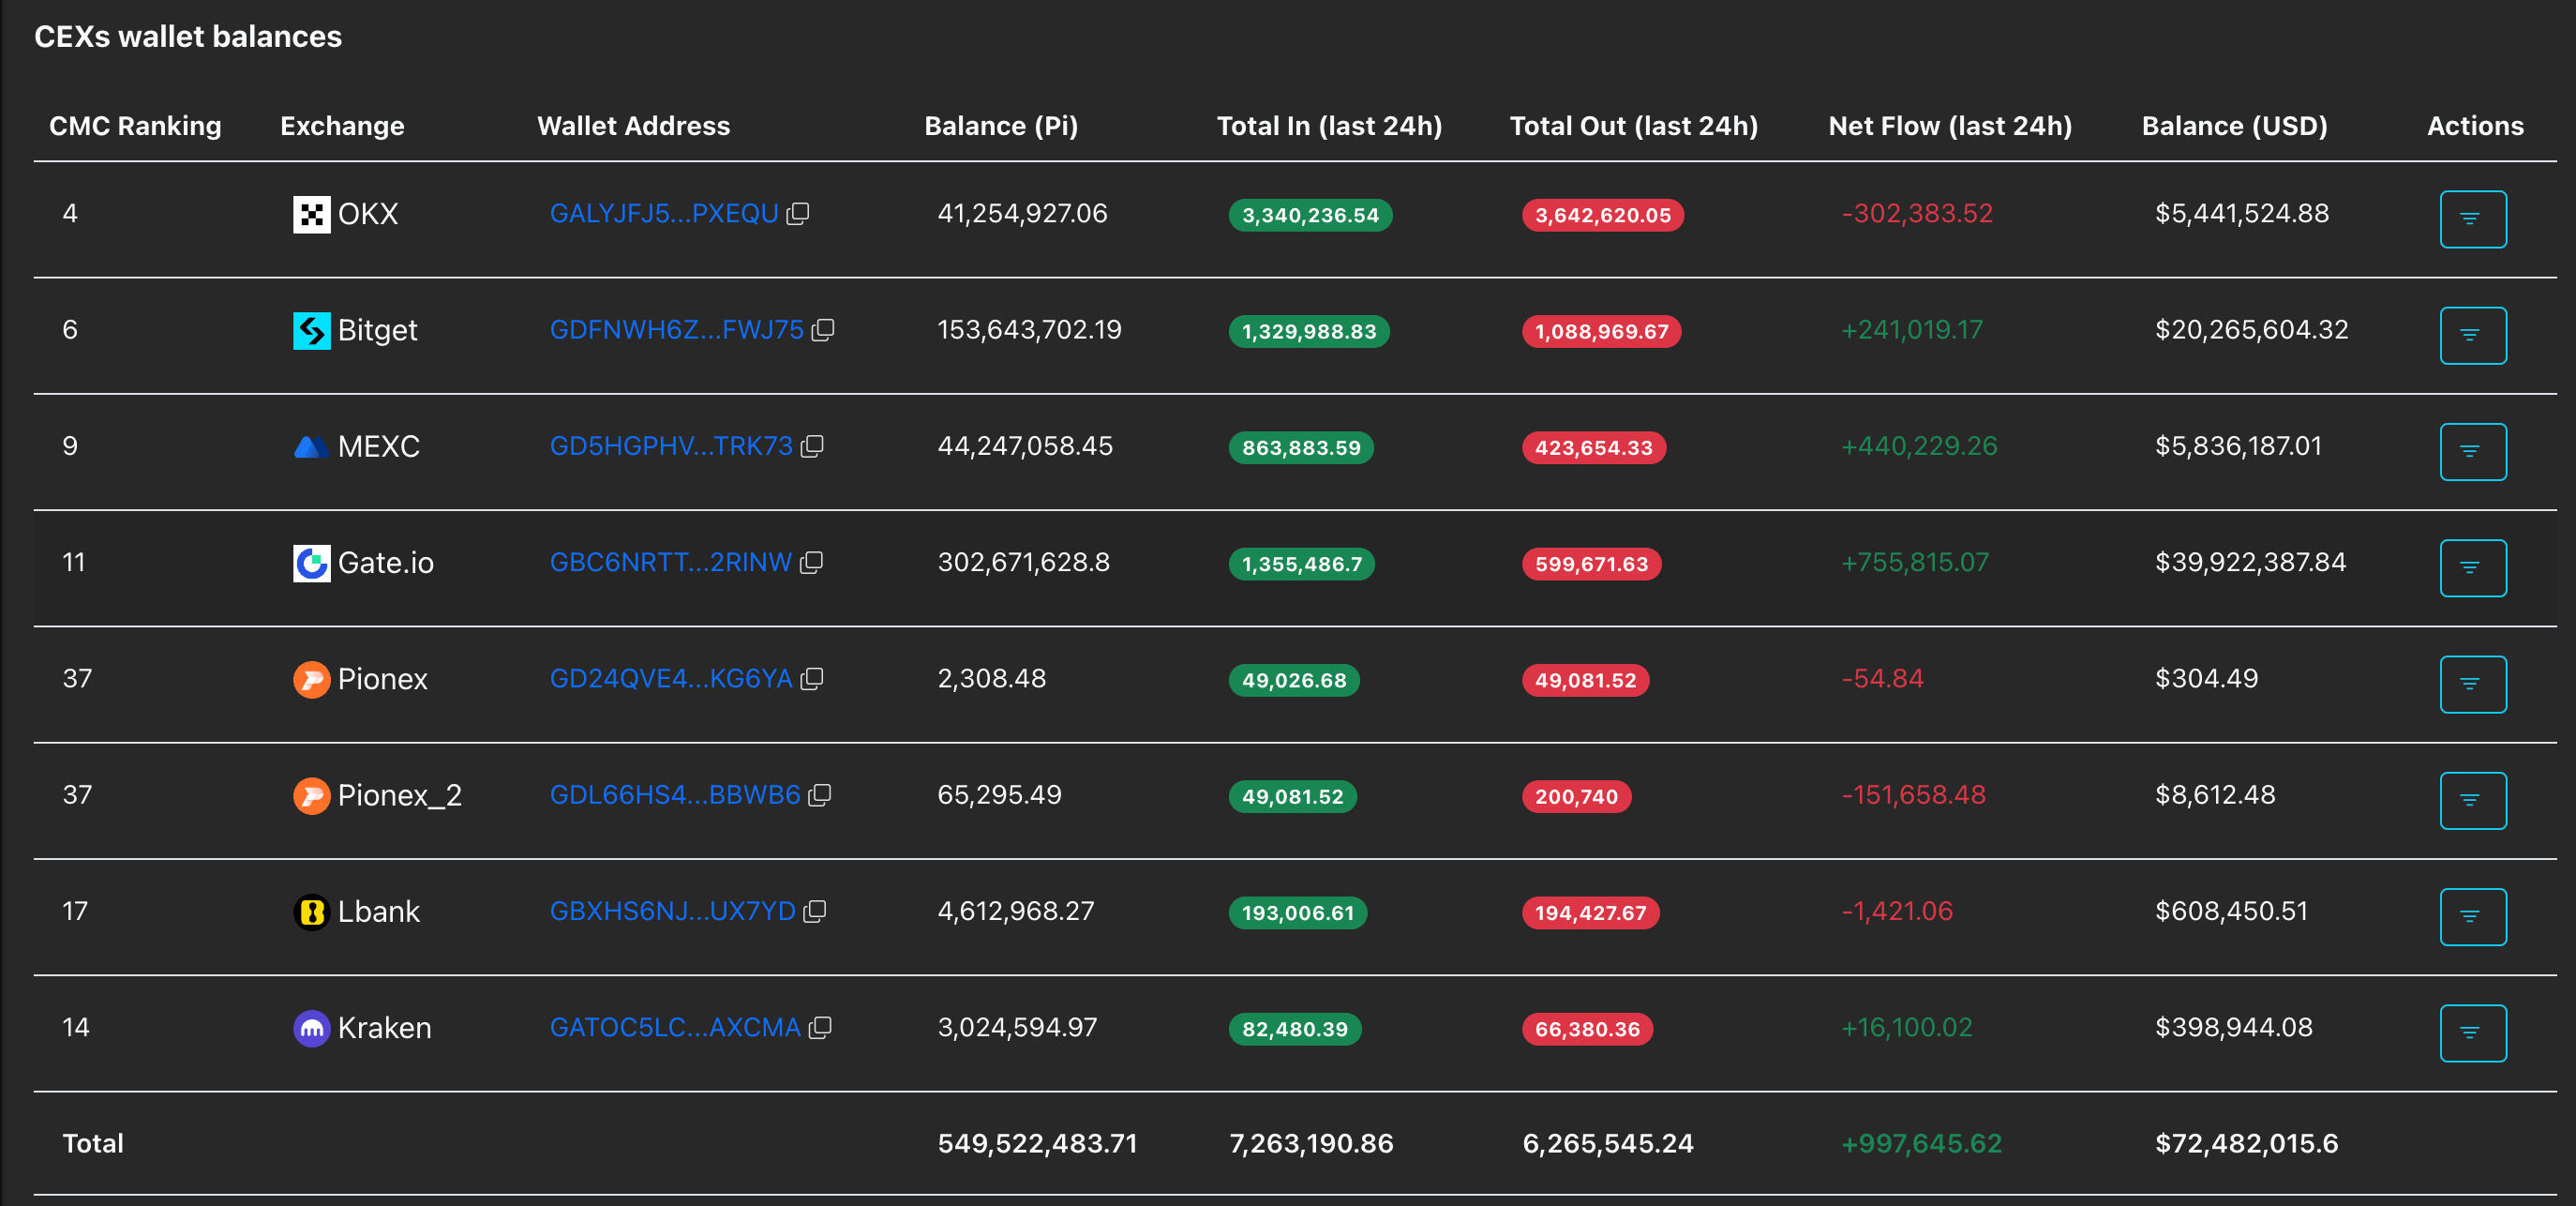
- CEX inflows of nearly 1 million PI tokens over the last 24 hours support concerns over increased selling.
- The technical outlook for PI is bearish, with the negative MACD profile suggesting sell-side dominance.
Pi Network (PI) price hovers around $0.1300 at press time on Thursday, reflecting a mild rebound from the $0.1186 record low reached earlier on the day. Deposits totaling roughly 1 million PI tokens on exchanges over the last 24 hours suggest waning investor confidence amid a broader market risk-off sentiment. Pi Network risks forming a lower leg closer to the $0.1000 psychological level amid firm bearish momentum.

Market sentiment weighs down PI token investors' confidence
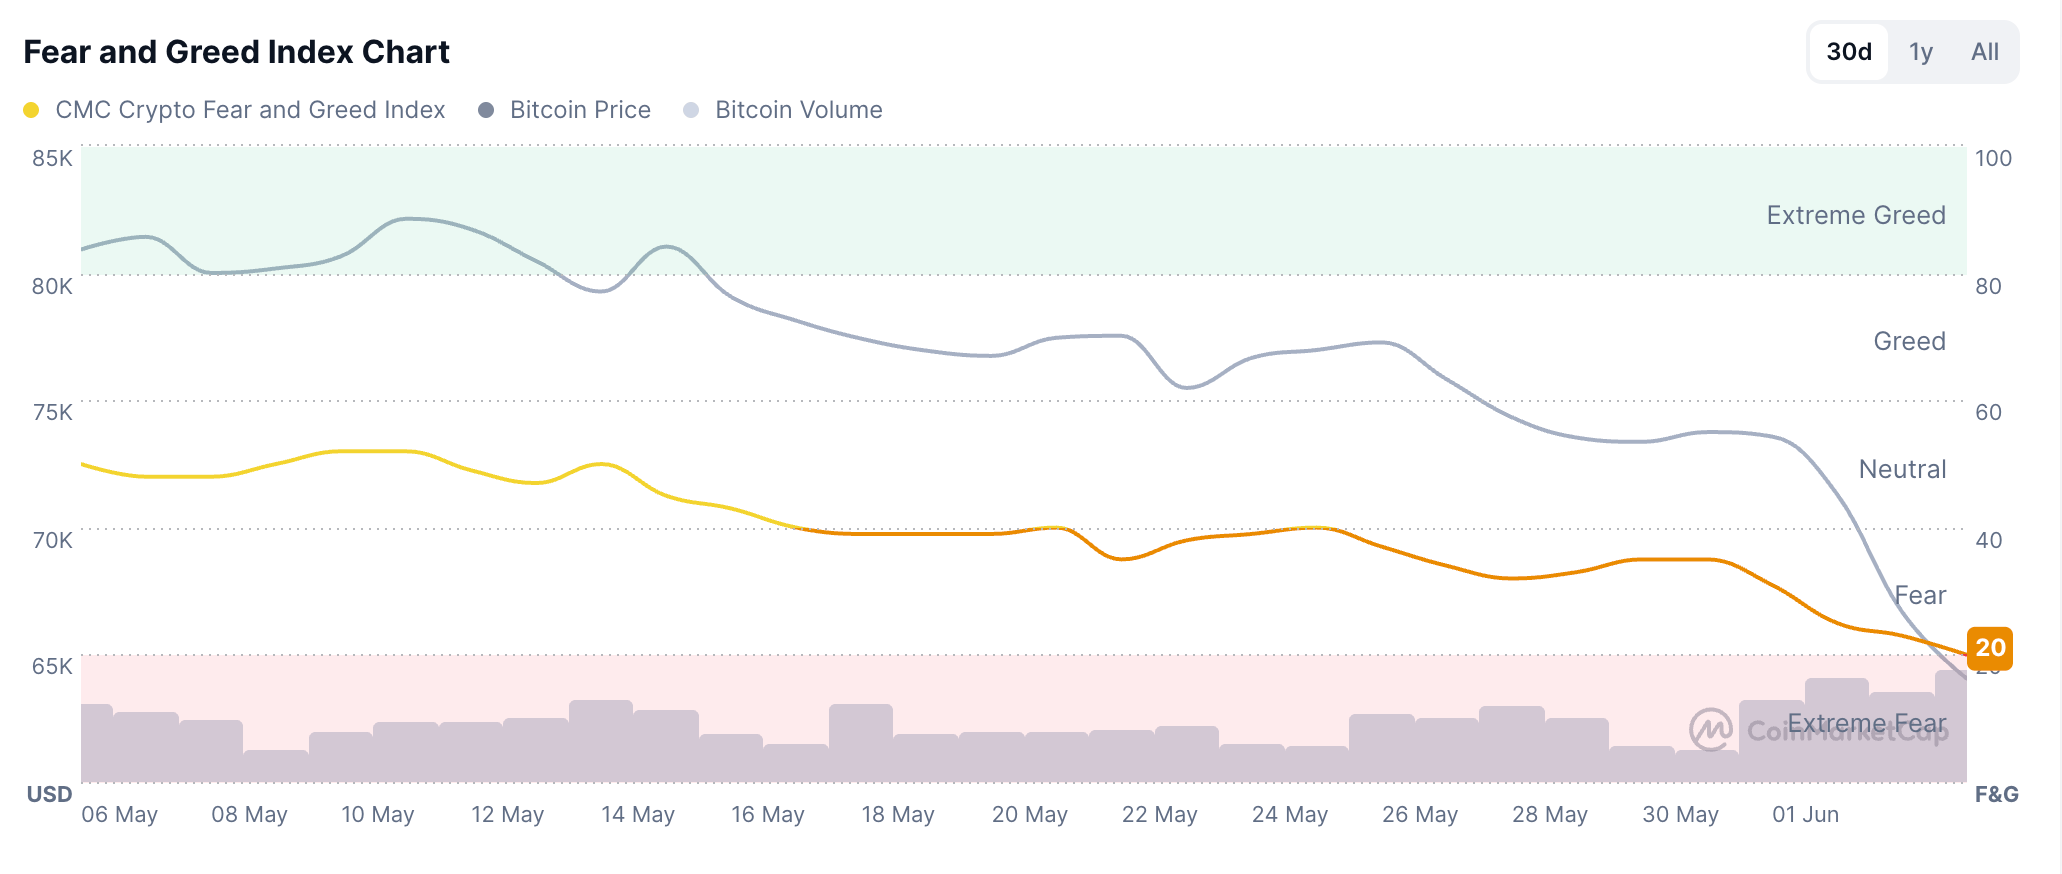
Pi Network's price hit a record low on Thursday, with Bitcoin (BTC) falling below $65,000, deteriorating the broader market sentiment. CoinMarketCap data shows the Crypto Fear and Greed Index down to 20 on Thursday, standing on the verge of flashing extreme fear in the market. The broader market sentiment largely dictates the PI token price trend, given its community-driven, speculative nature.
PiScan data reaffirms the declining investor confidence as fear grips the crypto market. Centralized Exchanges (CEXs) that support the PI token have recorded roughly 1 million PI tokens in deposits over the last 24 hours, which implies a profit-taking move.
Technical outlook: Will PI token drop to $0.10?
Pi Network edges lower on Thursday for the fourth consecutive day, maintaining a long-term declining trend under the influence of an overhead trendline. The PI token remains in a clear bearish phase well below the key 50-day Exponential Moving Average (EMA) around $0.1597, the 100-day EMA near $0.1710, and the 200-day EMA close to $0.2178, all acting as layered overhead supply and reinforcing a dominant downtrend.
That said, the Moving Average Convergence Divergence (MACD) sits below its signal line in the negative territory on the daily chart as the bearish histogram resurfaces, hinting at persistent downside pressure. Meanwhile, the Relative Strength Index (RSI) around 25 dives into the oversold territory, suggesting that although the sell-off is stretched, bearish control has yet to be meaningfully challenged.
Looking down, the intraday low of $0.1186 and the S2 Pivot Point $0.1124 serve as the immediate support levels, guarding the $0.1000 psychological level. A decisive close below this zone could target the S3 Pivot Point at $0.0836.
On the topside, initial resistance is seen near the descending trendline reference around $0.1525, with further barriers aligning at the 50-day EMA at $0.1597 and the 100-day EMA at $0.1711, levels that would need to be reclaimed to ease the current bearish grip.
(The technical analysis of this story was written with the help of an AI tool.)
Crypto ETF FAQs
An Exchange-Traded Fund (ETF) is an investment vehicle or an index that tracks the price of an underlying asset. ETFs can not only track a single asset, but a group of assets and sectors. For example, a Bitcoin ETF tracks Bitcoin’s price. ETF is a tool used by investors to gain exposure to a certain asset.
Yes. The first Bitcoin futures ETF in the US was approved by the US Securities & Exchange Commission in October 2021. A total of seven Bitcoin futures ETFs have been approved, with more than 20 still waiting for the regulator’s permission. The SEC says that the cryptocurrency industry is new and subject to manipulation, which is why it has been delaying crypto-related futures ETFs for the last few years.
Yes. The SEC approved in January 2024 the listing and trading of several Bitcoin spot Exchange-Traded Funds, opening the door to institutional capital and mainstream investors to trade the main crypto currency. The decision was hailed by the industry as a game changer.
The main advantage of crypto ETFs is the possibility of gaining exposure to a cryptocurrency without ownership, reducing the risk and cost of holding the asset. Other pros are a lower learning curve and higher security for investors since ETFs take charge of securing the underlying asset holdings. As for the main drawbacks, the main one is that as an investor you can’t have direct ownership of the asset, or, as they say in crypto, “not your keys, not your coins.” Other disadvantages are higher costs associated with holding crypto since ETFs charge fees for active management. Finally, even though investing in ETFs reduces the risk of holding an asset, price swings in the underlying cryptocurrency are likely to be reflected in the investment vehicle too.


