
Pi Network Price Forecast: PI recovery rally loses steam near crucial resistance
Oleh Vishal Dixit
Tarikh Diterbitkan: 19 Feb 2026 | Tarikh Diubah: 19 Feb 2026


ARTIKEL POPULAR
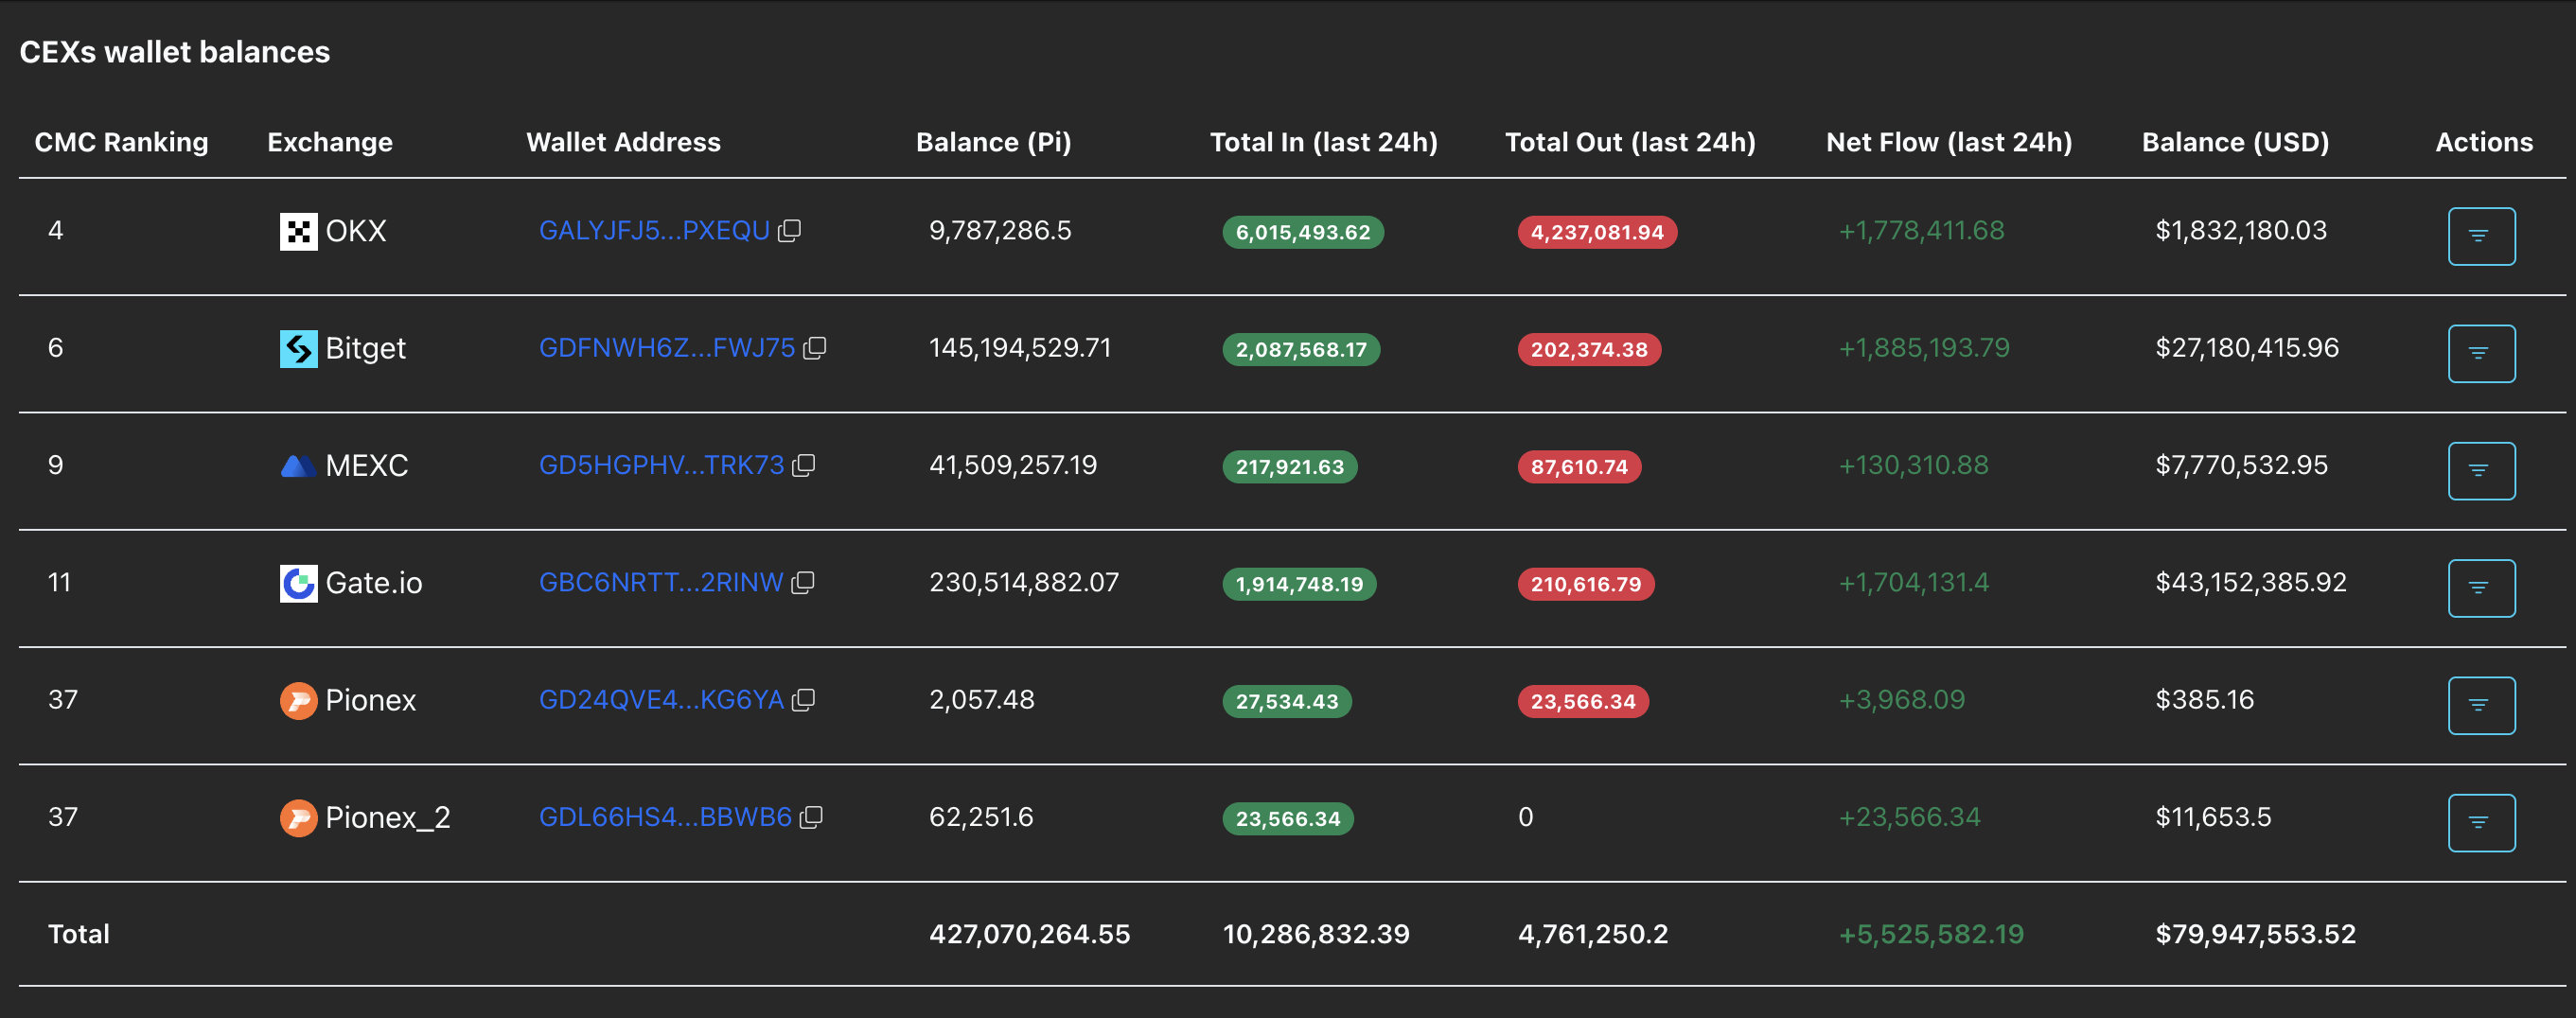
Pi Network (PI) edges higher near $0.1900 at press time on Thursday, approaching a crucial resistance level at $0.1919. However, large deposits exceeding 5.50 million PI tokens on Centralized Exchanges (CEXs) indicate a decline in investor confidence.
- Pi Network trades near $0.1900 on Thursday, extending gains above its 50-day EMA.
- PiScan data shows massive deposits of over 5.50 million PI tokens on exchanges, suggesting a profit-taking phase.
- The technical outlook for PI remains mixed, as the high-momentum recovery encounters a key resistance level.
Pi Network (PI) edges higher near $0.1900 at press time on Thursday, approaching a crucial resistance level at $0.1919. However, large deposits exceeding 5.50 million PI tokens on Centralized Exchanges (CEXs) indicate a decline in investor confidence. The technical outlook for PI remains mixed, as a key resistance level caps the recovery.
Large CEX deposits point to investors taking profits
PiScan data shows that 5.52 million PI tokens were deposited on Know-Your-Business-verified (KYB) CEXs over the last 24 hours, suggesting a massive profit-taking phase among PI token holders. This reduced investor confidence suggests that first-anniversary demand may already be priced in. If so, late entrants near the short-term cycle top could be trapped.
Pi Network: Will the PI token price exceed $0.20?
Pi Network is trading near $0.1900 at press time on Thursday, encountering resistance near the October 11 low at $0.1919, which previously served as a crucial support level in late October and December.
The short-term V-shaped recovery in Pi token prices struggles to reclaim this level and risks a bearish reversal. If Pi Network falls below the 50-day Exponential Moving Average (EMA) at $0.1776, it would confirm a top formation and risk a decline to the $0.1533 support, aligning with the October 10 low.
The Relative Strength Index (RSI) at 62 on the daily chart shows a steady recovery, suggesting increased buying pressure still below the overbought zone. At the same time, the Moving Average Convergence Divergence (MACD) and its signal line have extended the upward trend since Friday’s crossover, alongside successively rising bullish histogram bars, indicating a consistent increase in bullish momentum.
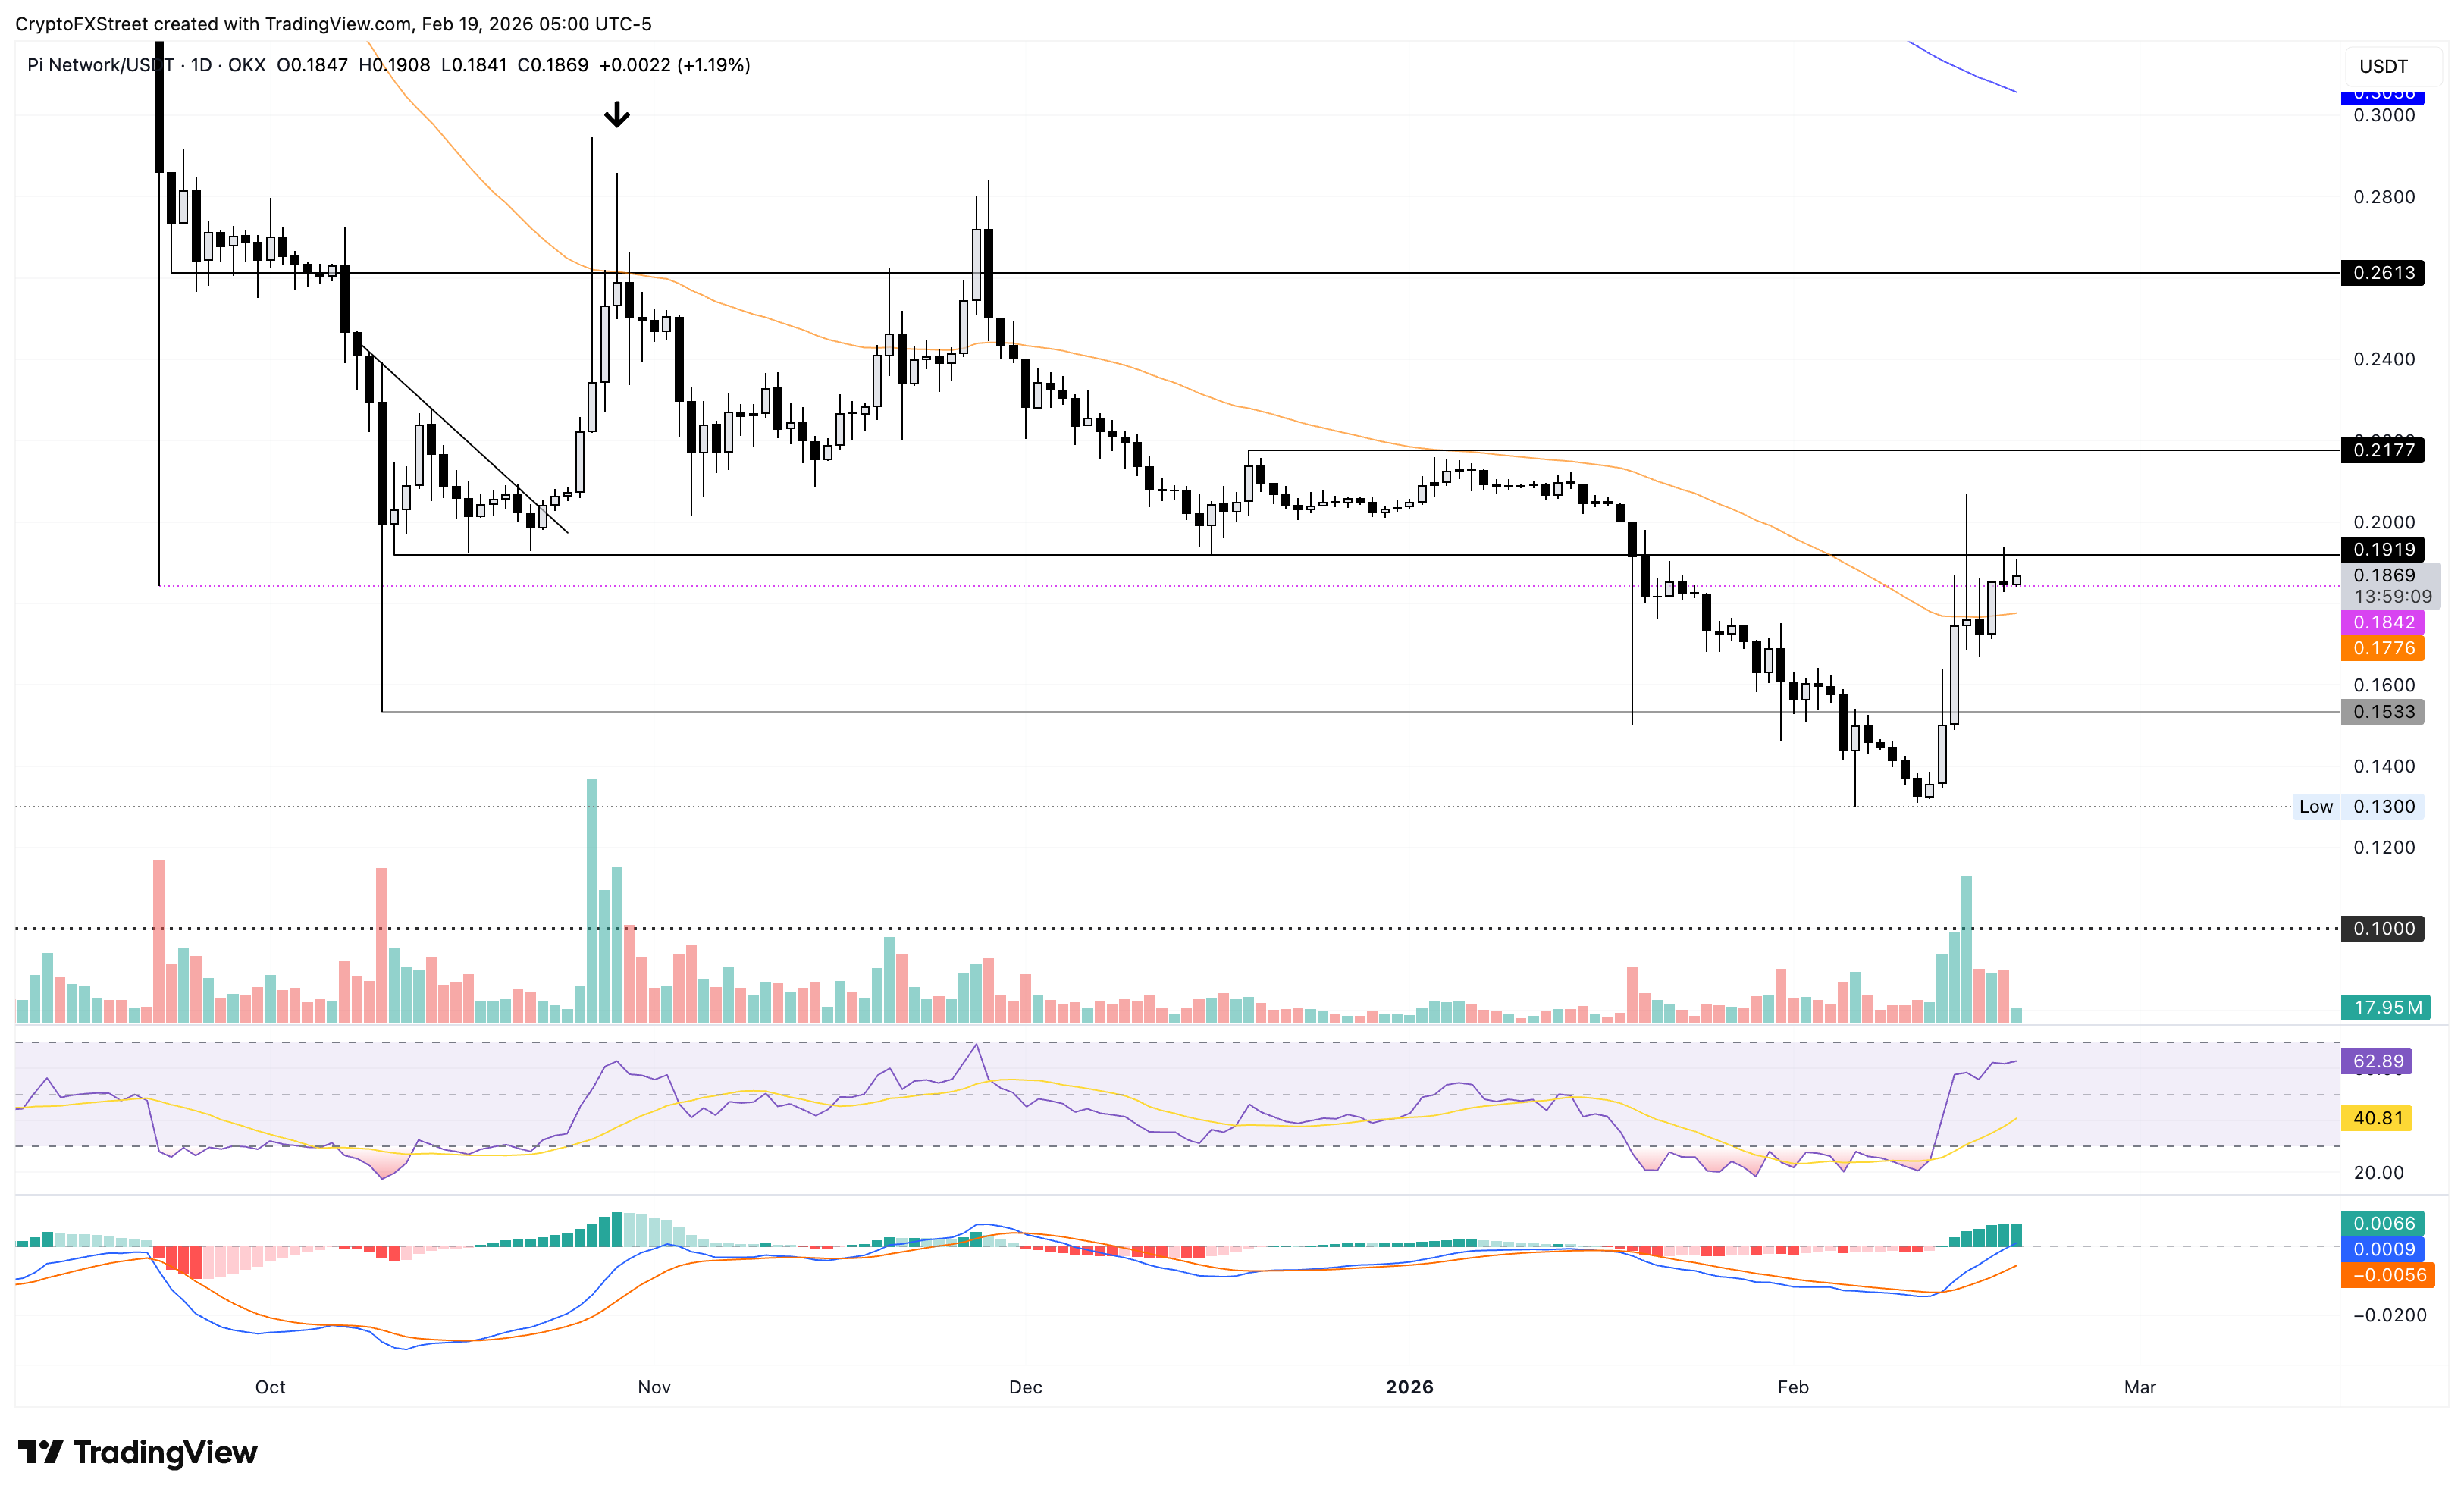
To further extend the recovery, the Pi token must achieve a decisive daily close above $0.1919, which would open the door toward the December 19 high at $0.2177.
Bitcoin, altcoins, stablecoins FAQs
Bitcoin is the largest cryptocurrency by market capitalization, a virtual currency designed to serve as money. This form of payment cannot be controlled by any one person, group, or entity, which eliminates the need for third-party participation during financial transactions.
Altcoins are any cryptocurrency apart from Bitcoin, but some also regard Ethereum as a non-altcoin because it is from these two cryptocurrencies that forking happens. If this is true, then Litecoin is the first altcoin, forked from the Bitcoin protocol and, therefore, an “improved” version of it.
Stablecoins are cryptocurrencies designed to have a stable price, with their value backed by a reserve of the asset it represents. To achieve this, the value of any one stablecoin is pegged to a commodity or financial instrument, such as the US Dollar (USD), with its supply regulated by an algorithm or demand. The main goal of stablecoins is to provide an on/off-ramp for investors willing to trade and invest in cryptocurrencies. Stablecoins also allow investors to store value since cryptocurrencies, in general, are subject to volatility.
Bitcoin dominance is the ratio of Bitcoin's market capitalization to the total market capitalization of all cryptocurrencies combined. It provides a clear picture of Bitcoin’s interest among investors. A high BTC dominance typically happens before and during a bull run, in which investors resort to investing in relatively stable and high market capitalization cryptocurrency like Bitcoin. A drop in BTC dominance usually means that investors are moving their capital and/or profits to altcoins in a quest for higher returns, which usually triggers an explosion of altcoin rallies.

Lebih sejuta pengguna bergantung pada FXStreet untuk data pasaran masa nyata, alat carta, pandangan pakar dan berita Forex. Kalendar ekonomi yang komprehensif dan webinar pendidikan mereka membantu pedagang kekal bermaklumat dan membuat keputusan yang dikira. FXStreet disokong oleh pasukan kira-kira 60 profesional di ibu pejabat Barcelona dan pelbagai wilayah global.
Baca Lagi


