
Ripple Price Forecast: XRP exhibits mild bullish strength as risk appetite anchors ETF inflows
Oleh John Isige
Dikemas kini: 20 Apr 2026


ARTIKEL POPULAR

Ripple (XRP) edges up above $1.42 at the time of writing on Monday, following two consecutive days of price correcting from last week’s high of $1.47. A strong support level appears to be forming at the broken resistance around $1.40, increasing the odds of a steady rebound.
- XRP extends its rebound above $1.42, reflecting improving sentiment in the broader crypto market.
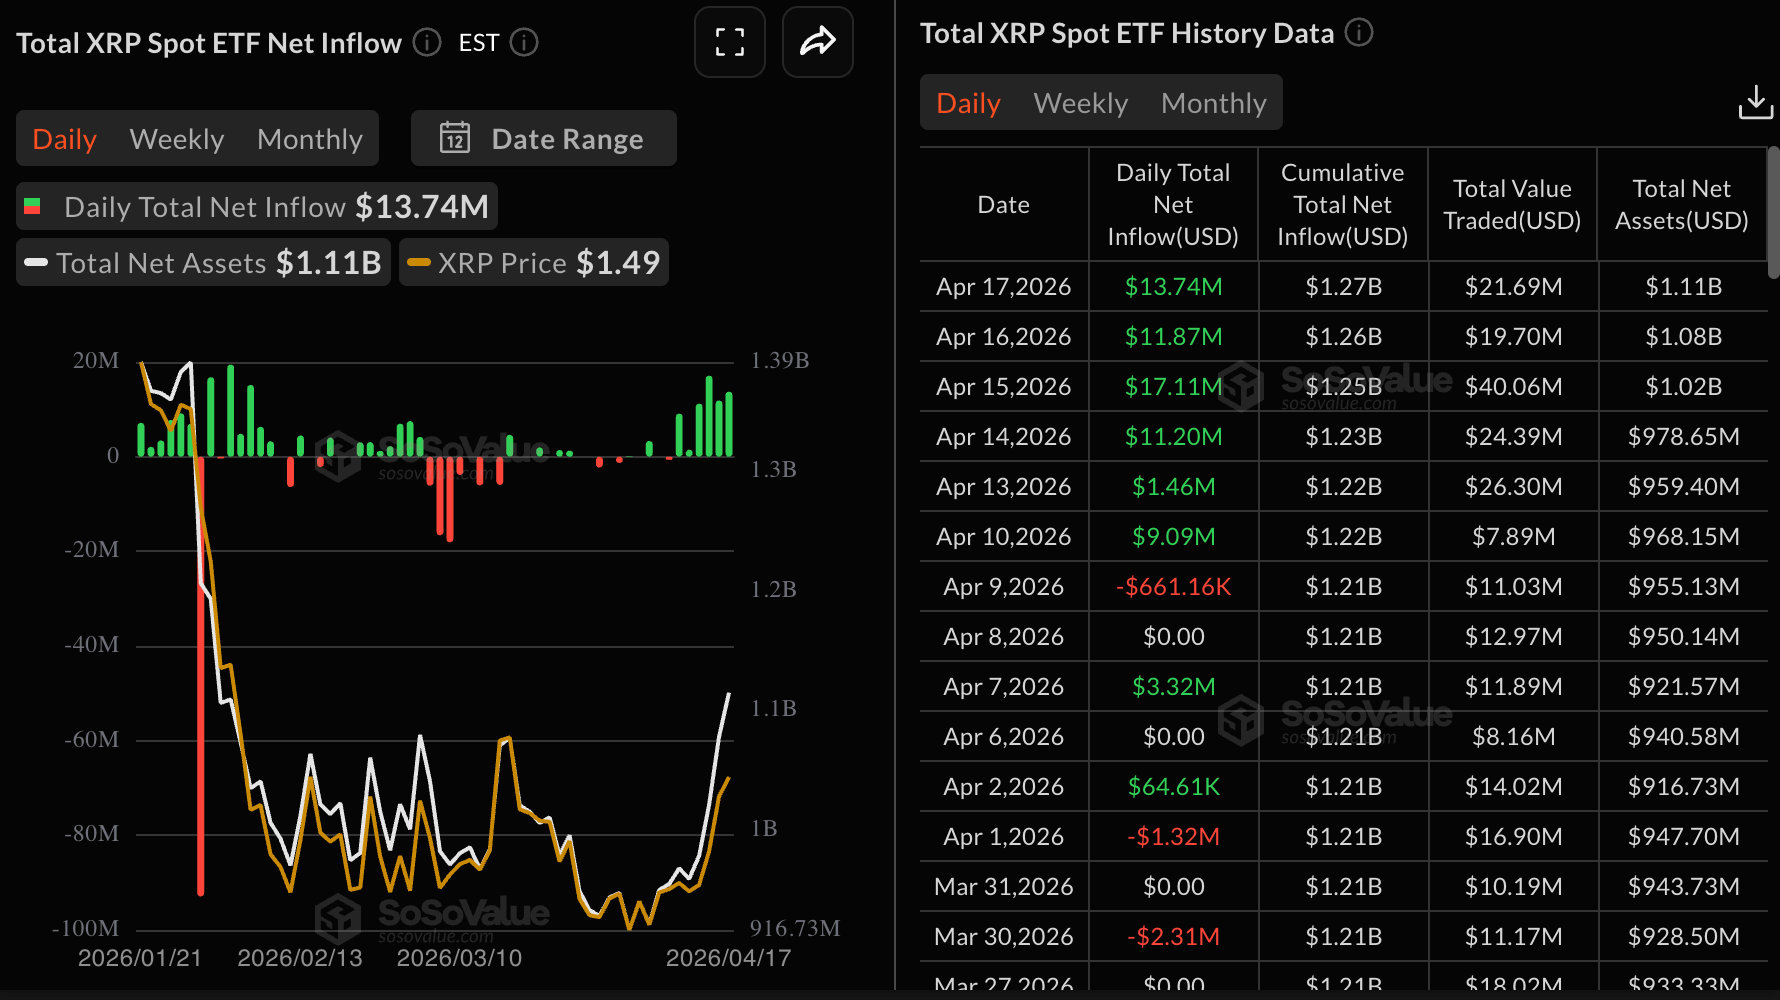
- Interest in spot XRP ETFs extended for the sixth consecutive day, with inflows totaling $14 million on Friday.
- The 50-day EMA serves as immediate support at $1.41, while momentum indicators maintain a neutral-to-bullish bias.
Ripple (XRP) edges up above $1.42 at the time of writing on Monday, following two consecutive days of price correcting from last week’s high of $1.47. A strong support level appears to be forming at the broken resistance around $1.40, increasing the odds of a steady rebound.
XRP steady amid ETF inflows
XRP spot Exchange-Traded Funds (ETFs) extended their bullish streak for the sixth consecutive day with nearly $14 million in inflows on Friday. Cumulative inflows reached $1.27 billion on Friday, with net assets under management averaging $1.11 billion. The steady risk appetite aligns with the improving sentiment and XRP’s growing recovery potential.
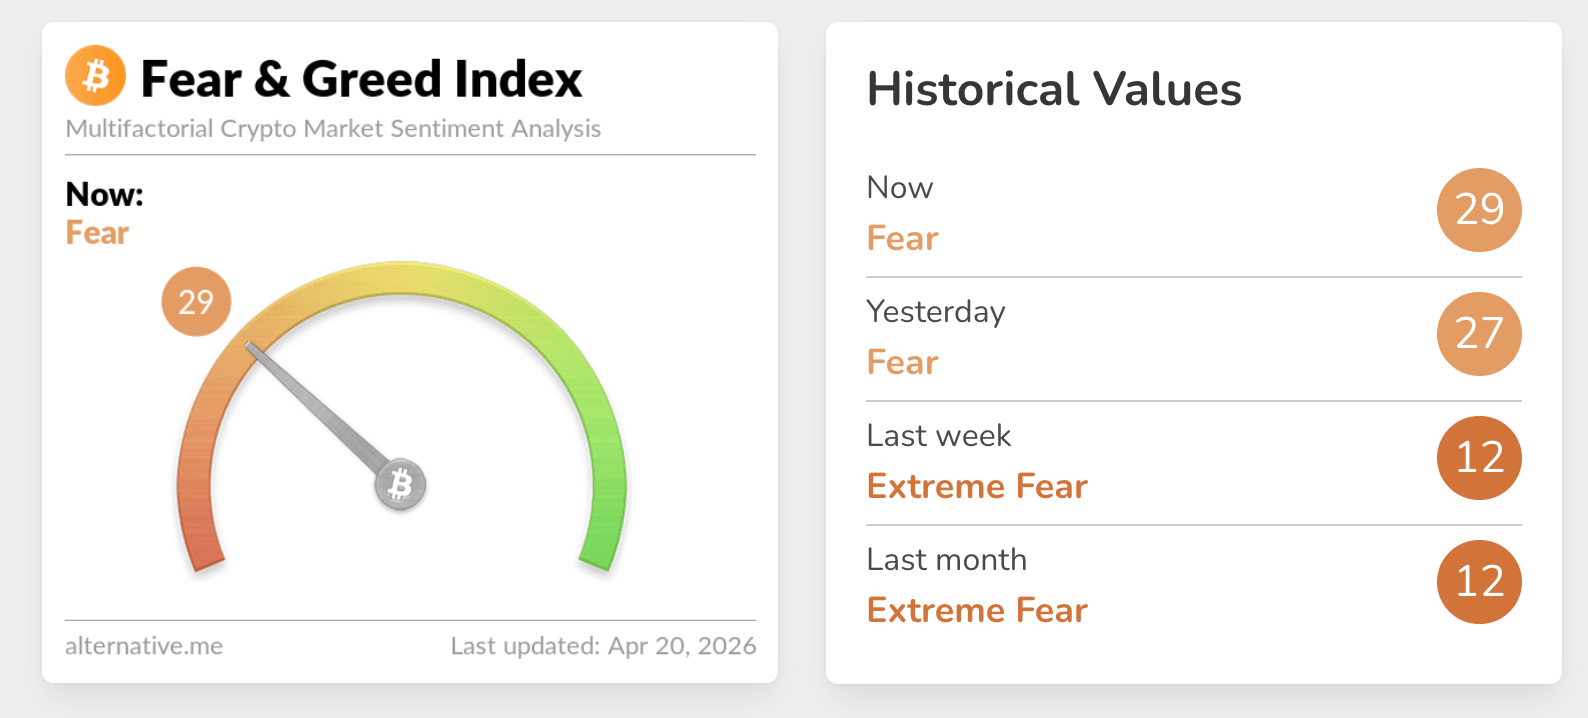
Market sentiment across the cryptocurrency landscape continues to recover, prompting increased investor participation, particularly in the ETF segment. The crypto Fear & Greed Index holds at 29 on Monday, advancing from last week’s extreme fear reading of 12.
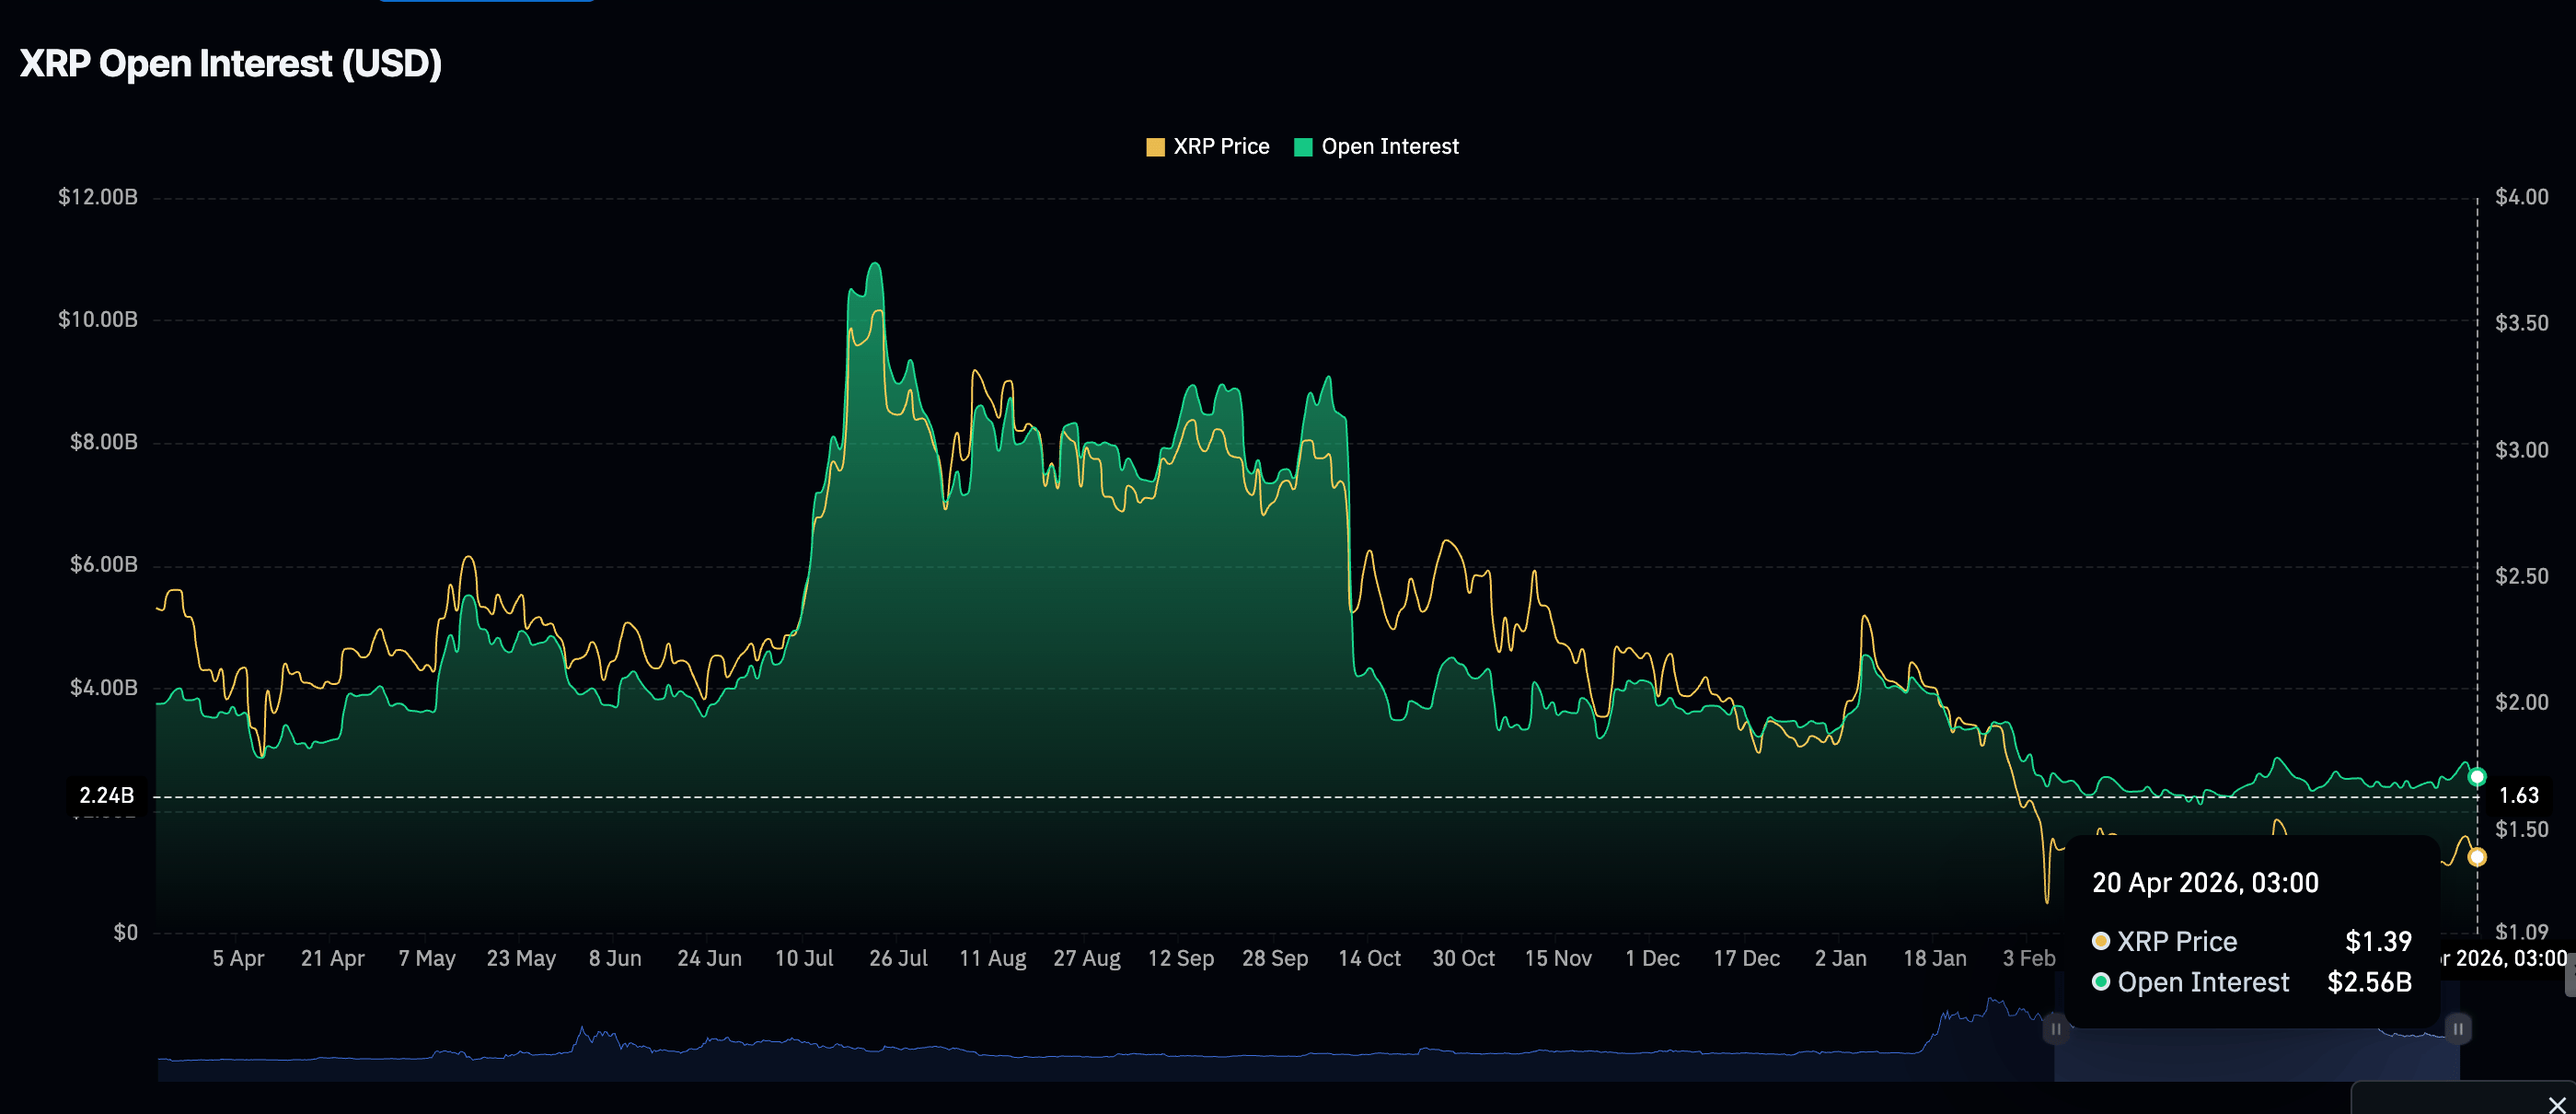
Meanwhile, after the recent growth in the XRP derivatives market, which pushed futures Open Interest (OI) to $2.80 billion on Saturday, CoinGlass data shows that OI is cooling, averaging $2.56 billon on Monday. Hence, if a risk-off mood becomes dominant and OI keeps falling, XRP recovery may fail to gain traction.
Technical outlook: XRP upholds a neutral-to-bullish outlook
XRP trades at $1.42, holding just above the 50-day Exponential Moving Average (EMA) at $1.41 while oscillating around the 23.6% Fibonacci retracement at $1.42, applied on the daily chart between the January 6 high of $2.41 the February 6 low of $1.12. This outlook upholds a neutral-to-slightly-bullish near-term tone as long as the immediate support is defended.
The Relative Strength Index (RSI) around 55 on the daily chart and the Moving Average Convergence Divergence's (MACD) positive histogram suggest constructive, but not overstretched, upside momentum, even as the price remains well-capped beneath the 100-day and 200-day EMAs.
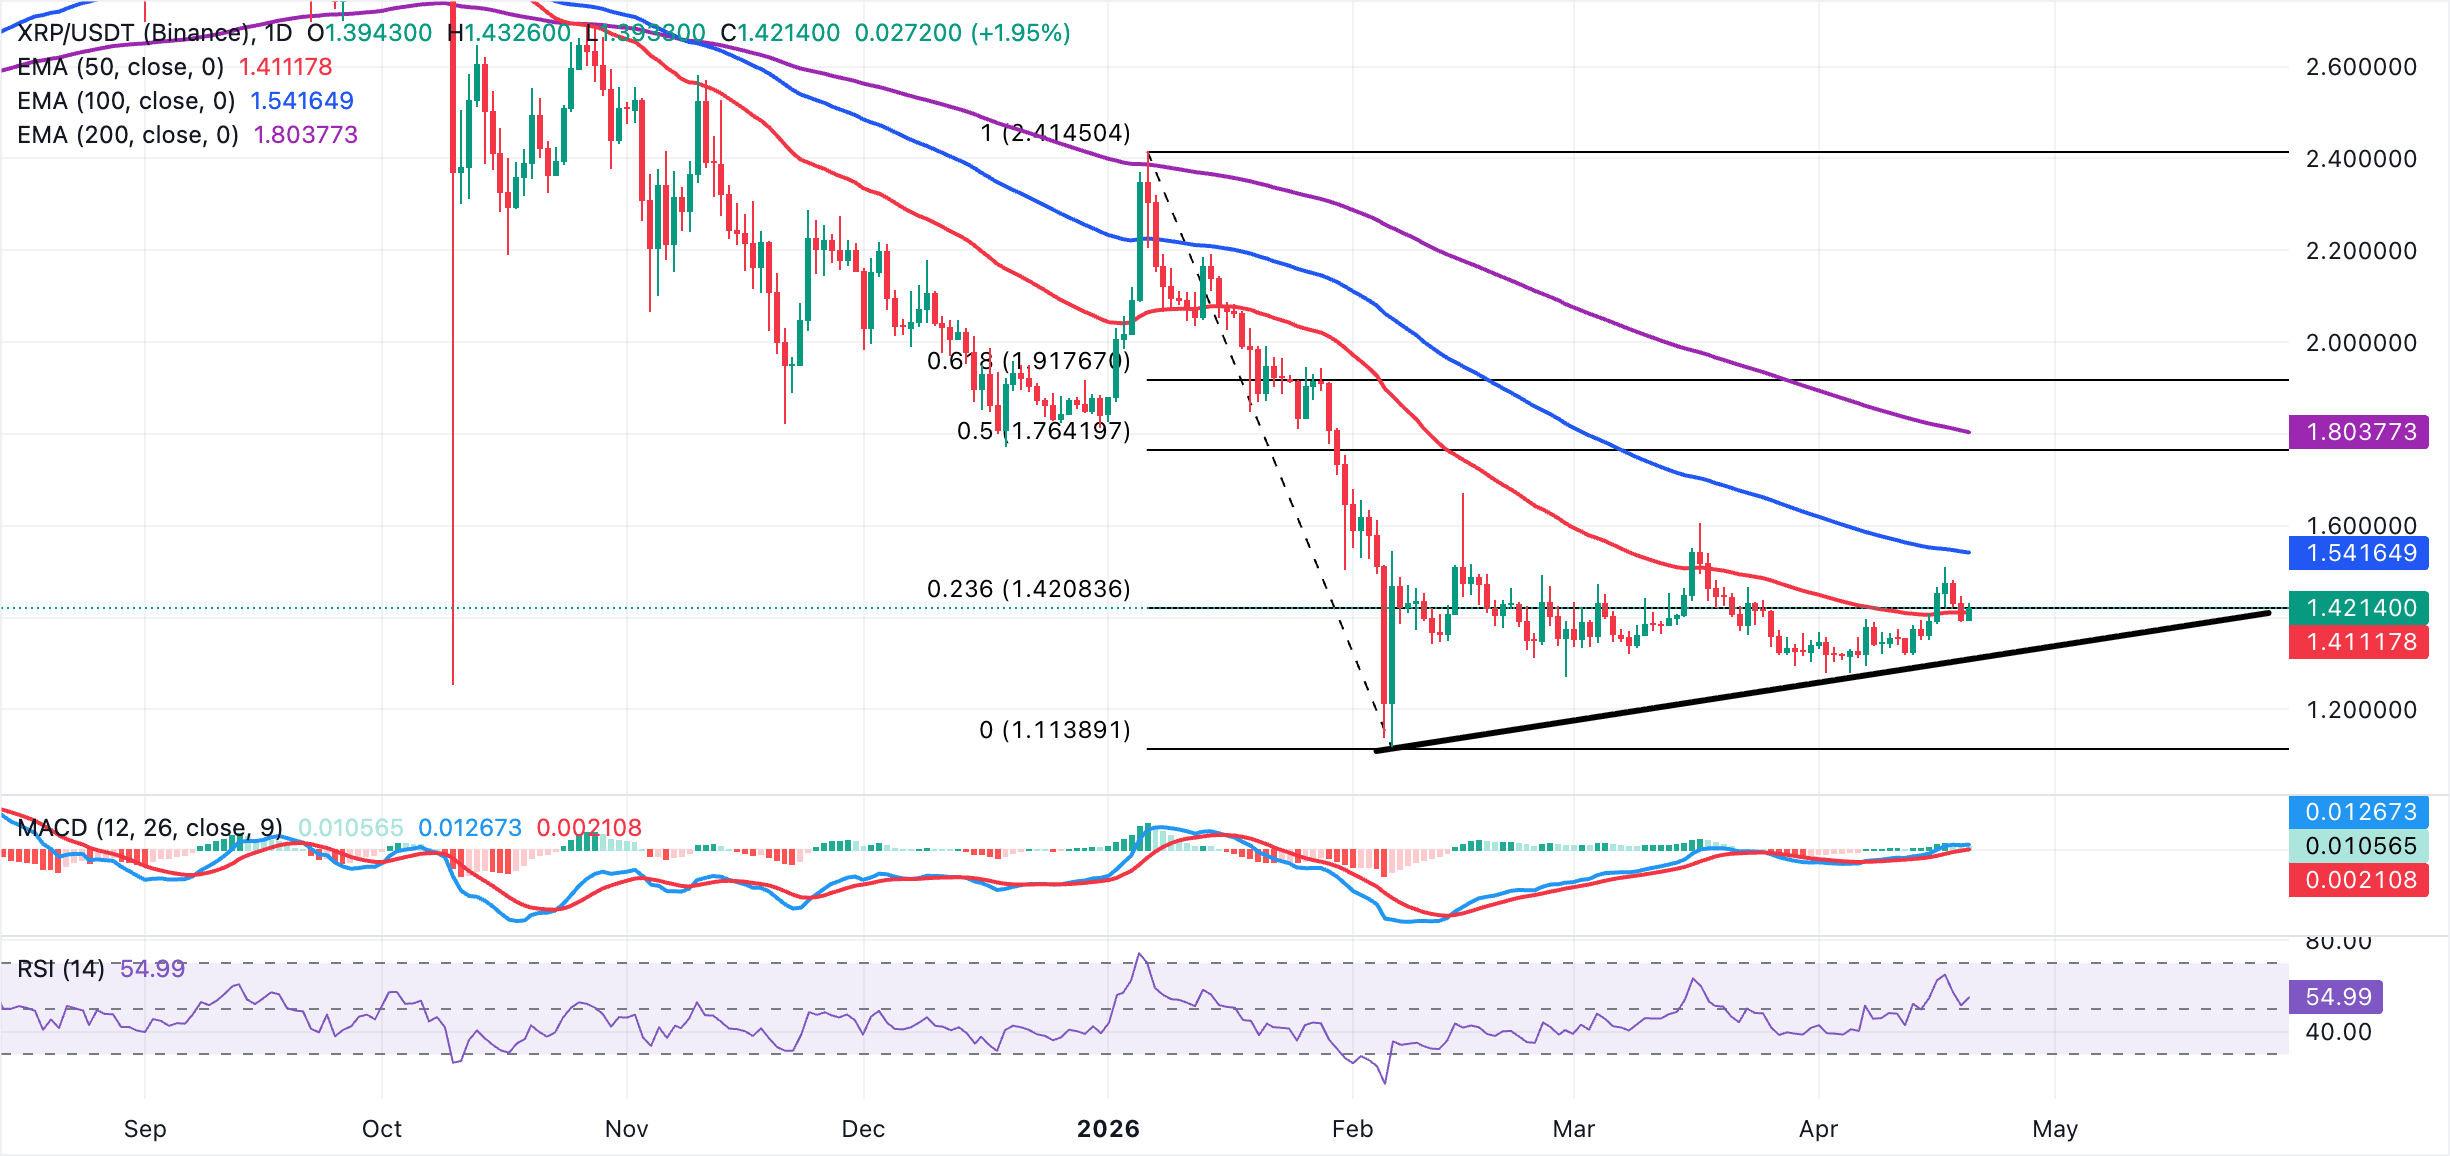
On the topside, initial resistance emerges at the 100-day EMA near $1.54, ahead of the 38.2% Fibonacci retracement at $1.61. A daily close above these barriers would strengthen the recovery attempt toward $1.76 and the 200-day EMA around $1.80. On the downside, immediate support is at the 50-day EMA at $1.41, with a deeper pullback exposing the ascending trendline around $1.31.
Cryptocurrency metrics FAQs
The developer or creator of each cryptocurrency decides on the total number of tokens that can be minted or issued. Only a certain number of these assets can be minted by mining, staking or other mechanisms. This is defined by the algorithm of the underlying blockchain technology. On the other hand, circulating supply can also be decreased via actions such as burning tokens, or mistakenly sending assets to addresses of other incompatible blockchains.
Market capitalization is the result of multiplying the circulating supply of a certain asset by the asset’s current market value.
Trading volume refers to the total number of tokens for a specific asset that has been transacted or exchanged between buyers and sellers within set trading hours, for example, 24 hours. It is used to gauge market sentiment, this metric combines all volumes on centralized exchanges and decentralized exchanges. Increasing trading volume often denotes the demand for a certain asset as more people are buying and selling the cryptocurrency.
Funding rates are a concept designed to encourage traders to take positions and ensure perpetual contract prices match spot markets. It defines a mechanism by exchanges to ensure that future prices and index prices periodic payments regularly converge. When the funding rate is positive, the price of the perpetual contract is higher than the mark price. This means traders who are bullish and have opened long positions pay traders who are in short positions. On the other hand, a negative funding rate means perpetual prices are below the mark price, and hence traders with short positions pay traders who have opened long positions.
(The technical analysis of this story was written with the help of an AI tool.)

Lebih sejuta pengguna bergantung pada FXStreet untuk data pasaran masa nyata, alat carta, pandangan pakar dan berita Forex. Kalendar ekonomi yang komprehensif dan webinar pendidikan mereka membantu pedagang kekal bermaklumat dan membuat keputusan yang dikira. FXStreet disokong oleh pasukan kira-kira 60 profesional di ibu pejabat Barcelona dan pelbagai wilayah global.
Baca Lagi


