
Weak ETF flows and retail demand weigh on XRP
Oleh John Isige
Tarikh Diterbitkan: 24 Feb 2026 | Tarikh Diubah: 24 Feb 2026


ARTIKEL POPULAR

Ripple (XRP) is edging lower, trading above its intraday low of $1.32 at the time of writing on Tuesday. The decline from its weekly opening of $1.39 reflects heightened volatility in the broader cryptocurrency market, accentuated by tariff-triggered uncertainty.
- XRP hovers above $1.33, weighed down by macroeconomic headwinds.
- XRP spot ETFs are facing declining interest, with no activity since Friday, as institutional investors reduce their exposure.
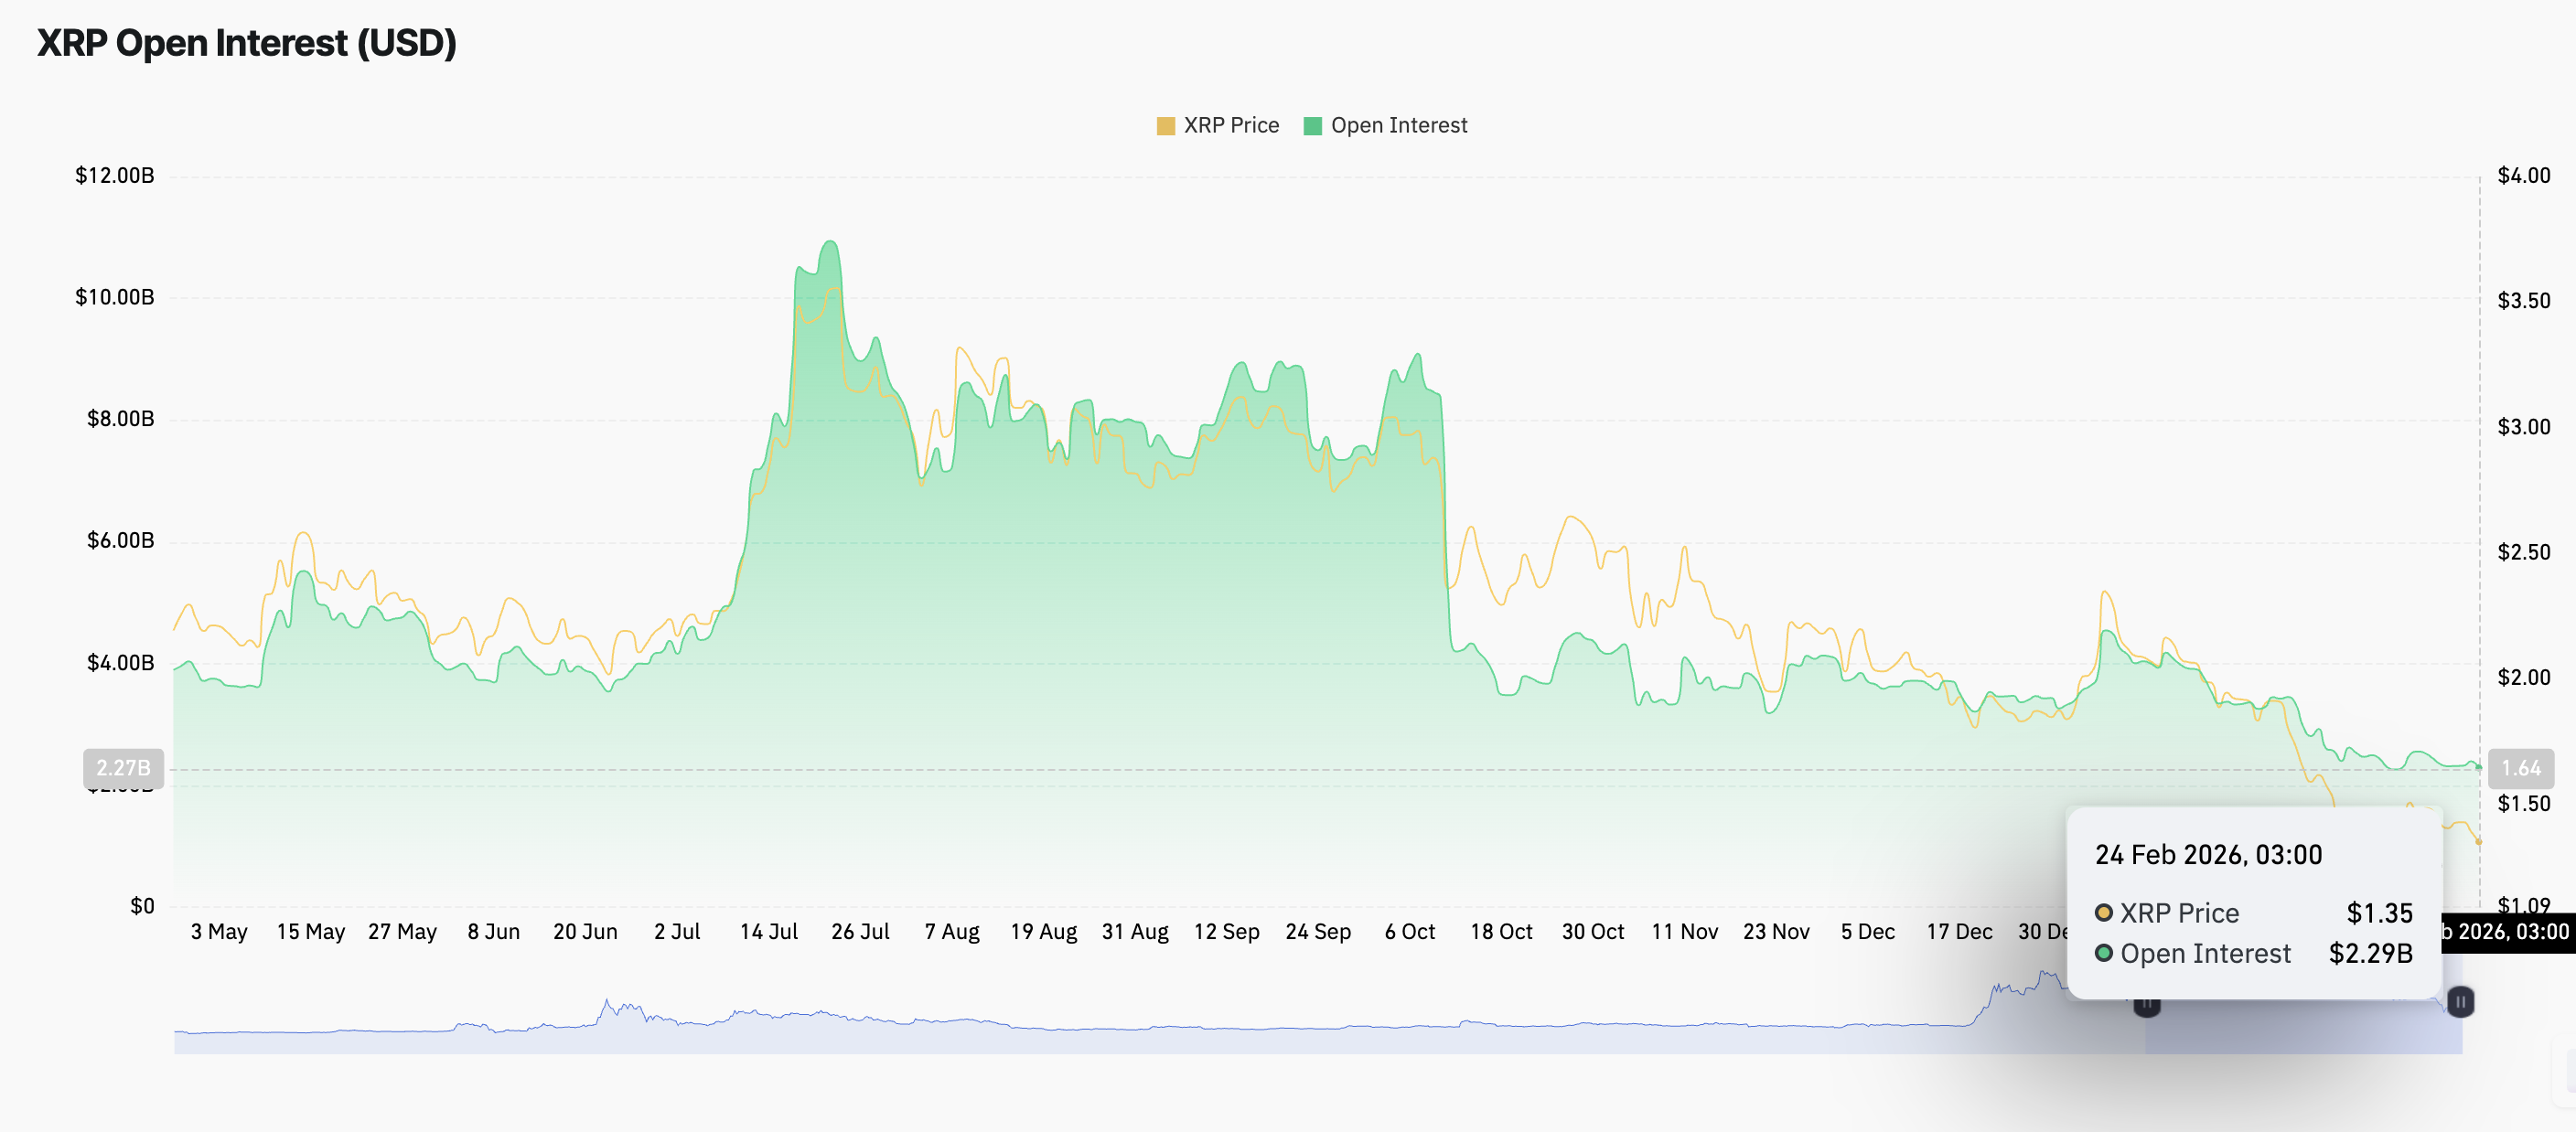
- Retail demand remains on the back foot, with futures Open Interest falling to $2.29 billion on Tuesday.
Ripple (XRP) is edging lower, trading above its intraday low of $1.32 at the time of writing on Tuesday. The decline from its weekly opening of $1.39 reflects heightened volatility in the broader cryptocurrency market, accentuated by tariff-triggered uncertainty.
Investors in risk assets remain on edge as the United States (US) trade partners brace for a fresh 10% 150-day temporary tariff on Tuesday, which could also be raised to 15%. The change in tariff policy comes after the Supreme Court struck down earlier duties imposed by President Donald Trump aimed at reducing the trade deficit.
Meanwhile, XRP continues to trade under heavy pressure, weighed down by weak technical, risk-off sentiment in the broader institutional space and low retail demand.
XRP slides amid cooling ETF demand
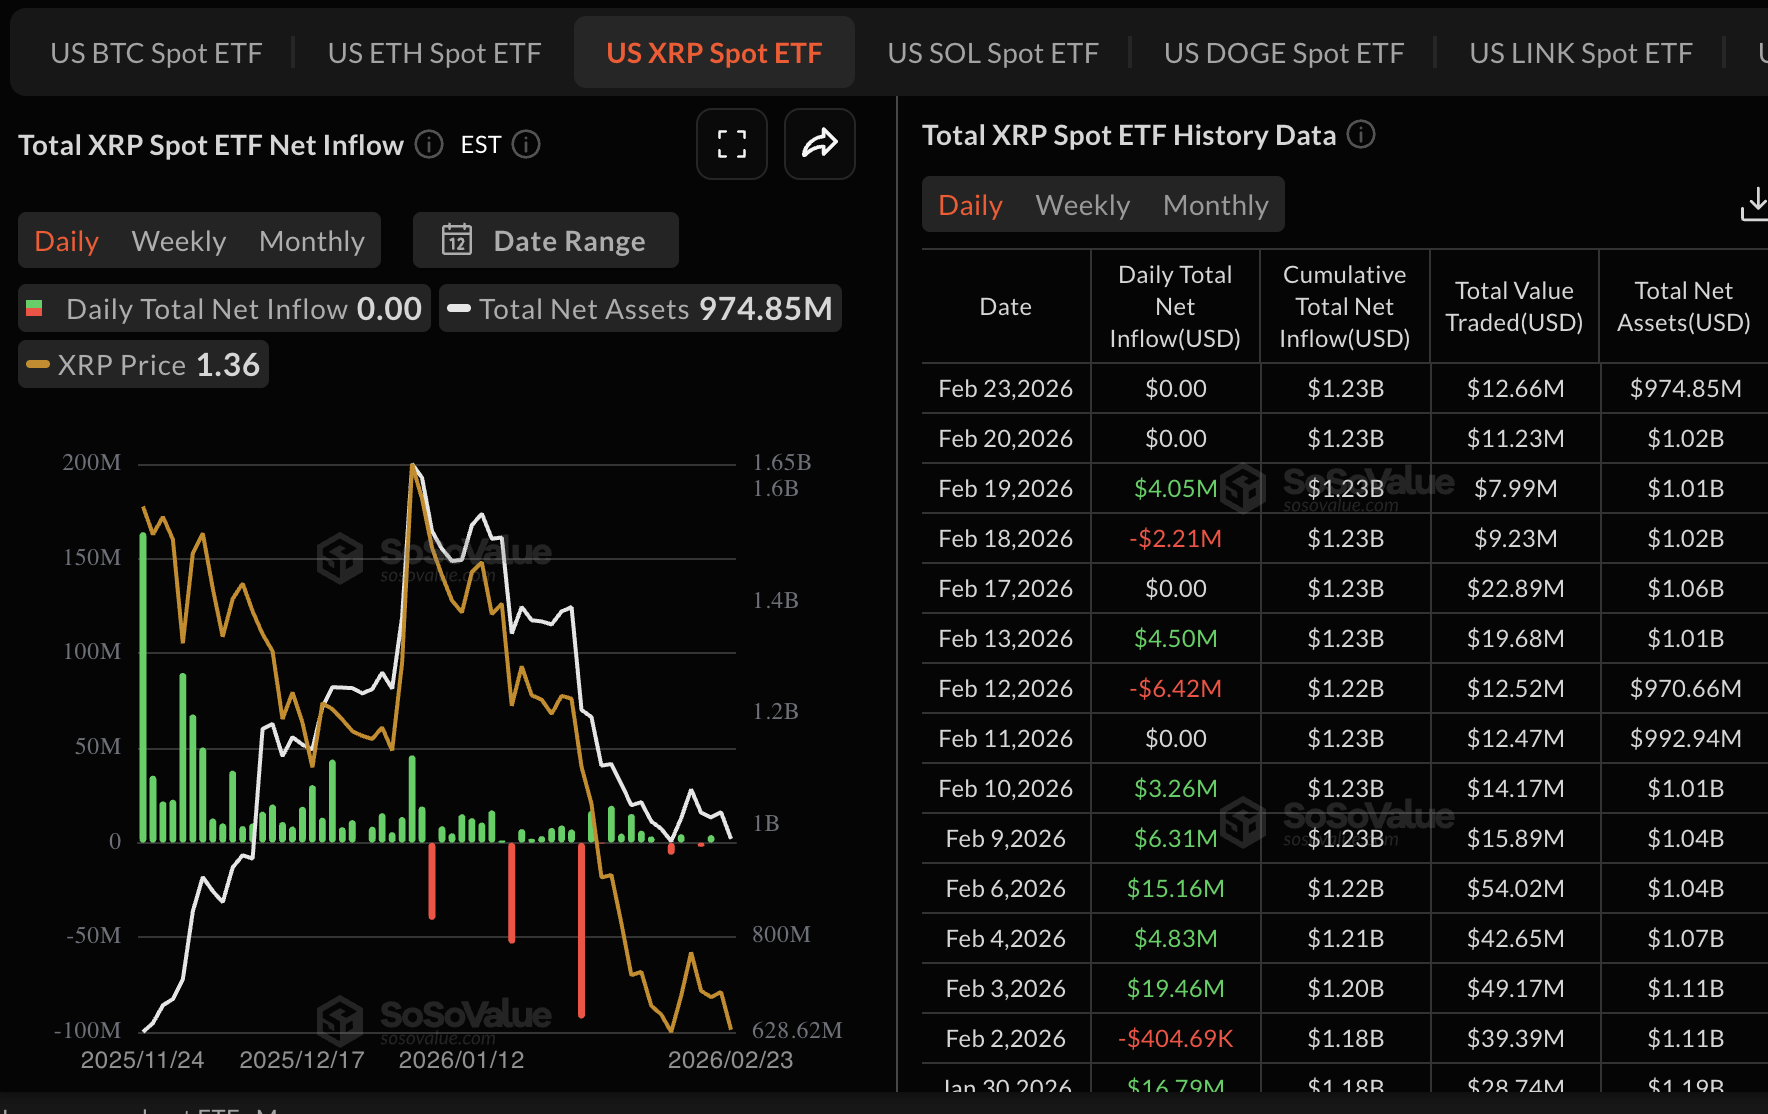
The prevailing risk-off sentiment has seen investors remain on the sidelines, resulting in muted activity in the XRP spot Exchange-Traded Funds (ETF) market. According to SoSoValue, XRP ETFs have continued to face subdued activity, with no flows since Friday. Cumulative inflows average $1.23 billion, with net assets under management at $875 million.
At the same time, the derivatives market is extending its weakness, as futures Open Interest (OI) falls to $2.29 billion on Tuesday, from $2.40 billion the previous day. The OI has persistently declined from the record $10.94 billion in July, which also coincided with the all-time high of $3.66, undermining retail interest in the remittance token.
Technical outlook: XRP risks a 5% decline amid weak technicals
XRP hovers at $1.33 on the daily chart, held down by a prevailing bearish bias. The remittance sits well below the 50-day Exponential Moving Average (EMA), 100- and 200-day EMAs, clustered between $1.64 and $2.08, underscoring a dominant downward trend.
Meanwhile, the Moving Average Convergence Divergence (MACD) line remains above the signal line, limiting XRP to modest upside corrections within a broader bearish context. The Relative Strength Index (RSI) near 34 signals weak momentum, but it is not oversold yet.
-1771940820859-1771940820860.png)
On the other hand, immediate resistance emerges at the recent reaction high near $1.51, where prior rebounds stalled, followed by the 50-day EMA around $1.64. Still, initial support is seen around $1.30, the latest closing low, with a break exposing the psychological $1.25 region as the next bearish objective. Sustained trading below these levels would keep sellers in control and maintain pressure toward lower daily lows.
Cryptocurrency prices FAQs
Token launches influence demand and adoption among market participants. Listings on crypto exchanges deepen the liquidity for an asset and add new participants to an asset’s network. This is typically bullish for a digital asset.
A hack is an event in which an attacker captures a large volume of the asset from a DeFi bridge or hot wallet of an exchange or any other crypto platform via exploits, bugs or other methods. The exploiter then transfers these tokens out of the exchange platforms to ultimately sell or swap the assets for other cryptocurrencies or stablecoins. Such events often involve an en masse panic triggering a sell-off in the affected assets.
Macroeconomic events like the US Federal Reserve’s decision on interest rates influence crypto assets mainly through the direct impact they have on the US Dollar. An increase in interest rate typically negatively influences Bitcoin and altcoin prices, and vice versa. If the US Dollar index declines, risk assets and associated leverage for trading gets cheaper, in turn driving crypto prices higher.
Halvings are typically considered bullish events as they slash the block reward in half for miners, constricting the supply of the asset. At consistent demand if the supply reduces, the asset’s price climbs.
(The technical analysis of this story was written with the help of an AI tool.)

Lebih sejuta pengguna bergantung pada FXStreet untuk data pasaran masa nyata, alat carta, pandangan pakar dan berita Forex. Kalendar ekonomi yang komprehensif dan webinar pendidikan mereka membantu pedagang kekal bermaklumat dan membuat keputusan yang dikira. FXStreet disokong oleh pasukan kira-kira 60 profesional di ibu pejabat Barcelona dan pelbagai wilayah global.
Baca Lagi


