
Silver Price Forecast: XAG/USD rally pauses below 50-day SMA after intraday surge
Oleh Vishal Chaturvedi
Dikemas kini: 6 May 2026


ARTIKEL POPULAR

Silver (XAG/USD) gains traction on Wednesday as renewed optimism surrounding a potential US-Iran peace deal triggers a sharp decline in the US Dollar (USD) and Oil prices. At the time of writing, XAG/USD is trading around 77, up over 5.50% on the day.
- Silver rallies as hopes for a US-Iran deal pressure the US Dollar and Treasury yields
- Technically, XAG/USD remains capped below the 50-day and 100-day SMAs despite strong intraday gains.
- Improving RSI and positive MACD readings support recovery momentum, though weak ADX signals a consolidative outlook.
Silver (XAG/USD) gains traction on Wednesday as renewed optimism surrounding a potential US-Iran peace deal triggers a sharp decline in the US Dollar (USD) and Oil prices. At the time of writing, XAG/USD is trading around 77, up over 5.50% on the day.
The latest leg higher comes after Axios reported that Washington and Tehran are moving closer to a potential agreement aimed at ending the war and establishing a framework for detailed nuclear negotiations.
The sharp decline in crude Oil helped ease immediate inflation concerns, pushing US Treasury yields lower and providing additional support to the non-yielding metal. Traders also shifted back toward pricing in the possibility of Federal Reserve (Fed) rate cuts by year-end.
Despite the renewed optimism, uncertainty over whether the US and Iran can reach a final agreement continues to keep markets on edge, limiting further upside in Silver. The technical outlook also points to a possible consolidation phase following the intraday surge.
Technical Analysis:
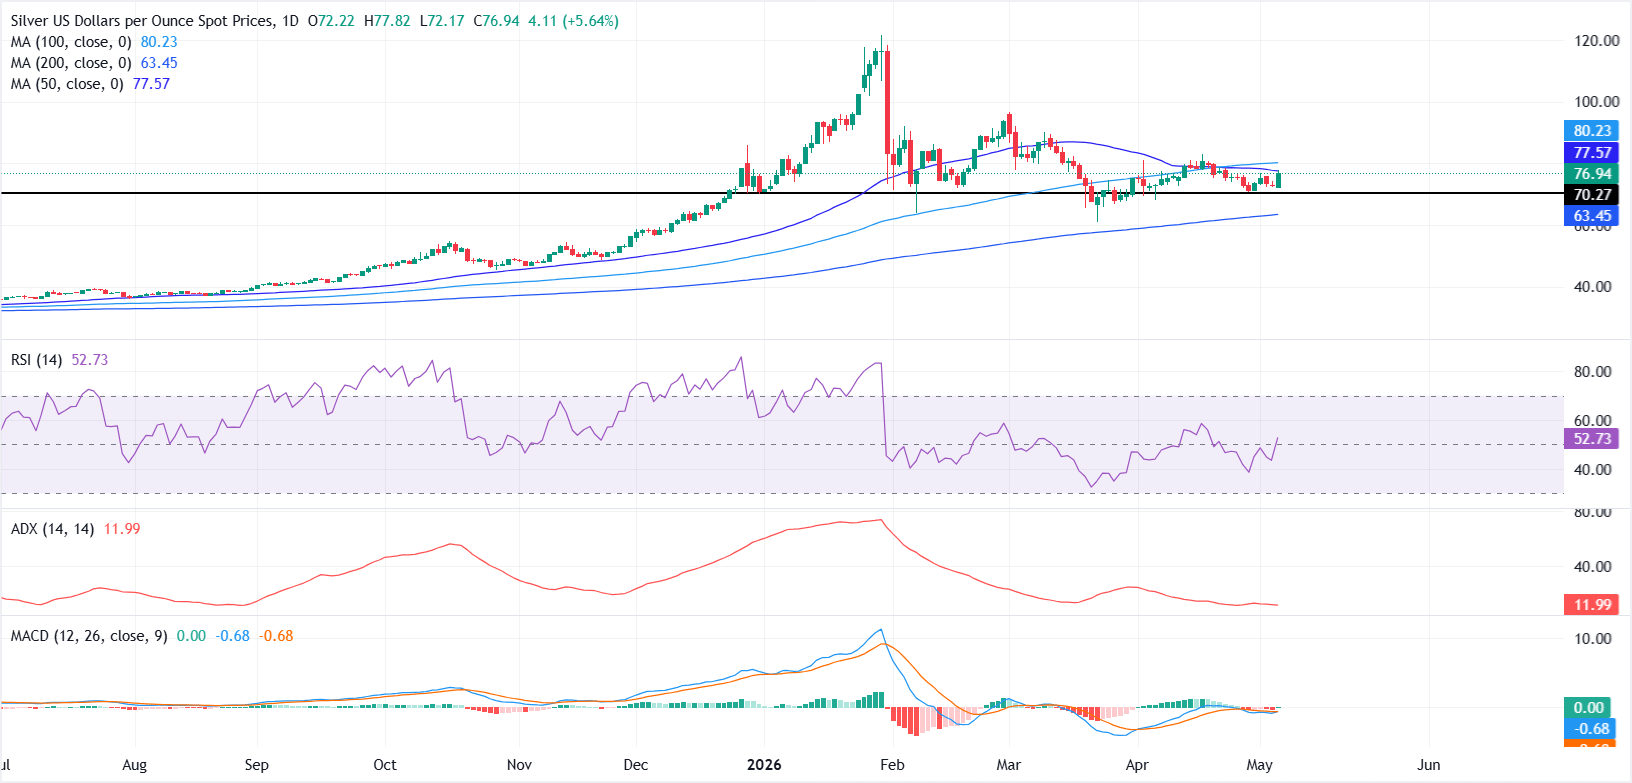
In the daily chart, XAG/USD remains capped in the near term, as spot holds below the 50-day Simple Moving Average (SMA) and the 100-day SMA, keeping recovery attempts vulnerable while those barriers stand overhead.
Momentum has improved, with the Relative Strength Index near 53 and the Moving Average Convergence Divergence (MACD) fractionally positive, but the subdued Average Directional Index around 12 suggests a weak underlying trend, hinting at consolidation rather than a sustained breakout.
On the topside, initial resistance is aligned at the 50-day SMA at $77, with a stronger hurdle emerging at the 100-day SMA near $80, where a daily close above would be needed to ease the current capped tone.
On the downside, initial support is seen in the $70.00-$71.00 zone, while the 200-day SMA at $63 offers the next significant structural support, and while it sits well below current prices, it defines the broader bullish floor that would need to give way to signal a deeper bearish reversal.
(The technical analysis of this story was written with the help of an AI tool.)
Silver FAQs
Silver is a precious metal highly traded among investors. It has been historically used as a store of value and a medium of exchange. Although less popular than Gold, traders may turn to Silver to diversify their investment portfolio, for its intrinsic value or as a potential hedge during high-inflation periods. Investors can buy physical Silver, in coins or in bars, or trade it through vehicles such as Exchange Traded Funds, which track its price on international markets.
Silver prices can move due to a wide range of factors. Geopolitical instability or fears of a deep recession can make Silver price escalate due to its safe-haven status, although to a lesser extent than Gold's. As a yieldless asset, Silver tends to rise with lower interest rates. Its moves also depend on how the US Dollar (USD) behaves as the asset is priced in dollars (XAG/USD). A strong Dollar tends to keep the price of Silver at bay, whereas a weaker Dollar is likely to propel prices up. Other factors such as investment demand, mining supply – Silver is much more abundant than Gold – and recycling rates can also affect prices.
Silver is widely used in industry, particularly in sectors such as electronics or solar energy, as it has one of the highest electric conductivity of all metals – more than Copper and Gold. A surge in demand can increase prices, while a decline tends to lower them. Dynamics in the US, Chinese and Indian economies can also contribute to price swings: for the US and particularly China, their big industrial sectors use Silver in various processes; in India, consumers’ demand for the precious metal for jewellery also plays a key role in setting prices.
Silver prices tend to follow Gold's moves. When Gold prices rise, Silver typically follows suit, as their status as safe-haven assets is similar. The Gold/Silver ratio, which shows the number of ounces of Silver needed to equal the value of one ounce of Gold, may help to determine the relative valuation between both metals. Some investors may consider a high ratio as an indicator that Silver is undervalued, or Gold is overvalued. On the contrary, a low ratio might suggest that Gold is undervalued relative to Silver.

Lebih sejuta pengguna bergantung pada FXStreet untuk data pasaran masa nyata, alat carta, pandangan pakar dan berita Forex. Kalendar ekonomi yang komprehensif dan webinar pendidikan mereka membantu pedagang kekal bermaklumat dan membuat keputusan yang dikira. FXStreet disokong oleh pasukan kira-kira 60 profesional di ibu pejabat Barcelona dan pelbagai wilayah global.
Baca Lagi


